Important
Traducerea este un efort al comunității, la care puteți să vă alăturați. În prezent, această pagină este tradusă 47.51%.
14.6. Lesson: Creating Detailed Maps with the Atlas Tool
Proiectarea sistematică de eșantionare este gata, iar echipele de teren și-au încărcat coordonatele GPS în dispozitivele de navigare. Există, de asemenea, un formular pentru date, în care se vor colecta informațiile măsurate pentru fiecare schiță. Pentru a găsi mai ușor drumul spre fiecare parcelă, s-au solicitat o serie de hărți detaliate, în cazul în care unele informații din teren pot fi văzute în mod clar, împreună cu un subset mic de schițe și câteva informații despre zonă. Puteți utiliza instrumentul Atlas pentru a genera automat o serie de hărți, având un format comun.
Scopul acestei lecții: Aflați cum să utilizați instrumentul Atlas în QGIS, pentru a genera hărți tipăribile detaliate, în scopul sprijinirii activității de inventariere în teren.
14.6.1. ★☆☆ Follow Along: Preparing the Print Layout
Înainte de a putea automatiza hărțile detaliate ale zonei forestiere și schițele noastre de eșantionare, trebuie să creăm un șablon cu toate elementele pe care le considerăm utile în munca de teren. Desigur, cea mai importantă va fi o stilizare corectă, dar, după cum ați văzut mai înainte, va trebui să adăugați și o mulțime de alte elemente care completează harta tipărită.
Deschideți proiectul QGIS din lecția anterioară
forest_inventory.qgs. Ar trebui să aveți cel puțin următoarele straturi:forest_stands_2012(with a 50% transparency, green fill and darker green border lines)systematic_plots_cliprautjarvi_aerial
Salvați proiectul sub un nume nou,
map_creation.qgs.
To create a printable map, remember that you use the Layout Manager:
Open
 Layout Manager….
In the Layout manager dialog:
Under New from template, press the Create… button next to the Empty layout entry
Name your print layout
forest_map.Press OK. A new print layout is created and opened, showing a blank paper.
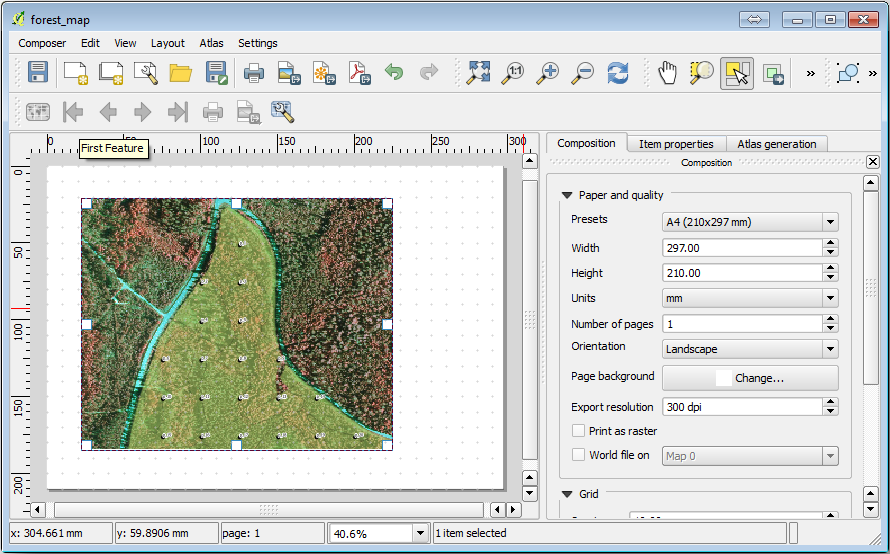
In the print Layout window, ensure properties are set for an A4 paper:
Right-click over the paper and select Page properties. The Page properties panel is open on the right side of the layout.
Asigurați-vă că Dimensiunea este A4.
Asigurați-vă că Orientarea este Peisaj.
Enable the Layout tab next to the Page properties panel and set Export resolution to
300 dpi.
Composing a map is easier if you make use of the canvas grid to position the different elements. Review the settings for the layout grid:
In the Layout tab expand the Guides and Grid region.
Check that Grid spacing is set to
10 mmand that Snap tolerance is set to5 px.
Trebuie să activați folosirea grilei:
Deschideți meniul :menuselection:`Vizualizare
Bifați Afișarea grilei.
Bifați Acroșare la grilă.
Notice that options for using Guides are checked by default, which allows you to see guiding lines when you are moving elements in the layout.
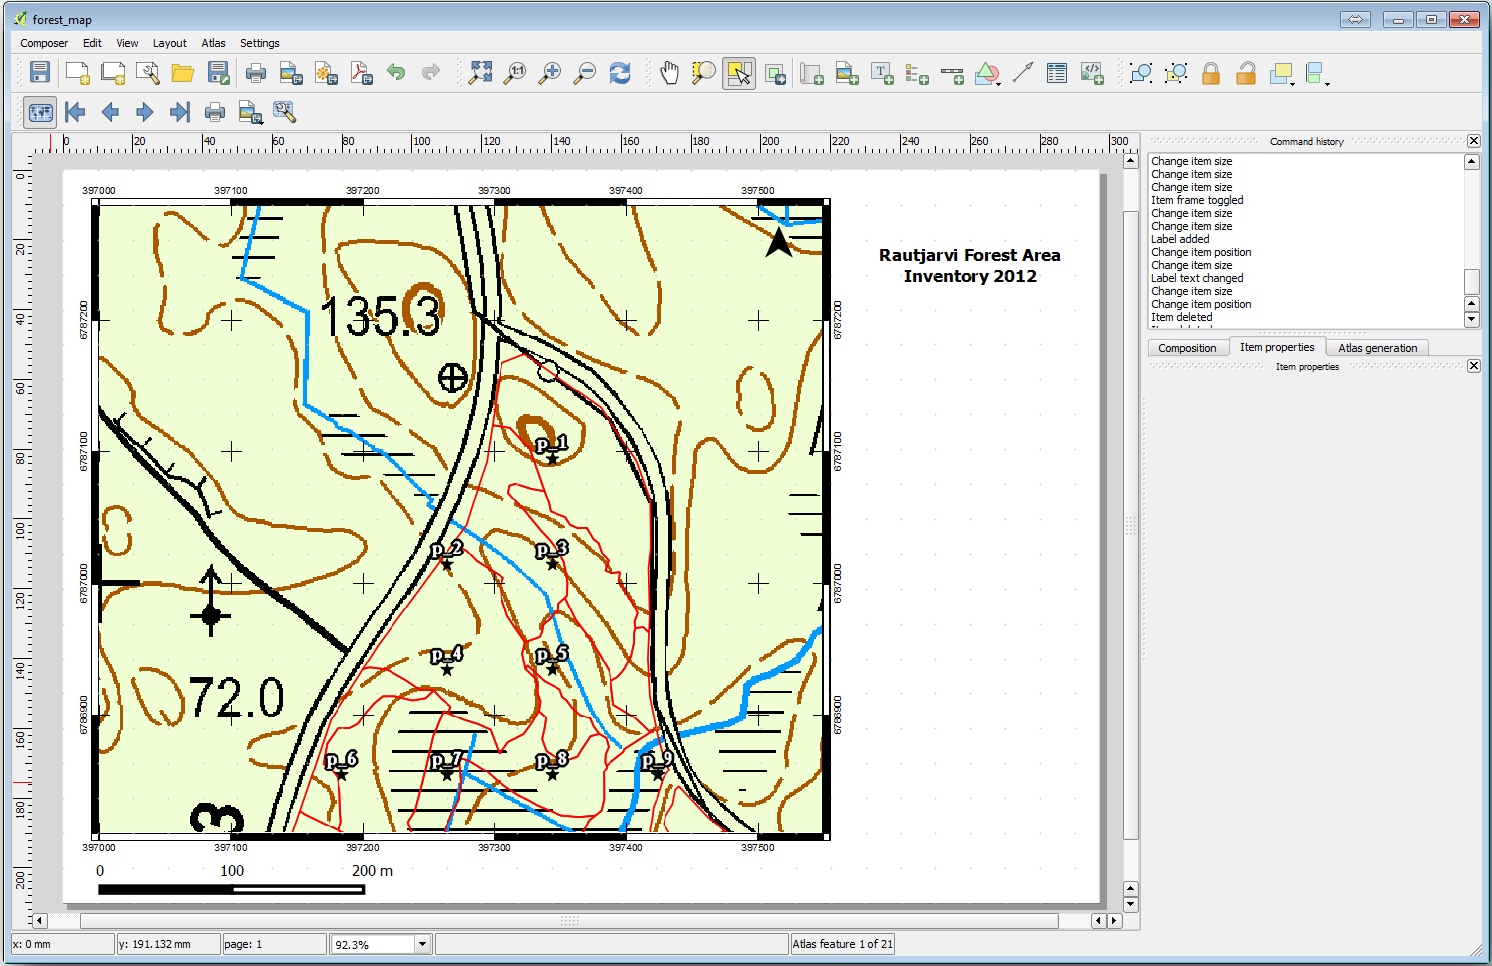
Now you can start to add elements to your layout. Add first a map element so you can review how the map canvas looks as you will be making changes in the layers symbology:
Click on the
 Add Map button.
Țineți apăsat butonul stâng al mouse-ului și trasați un dreptunghi în care să încadrați cea mai mare parte a hărții.
Observați modul în care cursorul mouse-ului se acroșează la grila canevasului. Utilizați această funcție atunci când adăugați alte elemente. Dacă doriți să aveți mai multă acuratețe, schimbați setările de Spațiere ale grilei. Dacă dintr-un motiv oarecare nu mai doriți acroșarea la grilă la un moment dat, puteți întotdeauna bifa sau debifa meniul .
14.6.2. ★☆☆ Follow Along: Adding Background Map
Leave the layout open but go back to the map. Let’s add some background data and create some styling so that the map content is as clear as possible.
Add the background raster
basic_map.tifthat you can find in theexercise_data\forestry\folder.If prompted select the ETRS89 / ETRS-TM35FIN CRS for the raster.
După cum puteți vedea, harta de fundal este deja stilizată. Acest tip de raster cartografic gata de utilizare este foarte frecvent. El este creat din date vectoriale, stilizate într-un format standard și stocate ca un raster, așa că nu trebuie să vă îngrijoreze obținerea unui rezultat bun.
Acum măriți schițele dvs., astfel încât să puteți vedea doar aproximativ patru sau cinci linii de parcele.
The current styling of the sample plots is not the best:
While during the last exercises, the white buffer was OK on top of the aerial image, now that the background image is mostly white you barely can see the labels. But how does it look in the print layout? Let’s check it:
Go to the print layout window.
Use the
 Select/Move item button to select the map element
in the layout.
Select/Move item button to select the map element
in the layout.Mergeți la fila Proprietățile itemului tab.
Click on
 Set map extent to match main canvas extent.
If you need to refresh the element, click on
 Update map preview.
Obviously this is not good enough; you want to make the plot numbers as clearly visible as possible for the field teams.
14.6.3. ★☆☆ Try Yourself: Changing the Symbology of the Layers
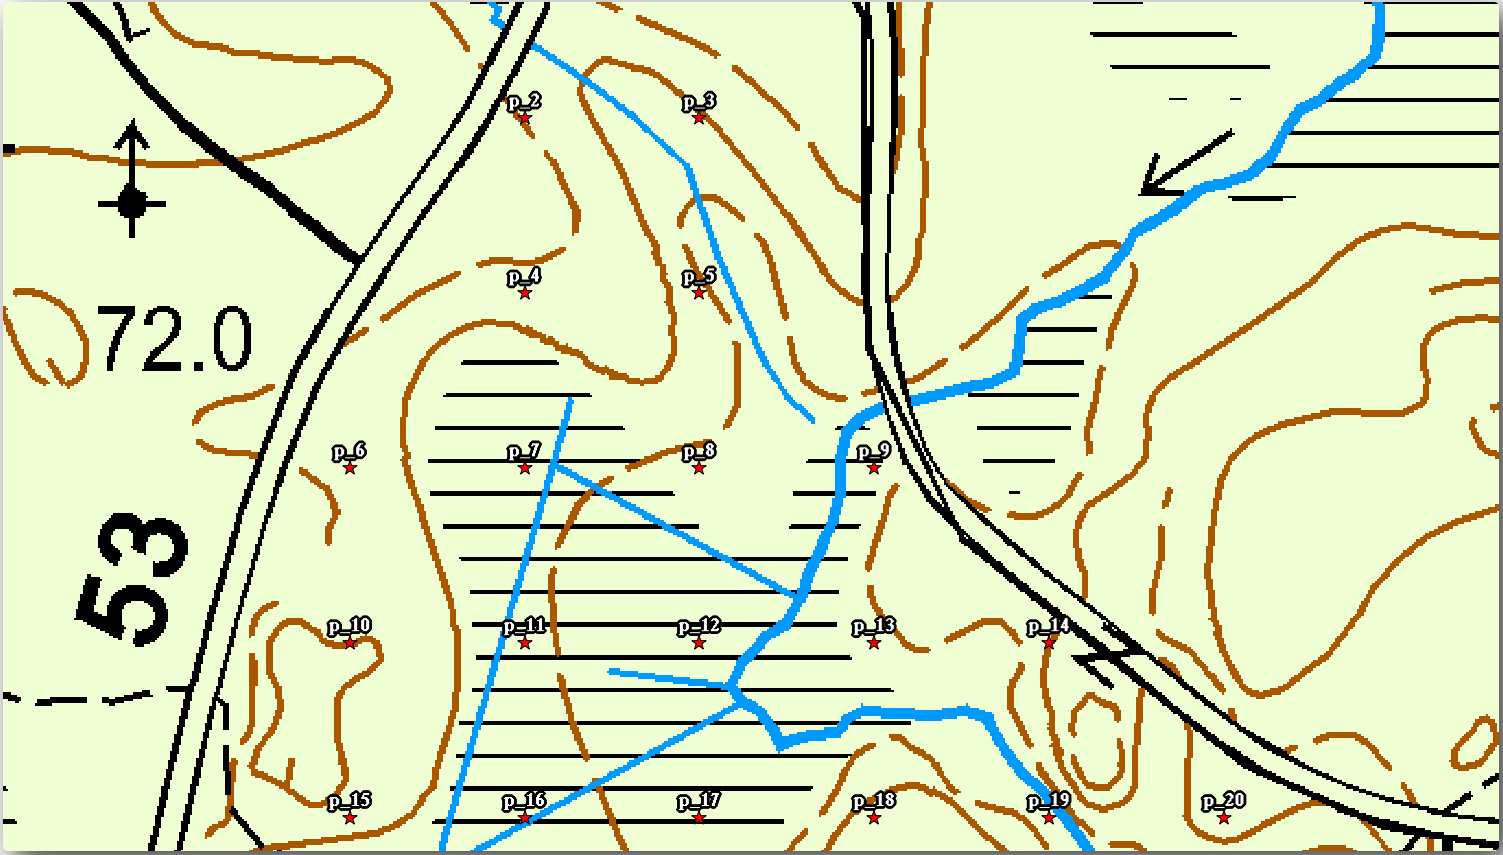
Ați exersat simbologia cu Modulul;: Crearea și Explorarea unei Hărți de Bază, și etichetarea cu Module: Classifying Vector Data. Reveniți la aceste module dacă trebuie să vă reamintiți unele dintre opțiunile și instrumentele disponibile. Scopul dvs. este de a afișa locațiile loturilor și numele lor cât mai clar, dar întotdeauna să fie posibilă vizualizarea elementelor din fundalul hărții. Vă puteți orienta după această imagine:
You will use later the the green styling of the forest_stands_2012 layer.
In order to keep it, and have a visualization of it that shows only the stand borders:
Right click on
forest_stands_2012and select DuplicateObțineți un nou strat numit
forest_stands_2012 copype care îl puteți utiliza pentru a defini un stil diferit, de ex.: fără umplere și cu margini roșii.Acum aveți două vizualizări diferite ale parcelelor împădurite și puteți decide pe care să o afișați pentru harta dvs. detaliată.
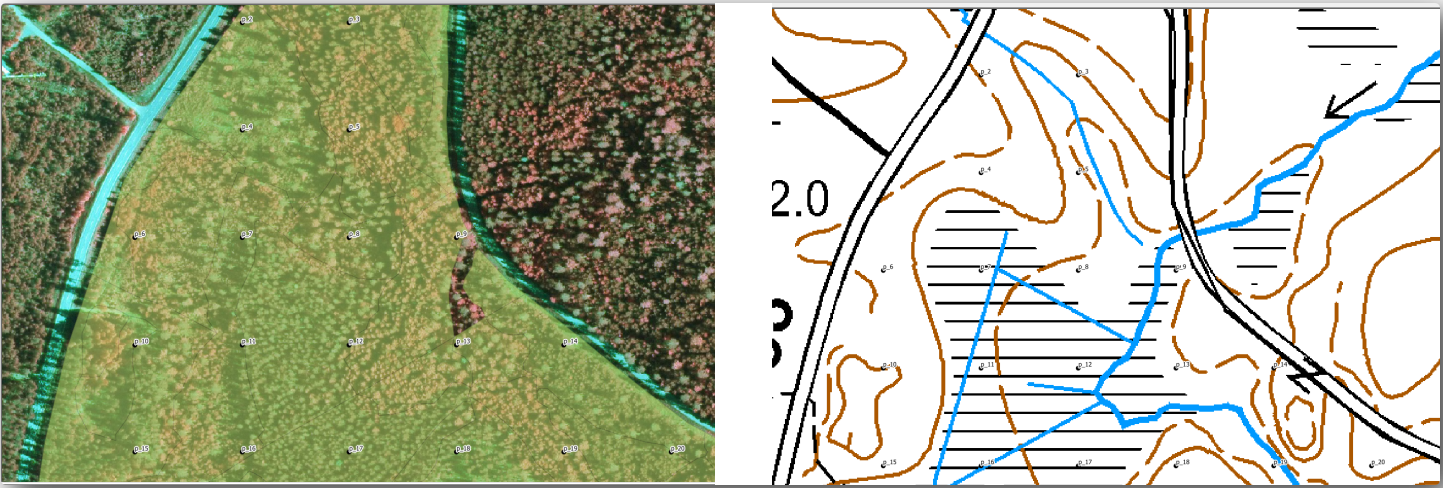
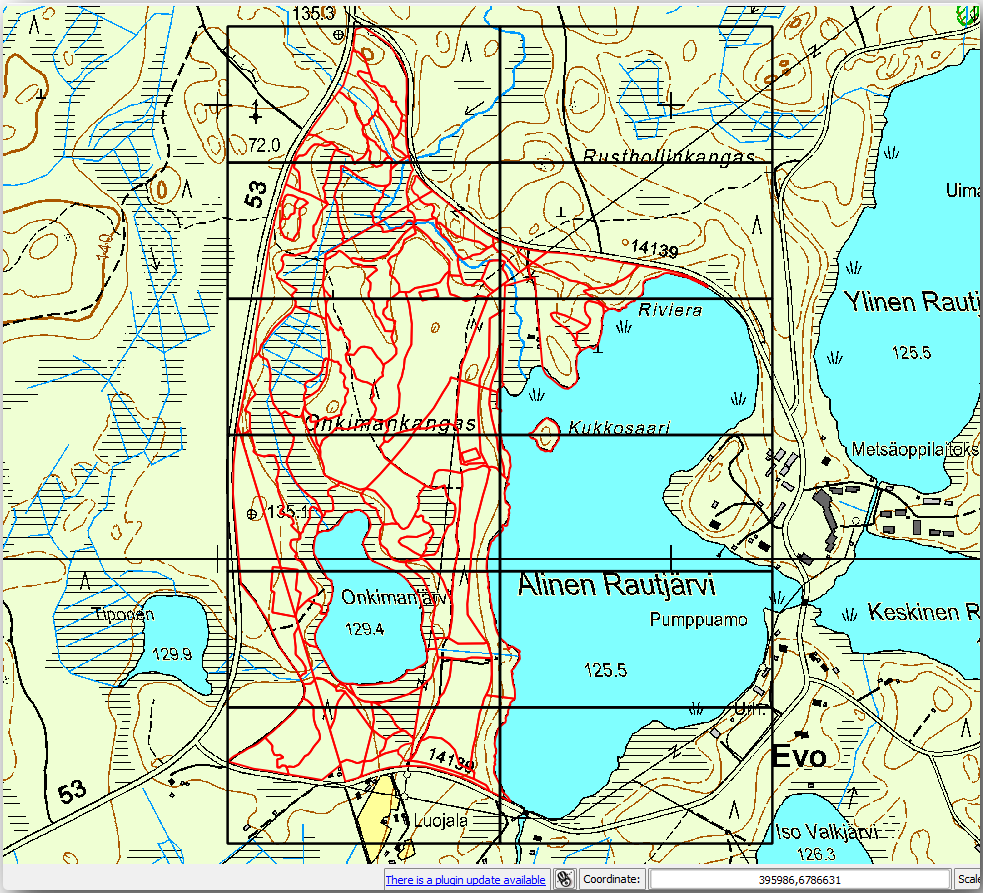
Go back to the print layout window often to see what the map would look like. For the purposes of creating detailed maps, you are looking for a symbology that looks good not at the scale of the whole forest area (left image below) but at a closer scale (right image below). Remember to use
Update map preview and
Set map extent to match main canvas extent
whenever you change the zoom in your map or the layout.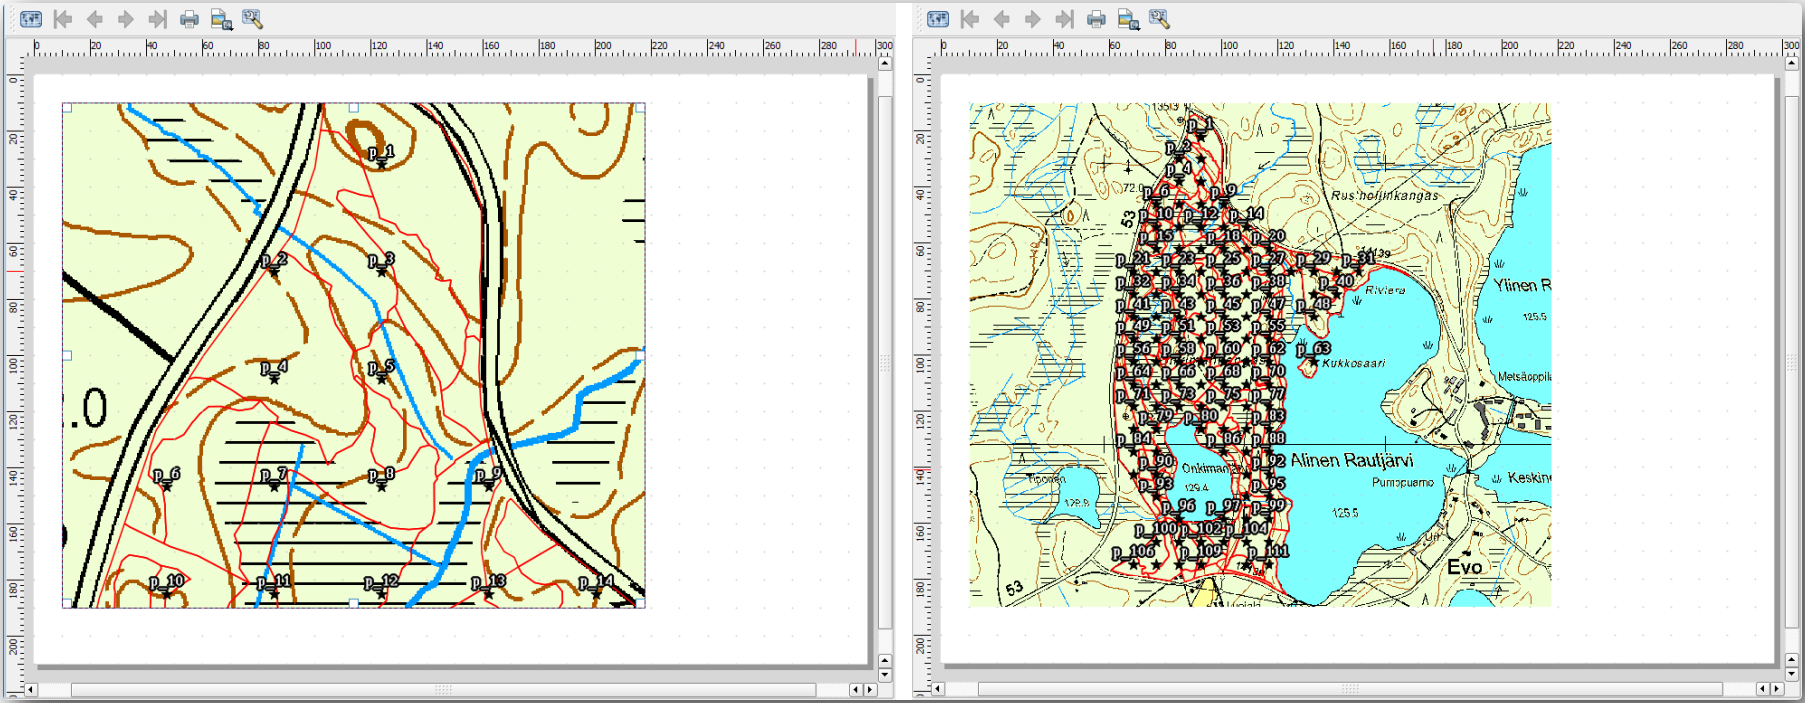
14.6.4. ★☆☆ Try Yourself: Create a Basic Map Template
Once you have a symbology you are happy with, you are ready to add some more information to your printed map. Add at least the following elements:
Titlu.
O scară grafică.
Cadrul grilei pentru harta dvs.
Coordonate situate pe părțile laterale ale grilei.
You have created a similar layout already in Module: Laying out the Maps. Go back to that module as you need. You can look at this example image for reference:
Exportați harta dvs. ca o imagine și priviți-o.
.
Use for example the JPG format.
Iată cum va arăta atunci la tipărire.
14.6.5. ★☆☆ Follow Along: Adding More Elements to the Print Layout
Așa cum probabil ați observat în imaginea hărții șablon propusă, există o mulțime de loc în partea dreaptă a canevasului. Haideți să vedem ce altceva ar putea merge acolo. Pentru scopul hărții noastre, o legendă nu este cu adevărat necesară, dar o imagine de ansamblu a hărții și niște casete de text ar putea adăuga valoare hărții.
Harta de ansamblu va ajuta echipele de teren să plaseze harta detaliată în interiorul suprafeței generală a pădurii:
Adăugați un alt element de hartă pe canevas, chiar sub textul din titlu.
În fila Proprietăților elementului, deschideți caseta cu derulare verticală Overview.
Puneți Overview frame pe Map 0. Acest lucru creează un dreptunghi umbrit deasupra hărții mici, care reprezintă extinderea vizibilă în harta mai mare.
Check also the Frame option with a black color and a Thickness of
0.30.
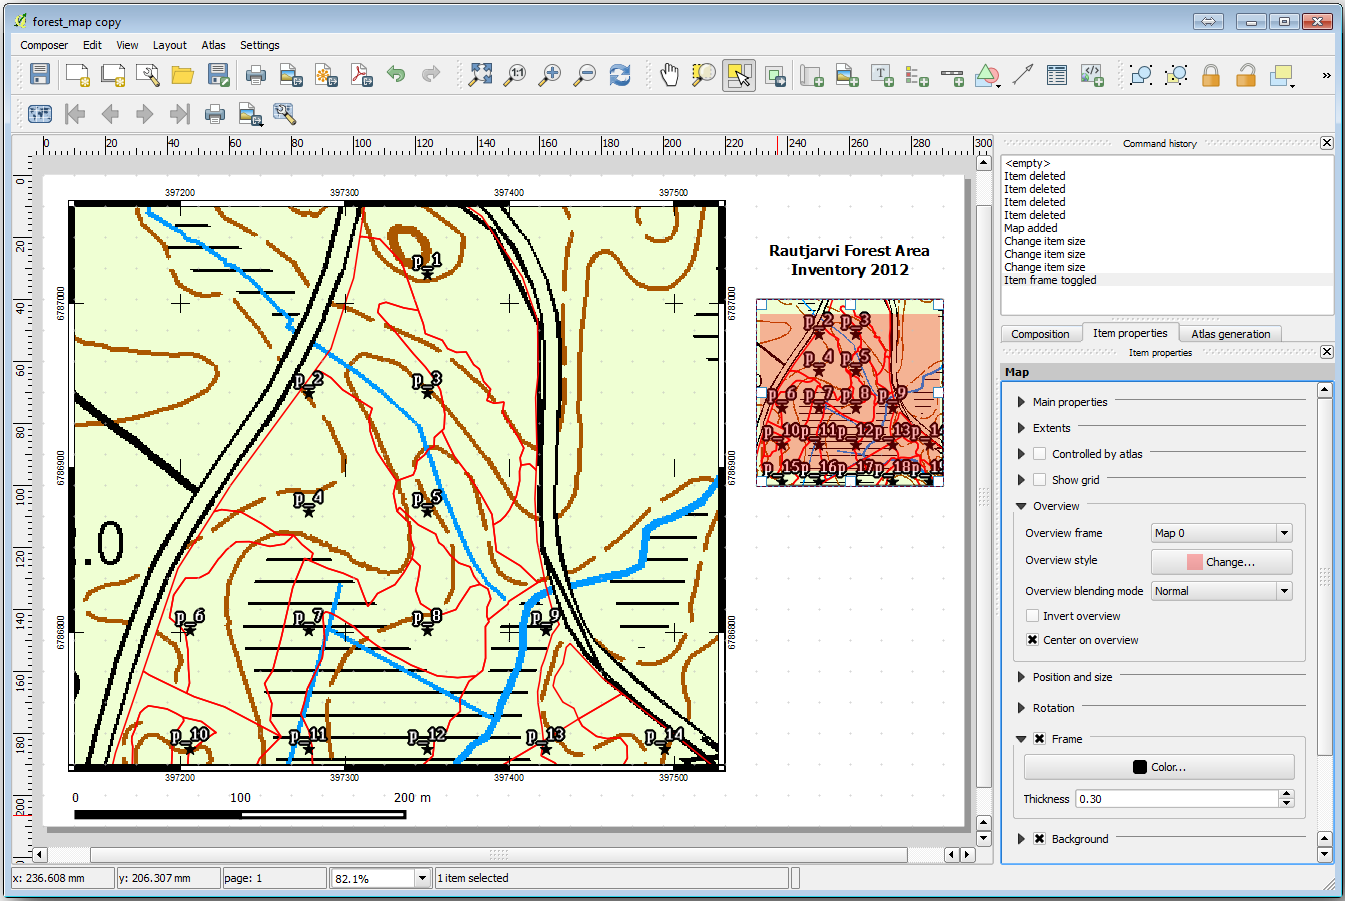
Notice that your overview map is not really giving an overview of the forest
area which is what you want. You want this map to represent the whole forest
area and you want it to show only the background map and the
forest_stands_2012 layer, and not display the sample plots. And also
you want to lock its view so it does not change anymore whenever you change
the visibility or order of the layers.
Go back to the map, but don’t close the Print Layout.
Right click the
forest_stands_2012layer and click on Zoom to Layer Extent.Deactivate all layers except for
basic_mapandforest_stands_2012.Expand the Manage map themes tool on the Layers panel and select Add theme.
Name it
basic_overview.Go back to the print layout.
With the small map selected, click the Set map extent to match main canvas extent to set its extents to what you can see in the map window.
Lock the view for the overview map by checking Follow map theme and selecting
basic_overviewunder Main properties.
Now your overview map is more what you expected and its view will not change anymore. But, of course, now your detail map is not showing anymore the stand borders nor the sample plots. Let’s fix that:
Mergeți din nou la fereastra hărții și selectați straturile pe care le doriți să fie vizibile (
systematic_plots_clip,forest_stands_2012 copyșiBasic_map).Transfocați iarăși, pentru a avea vizibile doar câteva linii ale parcelelor.
Go back to the Print Layout window.
Select the bigger map in your layout.
In Item properties click on Update preview and Set map extent to match main canvas extent.
Observați că numai harta mai mare afișează vizualizarea curentă a hărții, iar harta mai mică de ansamblu păstrează aceeași vedere pe care ați blocat-o.
Rețineți, de asemenea, că o vedere de ansamblu afișează un cadru umbrit pentru extinderea prezentată în harta detaliată.
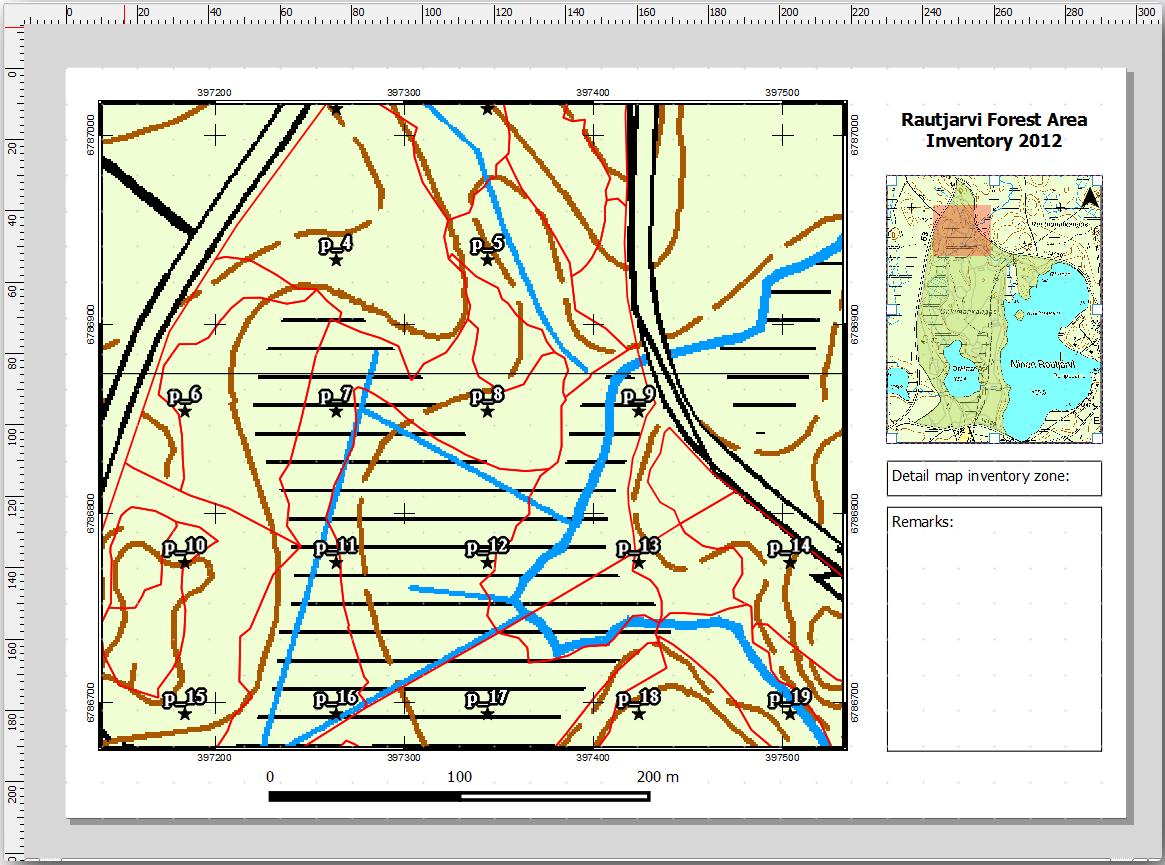
Șablonul hărții dvs. este aproape gata. Adăugați în hartă cele două casete de text de mai jos, una conținând textul «Zona detaliată a hărții:», iar cealaltă «Observații:». Plasați-le așa cum se vede în imaginea de mai sus.
Puteți adăuga, de asemenea, o săgeată a Nordului la harta generală:
Select the
 Add North Arrow tool.
Click and drag a rectangle at the upper right corner of the overview map.
In Item properties Check SVG image
Browse for an arrow image.
Under Image rotation, check the Sync with map and select Map 1 (the overview map).
Redimensionați imaginea săgeții la o dimensiune care arată bine pe hărțile mici.
The basic map layout is ready, now you want to make use of the Atlas tool to generate as many detail maps in this format as you consider necessary.
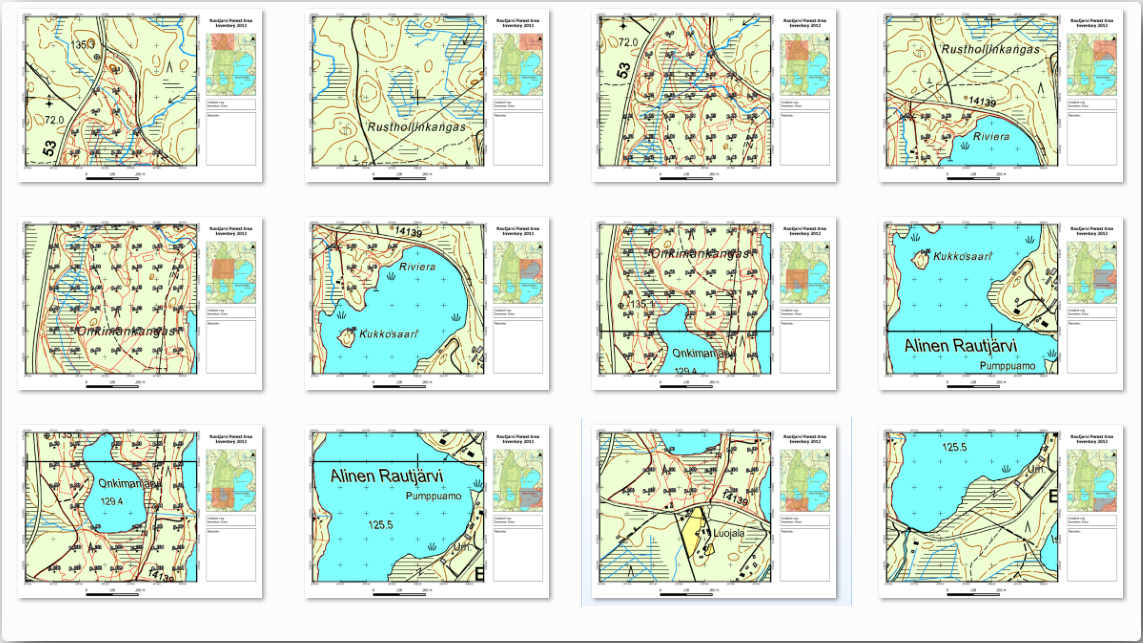
14.6.6. ★☆☆ Follow Along: Creating an Atlas Coverage
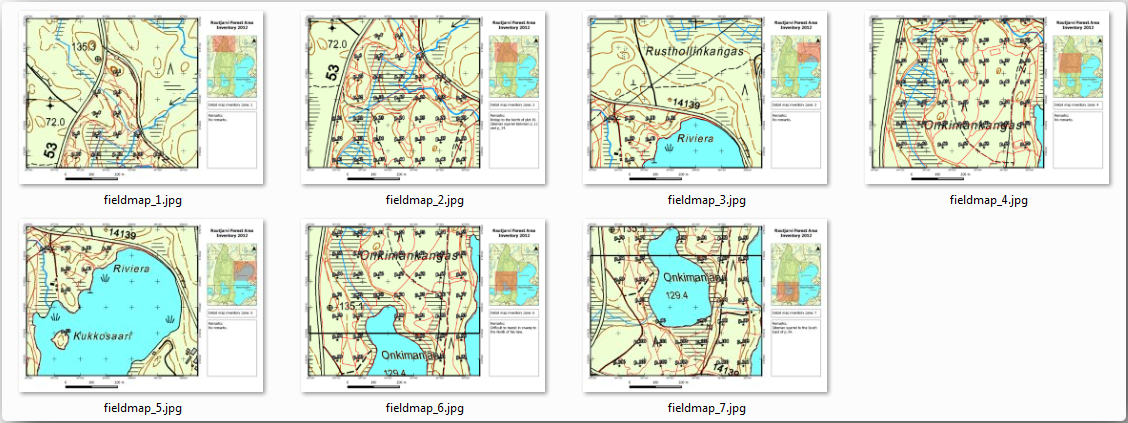
Acoperirea Atlasului reprezintă doar un strat vectorial care va fi folosit pentru a genera hărțile detaliate, o hartă pentru fiecare entitate din aria de acoperire. Pentru a vă face o idee despre aceasta, iată un set complet de hărți detaliate pentru zona de pădure:
Acoperirea poate fi orice strat existent, dar, de obicei, are mai mult sens crearea unuia în acest scop specific. Haideți să creăm o rețea de poligoane care acoperă zona de pădure:
In the QGIS map view, open
 .
.Setați instrumentul așa cum se arată în această imagine:
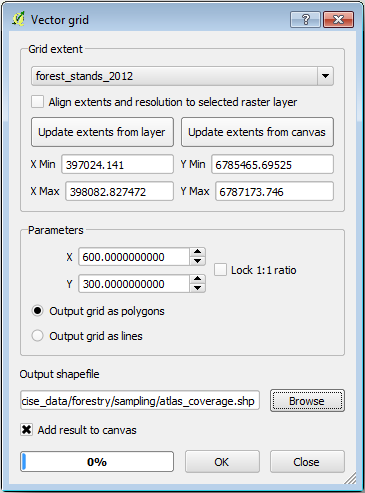
Salvați rezultatul ca
atlas_coverage.shp.Style the new
atlas_coveragelayer so that the polygons have no filling.
Noile poligoane acoperă întreaga zonă de pădure și vă conferă o idee despre ceea ce va conține fiecare hartă (creată din fiecare poligon).
14.6.7. ★☆☆ Follow Along: Setting Up the Atlas Tool
Ultimul pas este de a crea instrumentul Atlas:
Go back to the print layout.
În panoul din dreapta, mergeți la fila Atlas generation.
Setați opțiunile după cum urmează:
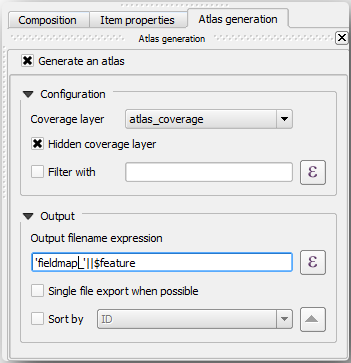
That tells the Atlas tool to use the features (polygons) inside
atlas_coverageas the focus for every detail map. It will output one map for every feature in the layer. The Hidden coverage layer tells the Atlas to not show the polygons in the output maps.
Mai trebuie să fie făcut un lucru. Trebuie să indicați Atlasului care element va fi actualizat pentru fiecare hartă de ieșire. Până acum, probabil că ați ghicit că harta care urmează a fi schimbată pentru fiecare entitate, este cea pe care ați pregătit-o să conțină vederile detaliate ale parcelelor eșantion, ea reprezentând elementul cel mai mare de pe canevas:
Select the bigger map element (
Map 0).Mergeți la fila Proprietățile itemului tab.
În listă, bifați Controlat de atlas.
And set the Margin around feature to
10%. The view extent will be 10% bigger than the polygons, which means that your detail maps will have a 10% overlap.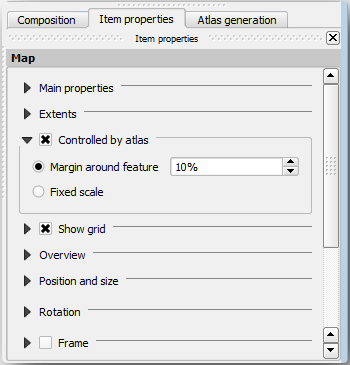
Acum puteți utiliza instrumentul de vizualizare pentru Atlas, pentru a revizui ceea ce vor arăta hărțile:
Activați previzualizarea Atlasului folosind butonul
 sau, în cazul în care bara de instrumente nu este vizibilă, via .
Puteți folosi săgețile din bara de instrumente a Atlasului, sau din meniul , pentru a vă deplasa printre hărțile care vor fi create.
Note that some of them cover areas that are not interesting. Let’s do something about it and save some trees by not printing those useless maps.
14.6.8. ★☆☆ Follow Along: Editing the Coverage Layer
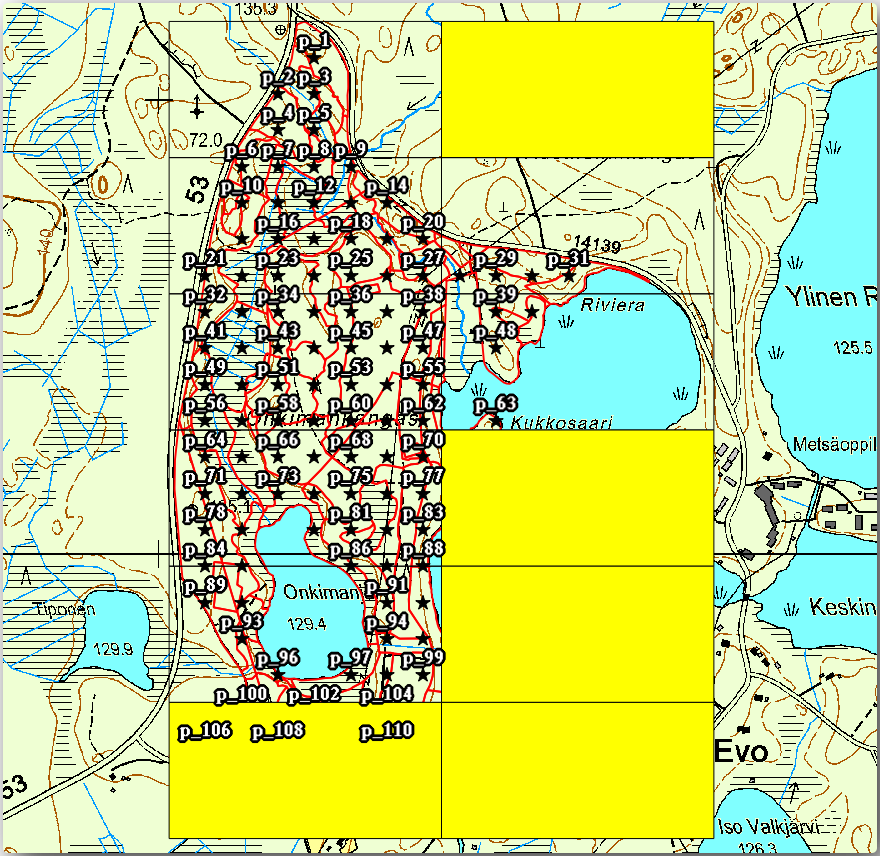
Pe lângă eliminarea poligoanelor pentru acele zone care nu sunt interesante, puteți personaliza, de asemenea, etichetele din harta dvs., prin generarea conținutului acestora din Tabela de atribute a stratului de acoperire.
Mergeți înapoi la vizualizarea hărții.
Enable editing for the
atlas_coveragelayer.Selectați poligoanele care sunt evidențiate (în galben) în imaginea de mai jos.
Eliminați poligoanele selectate.
Dezactivați editarea și salvați modificările.
You can go back to the print layout and check that the previews of the Atlas use only the polygons you left in the layer.
Stratul de acoperire pe care îl utilizați, încă nu conține informații utile, pe care să le puteți folosi la personalizarea conținutului etichetelor din hartă. Primul pas este de a le crea; în acest scop puteți adăuga, de exemplu, un cod de zonă pentru zonele poligonale, și un câmp cu câteva observații pe care să le aibă în vedere echipele din teren:
Open the Attribute table for the
atlas_coveragelayer.Activează editarea.
Folosiți calculatorul
 pentru a crea și popula următoarele două câmpuri.
Create a field named
Zoneof type Whole number (integer).In the Expression box write/copy/construct
@row_number.Create another field named
Remarks, of type Text (string) and a width of255.In the Expression box write
'No remarks.'. This will set all the default value for all the polygons.
The forest manager will have some information about the area that might be useful
when visiting the area.
For example, the existence of a bridge, a swamp or the location of a protected species.
The atlas_coverage layer is probably in edit mode still,
add the following text in the Remarks field to the corresponding polygons
(double click the cell to edit it):
For the Zone 2:
Bridge to the North of plot 19. Siberian squirrel
between p_13 and p_14.
For the Zone 6:
Difficult to transit in swamp to the North of the lake.For the Zone 7:
Siberian squirrel to the South East of p_94.Dezactivează editarea și salvează modificările.
Almost ready, now you have to tell the Atlas tool that you want some of the text
labels to use the information from the atlas_coverage layer’s attribute table.
Go back to the Print Layout.
Select the text label containing
Detailed map....Setați dimensiunea Fontului la
12.Duceți cursorul la sfârșitul textului din etichetă.
In the Item properties tab, inside the Main properties click on Insert or Edit an Expression….
In the Function list double-click on the field Zone under Field and Values.
Clic pe OK
The text inside the box in the Item properties should show
Detail map inventory zone: [% "Zone" %]. Note that the[% "Zone" %]will be substituted by the value of the fieldZonefor the corresponding feature from the layeratlas_coverage.Testați conținutul etichetei, prin vizualizarea unor diferite hărți din Atlas.
Do the same for the labels with the text
Remarks:using the field with the zone information. You can leave a break line before you enter the expression. You can see the result for the preview of zone 2 in the image below: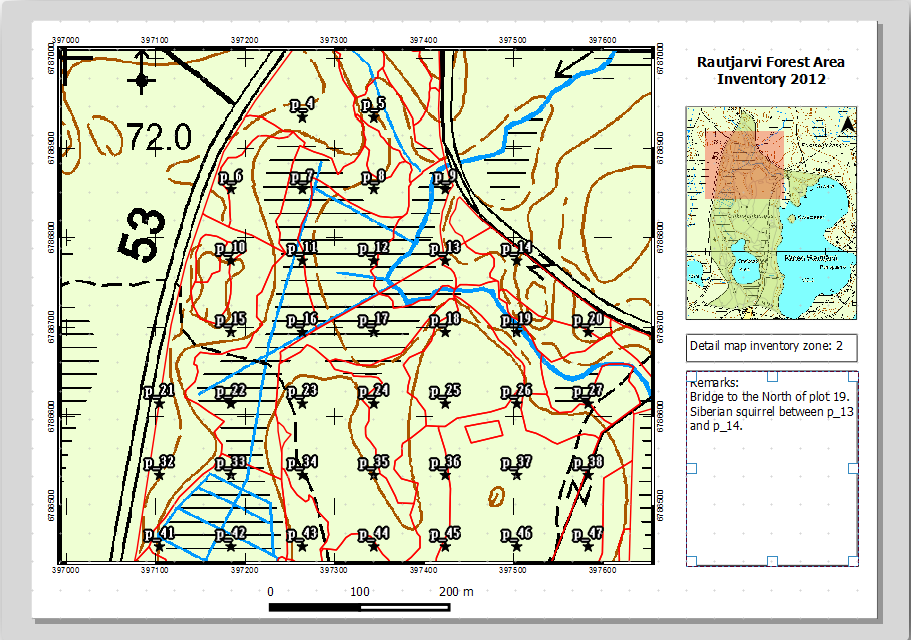
Utilizați previzualizarea din Atlas pentru a naviga prin toate hărțile care vor fi create în curând!
14.6.9. ★☆☆ Follow Along: Printing the Maps
Nu în ultimul rând, imprimați sau exportați hărțile în fișiere imagine sau PDF. Aveți posibilitatea să utilizați sau . În prezent, formatul de export SVG nu funcționează în mod corespunzător și va da un rezultat slab.
Haideți să exportăm hărțile într-un singur PDF pe care îl puteți trimite la biroul teritorial pentru imprimare:
Mergeți la fila Atlas generation, în panoul din dreapta.
Sub Output bifați Single file export when possible. Acest lucru va pune toate hărțile împreună într-un fișier PDF; în cazul în care această opțiune nu este bifată, veți obtine câte un fișier pentru fiecare hartă.
Open .
Save the PDF file as
inventory_2012_maps.pdfin yourexercise_data\forestry\samplig\map_creation\folder.Deschideți fișierul PDF pentru a verifica dacă totul a mers cum era de așteptat.
Puteți crea la fel de ușor imagini separate pentru fiecare hartă (amintiți-vă să debifați crearea unui singur fișier), unde puteți vedea miniaturile imaginilor care vor fi create:
In the Print Layout, press
 Save in order
to save your print layout changes in the project. This also saves the project file.
You can reopen the project at any time and run or edit the atlas.
Save in order
to save your print layout changes in the project. This also saves the project file.
You can reopen the project at any time and run or edit the atlas.It is also possible to save your map as a layout template as
forestry_atlas.qptin yourexercise_data\forestry\map_creation\folder. Use . You will be able to use this template again and again in other projects.Close the Print Layout and the project.
14.6.10. În concluzie
Ați reușit să creați o hartă șablon, care poate fi folosită pentru a genera automat hărți detaliate, în scopul ușurării utilizării în teren. După cum ați observat, acest lucru nu a fost o sarcină ușoară, dar beneficiul va veni atunci când va trebui să creați hărți similare pentru alte regiuni, unde puteți utiliza șablonul pe care tocmai l-ați salvat.
14.6.11. Ce urmează?
In the next lesson, you will see how you can use LiDAR data to create a DEM and then use it to enhance your data and maps visibility.