Raster analysis
Raster calculator
Performs algebraic operations using raster layers.
The resulting layer will have its values computed according to an expression. The expression can contain numerical values, operators and references to any of the layers in the current project.
Note
When using the calculator in The batch processing interface or from the
QGIS Python console the files to use have to be specified. The corresponding
layers are referred using the base name of the file (without the full
path).
For instance, if using a layer at path/to/my/rasterfile.tif, the first
band of that layer will be referred as rasterfile.tif@1.
Parameters
Label |
Name |
Type |
Description |
|---|---|---|---|
Layers |
GUI only |
Shows the list of all raster layers loaded in the legend.
These can be used to fill the expression box (double click to
add).
Raster layers are referred by their name and the number of the
band: |
|
Operators |
GUI only |
Contains some calculator like buttons that can be used to fill the expression box. |
|
Expression |
|
[string] |
Expression that will be used to calculate the output raster layer. You can use the operator buttons provided to type directly the expression in this box. |
Predefined expressions |
GUI only |
You can use the predefined |
|
Reference layer(s) (used for automated extent, cellsize, and CRS) Optional |
|
[raster] [list] |
Layer(s) that will be used to fetch extent, cell size and CRS.
By choosing the layer in this box you avoid filling in all the
other parameters by hand.
Raster layers are referred by their name and the number of
the band: |
Cell size (use 0 or empty to set it automatically) Optional |
|
[number] |
Cell size of the output raster layer. If the cell size is not specified, the minimum cell size of the selected reference layer(s) will be used. The cell size will be the same for the X and Y axes. |
Output extent (xmin, xmax, ymin, ymax) |
|
[extent] |
Extent of the output raster layer. If the extent is not specified, the minimum extent that covers all the selected reference layers will be used. |
Output CRS Optional |
|
[crs] |
CRS of the output raster layer. If the output CRS is not specified, the CRS of the first reference layer will be used. |
Output |
|
[raster] Default: |
Specification of the output raster. One of:
The file encoding can also be changed here. |
Outputs
Label |
Name |
Type |
Description |
|---|---|---|---|
Output |
|
[raster] |
Output raster file with the calculated values. |
Raster layer statistics
Calculates basic statistics from the values in a given band of the raster layer. The output is loaded in the menu.
Parameters
Label |
Name |
Type |
Description |
|---|---|---|---|
Input layer |
|
[raster] |
Input raster layer |
Band number |
|
[raster band] Default: The first band of the input layer |
If the raster is multiband, choose the band you want to get statistics for. |
Output |
|
[html] Default: |
Specification of the output file:
The file encoding can also be changed here. |
Outputs
Label |
Name |
Type |
Description |
|---|---|---|---|
Maximum value |
|
[number] |
|
Mean value |
|
[number] |
|
Minimum value |
|
[number] |
|
Output |
|
[html] |
The output file contains the following information:
|
Range |
|
[number] |
|
Standard deviation |
|
[number] |
|
Sum |
|
[number] |
|
Sum of the squares |
|
[number] |
Raster layer unique values report
Returns the count and area of each unique value in a given raster layer.
Parameters
Label |
Name |
Type |
Description |
|---|---|---|---|
Input layer |
|
[raster] |
Input raster layer |
Band number |
|
[raster band] Default: The first band of the input layer |
If the raster is multiband, choose the band you want to get statistics for. |
Unique values report |
|
[file] Default: |
Specification of the output file:
The file encoding can also be changed here. |
Unique values table |
|
[table] Default: |
Specification of the table for unique values:
The file encoding can also be changed here. |
Outputs
Label |
Name |
Type |
Description |
|---|---|---|---|
CRS authority identifier |
|
[crs] |
|
Extent |
|
[extent] |
|
Height in pixels |
|
[number] |
|
NODATA pixel count |
|
[number] |
|
Total pixel count |
|
[number] |
|
Unique values report |
|
[html] |
The output HTML file contains the following information:
|
Unique values table |
|
[table] |
A table with three columns:
|
Width in pixels |
|
[number] |
Reclassify by layer
Reclassifies a raster band by assigning new class values based on the ranges specified in a vector table.
Parameters
Label |
Name |
Type |
Description |
|---|---|---|---|
Raster layer |
|
[raster] |
Raster layer to reclassify |
Band number |
|
[raster band] Default: The first band of the raster layer |
If the raster is multiband, choose the band you want to reclassify. |
Layer containing class breaks |
|
[vector: any] |
Vector layer containing the values to use for classification. |
Minimum class value field |
|
[tablefield: numeric] |
Field with the minimum value of the range for the class. |
Maximum class value field |
|
[tablefield: numeric] |
Field with the maximum value of the range for the class. |
Output value field |
|
[tablefield: numeric] |
Field with the value that will be assigned to the pixels that fall in the class (between the corresponding min and max values). |
Output no data value |
|
[number] Default: -9999.0 |
Value to apply to no data values. |
Range boundaries |
|
[enumeration] Default: 0 |
Defines comparison rules for the classification. Options:
|
Use no data when no range matches value |
|
[boolean] Default: False |
Values that do not belong to a class will result in the no data value. If False, the original value is kept. |
Output data type |
|
[enumeration] Default: 5 |
Defines the data type of the output raster file. Options:
|
Reclassified raster |
|
[raster] |
Specification of the output raster. One of:
The file encoding can also be changed here. |
Outputs
Label |
Name |
Type |
Description |
|---|---|---|---|
Reclassified raster |
|
[raster] |
Output raster layer with reclassified band values |
Reclassify by table
Reclassifies a raster band by assigning new class values based on the ranges specified in a fixed table.
Parameters
Label |
Name |
Type |
Description |
|---|---|---|---|
Raster layer |
|
[raster] |
Raster layer to reclassify |
Band number |
|
[raster band] Default: The first band of the raster layer |
If the raster is multiband, choose the band you want to reclassify. |
Reclassification table |
|
[matrix] |
A 3-columns table (formatted as a list of nine numbers)
containing the values to use for class boundaries ( |
Output no data value |
|
[number] Default: -9999.0 |
Value to use for nodata in the output |
Range boundaries |
|
[enumeration] Default: 0 |
Defines comparison rules for the classification. Options:
|
Use no data when no range matches value |
|
[boolean] Default: False |
Values that do not belong to a class will result in the no data value. If False, the original value is kept. |
Output data type |
|
[enumeration] Default: 5 |
Defines the data type of the output raster file. Options:
|
Reclassified raster |
|
[raster] |
Specification of the output raster. One of:
The file encoding can also be changed here. |
Outputs
Label |
Name |
Type |
Description |
|---|---|---|---|
Reclassified raster |
|
[raster] |
Output raster layer with reclassified band values |
Sample raster values
Extracts raster values at the point locations. If the raster layer is multiband, each band is sampled.
The attribute table of the resulting layer will have as many new columns as there are bands in the raster layer.
Parameters
Label |
Name |
Type |
Description |
|---|---|---|---|
Input Point Layer |
|
[vector: point] |
Point vector layer in input to use for the sampling. |
Raster Layer to sample |
|
[raster] |
Raster layer to sample at input point layer locations. |
Output column prefix |
|
[string] Default: ‘rvalue’ |
Prefix for the column(s) name. |
Sampled Points |
|
[vector: point] Default: |
Specify the output point vector layer for the sampled raster values. One of:
The file encoding can also be changed here. |
Outputs
Label |
Name |
Type |
Description |
|---|---|---|---|
Sampled Points |
|
[vector: point] |
Output point vector layer with additional column(s) containing the sampled raster values. |
Zonal histogram
Appends fields representing counts of each unique value from a raster layer contained within zones defined as polygons.
The output layer attribute table will have as many fields as the unique values of the raster layer that intersects the polygon(s).
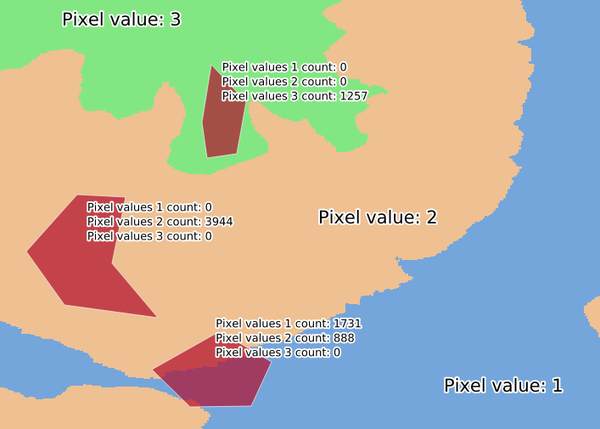
Raster layer histogram example
Parameters
Label |
Name |
Type |
Description |
|---|---|---|---|
Raster layer |
|
[raster] |
Input raster layer |
Band number |
|
[raster band] Default: The first band raster layer to sample |
If the raster is multiband, choose the band to use for the zonal histogram. |
Vector layer containing the zones |
|
[vector: polygon] |
Polygon vector layer that defines the zones. |
Output column prefix Optional |
|
[string] Default: ‘HISTO_’ |
Prefix for output column name(s). |
Output zones |
|
[vector: polygon] Default: |
Specify the output polygon vector layer with count of raster values. One of:
The file encoding can also be changed here. |
Outputs
Label |
Name |
Type |
Description |
|---|---|---|---|
Output zones |
|
[vector: polygon] |
Output polygon vector layer with count of raster values. |
Zonal statistics
Calculates statistics of a raster layer for each feature of an overlapping polygon vector layer.
Warning
No new output file will be created. The algorithm adds new columns to the input vector layer.
Parameters
Label |
Name |
Type |
Description |
|---|---|---|---|
Raster Layer |
|
[raster] |
Input raster layer |
Band number |
|
[raster band] Default: The first band of the raster layer |
If the raster is multiband, choose the band to use for the zonal histogram. |
Vector layer containing the zones |
|
[vector: polygon] |
Pologyn vector layer that defines the zones (and that will be updated with new statistics columns). |
Output column prefix Optional |
|
[string] Default: ‘_’ |
Prefix for the output column name(s). |
Statistics to calculate |
|
[enumeration] [list] Default: [0 1 2] |
List of statistical operators for the output. The available operators are:
|
Outputs
Label |
Name |
Type |
Description |
|---|---|---|---|
Vector layer containing the zones |
|
[vector: polygon] |
The input polygon vector layer with new fields added for the zone statistics. |