중요
번역은 여러분이 참여할 수 있는 커뮤니티 활동입니다. 이 페이지는 현재 100.00% 번역되었습니다.
17.9. 공간 처리 로그
참고
이 수업에서는 공간 처리 로그에 대해 설명합니다.
공간 처리 프레임워크를 통해 수행되는 모든 분석은 QGIS 로그 작업 시스템에 로그로 기록됩니다. 이렇게 하면 공간 처리 도구들을 통해 어떤 일들이 일어났는지를 더 자세히 알 수 있고, 문제가 발생하는 경우 해결할 수 있으며, 또 이전 작업을 재실행할 수 있습니다. 로그 작업 시스템도 쌍방향 작업성을 일부 구현하고 있기 때문입니다.
로그를 열려면, QGIS 상태 바에서 오른쪽 최하단에 있는 풍선 아이콘을 클릭하십시오. 일부 알고리즘은 여기에 실행 관련 정보를 남길 수도 있습니다. 예를 들어 외부 응용 프로그램을 호출하는 알고리즘들은 보통 이 항목에 해당 응용 프로그램의 콘솔 산출물을 로그로 기록합니다. 이 로그를 살펴보면, 방금 실행했던 (그리고 입력 데이터가 정확하지 않아서 실행에 실패한) SAGA 알고리즘의 산출물이 여기에 저장된 것을 볼 수 있을 것입니다.
이 로그는 작업이 어떻게 진행되고 있는지 이해하는 데 큰 도움이 됩니다. 고급 사용자는 이 산출물을 분석해서 어째서 알고리듬이 실패했는지 알아낼 수 있을 것입니다. 고급 사용자가 아닐 경우, 다른 이들이 이 산출물을 가지고 어떤 문제인지, 외부 응용 프로그램의 설치에 문제가 있는지 또는 사용자가 제공한 데이터에 문제가 있는지 진단해줄 수 있을 것입니다.
알고리즘을 실행할 수 있다고 하더라도, 결과물이 올바르지 않을 수도 있는 경우 일부 알고리즘은 경고 메시지를 남길 수도 있습니다. 예를 들어 보간 알고리즘을 아주 적은 개수의 포인트들로 실행하는 경우, 이 알고리즘이 실행도 되고 결과물도 생성할 테지만 이 결과물은 올바르지 않을 가능성이 큽니다. 더 많은 포인트를 사용했어야 하기 때문입니다. 여러분이 어떤 알고리즘의 어떤 면을 잘 모르고 있다면, 이런 유형의 경고 메시지를 정기적으로 확인해보는 편이 좋습니다.
메뉴에서, GUI로부터 실행되었는지 또는 콘솔로부터 실행되었는지에 상관없이 실행된 알고리즘 들을 찾을 수 있습니다. (콘솔에 대해서는 이 지침서의 다른 부분에서 설명할 것입니다.) 실행 자체는 이 대화창에 콘솔 호출로써 저장되어 있습니다. 즉 여러분이 알고리즘을 실행할 때마다 콘솔 명령어가 이 대화창에 추가되어 여러분의 작업 세션의 전체 이력을 볼 수 있다는 뜻입니다. 이 이력은 다음처럼 보일 겁니다:
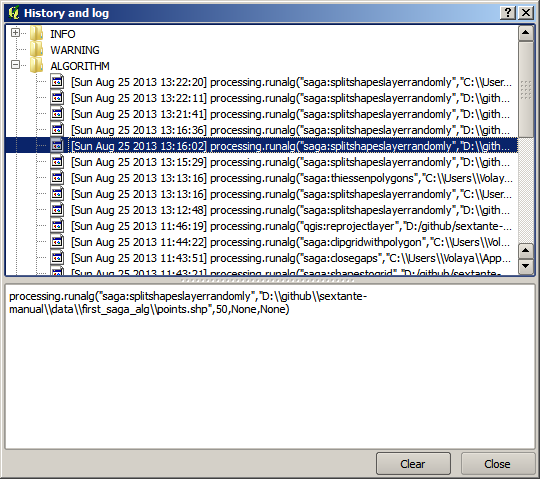
이 로그는 콘솔 작업을 시작할 때 알고리즘의 문법을 배우는 데 굉장히 유용합니다. 콘솔에서 어떻게 분석 명령어를 실행하는지 설명할 때 이 로그를 이용할 것입니다.
17.9.1. ★☆☆ 따라해보세요
이 이력은 쌍방향 작업성도 가지고 있기 때문에, 이전에 실행했던 알고리즘이라면 어떤 것이든 더블클릭해서 재실행할 수 있습니다. 이를 통해 이전에 이미 했던 작업을 손쉽게 복제할 수 있습니다.
예를 들어 다음 작업을 해보세요:
QGIS 공간 처리 지침서 강의의 첫 장에 해당하는 데이타를 열고 첫 장에서 설명한 알고리즘을 실행하십시오.
이제 이력 대화창으로 가서 목록에 있는 마지막 알고리즘을 찾아보십시오. 여러분이 방금 실행했던 알고리즘일 것입니다.
해당 알고리즘을 더블클릭하면, 여러분이 일반적인 대화창을 통해 툴박스에서 알고리즘을 호출해 실행했던 것과 똑같이 새 결과물을 생성할 것입니다.
17.9.2. ★★☆ 따라해보세요
알고리즘도 수정할 수 있습니다.
알고리즘 호출을 복사하십시오.
을 여십시오.
복사한 내용을 붙여넣고 분석을 실행하십시오. 이때 파라미터를 마음대로 바꿔보세요.
생성된 파일을 화면에서 보고 싶다면, 붙여넣은 명령어에서
processing.run을processing.runAndLoadResults로 대체하면 됩니다.