18.9. 공간처리 로그
주석
이 강의에서 공간처리 로그에 대해 설명합니다.
All the analysis performed with the processing framework is logged in QGIS logging system. This allows you to know more about what has been done with the processing tools, to solve problems when they happen, and also to re–run previous operations, since the logging system also implements some interactivity.
To open the log, click on the balloon at the bottom right, on the QGIS status bar. Some algorithms might leave here information about their execution. For instance, those algorithms that call an external application usually log the console output of that application to this entry. If you have a look at it, you will see that the output of the SAGA algorithm that we just run (and that fail to execute because input data was not correct) is stored here.
작업이 어떻게 진행되고 있는지 이해하는 데 큰 도움이 됩니다. 고급 사용자는 이 산출물을 분석해서 어째서 알고리듬이 실패했는지 알아낼 수 있을 것입니다. 고급 사용자가 아닐 경우, 다른 이들이 이 산출물을 가지고 어떤 문제인지, 외부 응용 프로그램의 설치에 문제가 있는지 또는 사용자가 제공한 데이터에 문제가 있는지 진단해줄 수 있을 것입니다.
Even if the algorithm could be executed, some algorithms might leave warnings in case the result might not be right. For instance, when executing an interpolation algorithm with a very small amount of points, the algorithm can run and will produce a result, but it is likely that it will not be correct, since more points should be used. It’s a good idea to regularly check for this type of warnings if you are not sure about some aspect of a given algorithm.
From the Processing menu, under the History section, you’ll find Algorithms. All algorithms that are executed, even if they are executed from the GUI and not from the console (which will be explained later in this manual) are stored in this section as a console call. That means that everytime you run an algorithm, a console command is added to the log, and you have the full history of your working session. Here is how that history looks like:
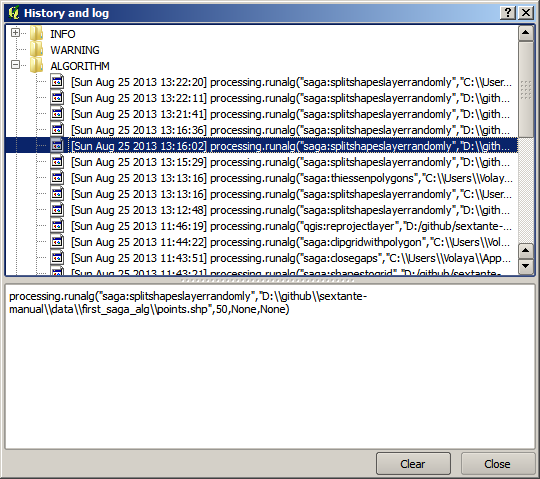
이 로그는 콘솔 작업을 시작할 때, 알고리듬의 문법을 배우는 데 굉장히 유용합니다. 콘솔에서 어떻게 분석 명령어를 실행하는지 설명할 때 이 로그를 이용할 것입니다.
이 이력은 쌍방향성도 가지고 있기 때문에, 이전에 실행했던 알고리듬이라면 어떤 것이든 더블클릭해서 재실행할 수 있습니다. 이를 통해 이전에 이미 했던 작업을 손쉽게 복제할 수 있습니다.
예를 들면 다음을 실행해보십시오. 이 지침서의 첫 번째 강의에 해당하는 데이터를 열어 그 강의에서 설명하는 알고리듬을 실행하십시오. 이제 로그 대화 창을 열고 목록에서 여러분이 방금 실행했던 알고리듬에 해당하는 마지막 알고리듬을 찾아보십시오. 그 알고리듬을 더블클릭하면, 그냥 대화 창을 이용해 툴박스에서 호출해서 실행했을 때와 동일한, 새로운 결과물을 생산할 것입니다.
18.9.1.  고급
고급
You can also modify the algorithm. Just copy it, open the Plugins ‣ Python console, click on Import class ‣ Import Processing class, then paste it to re-run the analysis; change the text at will. To display the resulting file, type iface.addVectorLayer('/path/filename.shp', 'Layer name in legend', 'ogr'). Otherwise, you can use processing.runandload.