2. Memperkenalkan SIG
|
Tujuan: |
Memahami apa itu SIG dan apa saja yang bisa digunakan dengan SIG. |
Kata kunci: |
SIG, Komputer, Peta, Data, Sistem Informasi, Spasial, Analisis |

2.1. Ikhtisar
Sama seperti kita menggunakan istilah pemrosesan kata untuk menulis dokumen dan berkaitan dengan kata pada komputer, kita dapat menggunakan Aplikasi SIG sebagai istilah yang berkaitan dengan informasi spasial pada komputer. SIG memiliki kepanjangan Sistem Informasi Geografis.
SIG terdiri atas:
Berkas Digital –-- informasi geografi yang akan kamu lihat dan analisa menggunakan perangkat keras dan lunak komputer.
Perangkat Keras –-- komputer digunakan untuk menyimpan data, memroses dan memvisualisasi data.
Perangkat Lunak –-- program komputer yang berjalan diatas perangkat keras komputer untuk memroses data digital. Program perangkat lunak yang menghasilkan SIG dinamakan aplikasi SIG.
Dengan sebuah aplikasi SIG anda dapat membuka peta digital pada komputer, membuat informasi spasial baru yang dimasukkan ke dalam sebuah peta, membuat peta cetak yang diubah berdasarkan kebutuhan anda sendiri dan melakukan analisis spasial.
Mari kita lihat contoh kecil bagaimana SIG dapat bermanfaat. Bayangkan bahwa kamu adalah seorang petugas kesehatan dan membuat catatan tentang lokasi tempat tinggal dan tanggal setiap pasien yang kamu rawat.
Bujur |
Lintang |
Penyakit |
Tanggal |
|---|---|---|---|
26.870436 |
-31.909519 |
Gondongan |
13/12/2008 |
26.868682 |
-31.909259 |
Gondongan |
24/12/2008 |
26.867707 |
-31.910494 |
Gondongan |
22/01/2009 |
26.854908 |
-31.920759 |
Campak |
11/01/2009 |
26,855817 |
-31,921929 |
Campak |
26/01/2009 |
26,852764 |
-31,921929 |
Campak |
10/02/2009 |
26,854778 |
-31,925112 |
Campak |
22/02/2009 |
26,869072 |
-31,911988 |
Gondongan |
02/02/2009 |
26,863354 |
-31,916406 |
Cacar Air |
26/02/2009 |
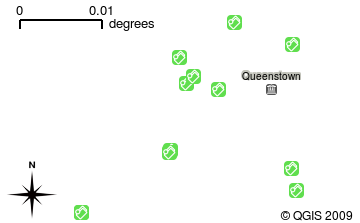
Kalau kamu perhatikan tabel di atas, sepintas kamu akan lihat terdapat banyak kasus campak di Januari dan Februari. Petugas kesehatan kita merekam lokasi tiap rumah pasien dengan mencatat bujur dan lintang didalam tabel. Memanfaatkan data tersebut di aplikasi SIG, kita dengan cepat dapat memahami lebih jauh tentang pola penyakit tersebut.
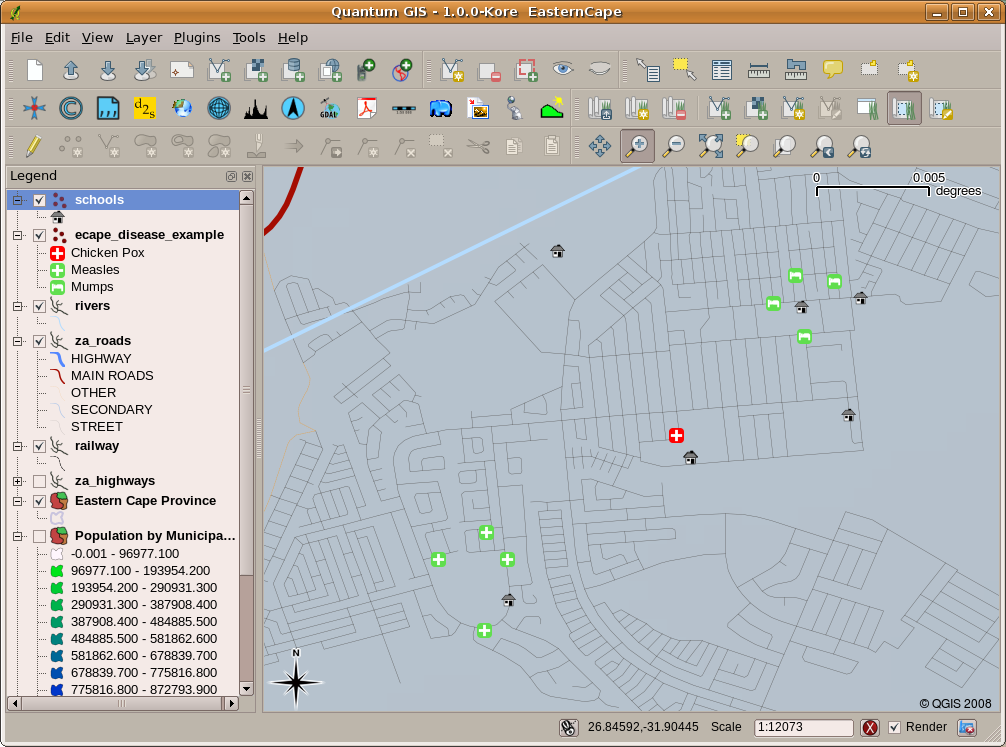
Gambar. 2.5 Contoh berikut menunjukkan rekaman penyakit dengan aplikasi SIG. Menjadi lebih mudah untuk melihat penderita penyakit gondongan tinggal di lokasi yang saling berdekatan.
2.2. Lebih lanjut tentang SIG
SIG masih bidang yang relatif baru --- dimulai di tahun 1970. Sebelumnya, komputerisasi SIG hanya tersedia di universitas dan perusahaan yang memiiki perangkat komputer mahal. Saat ini, siapa saja dengan menggunakan komputer pribadi atau laptop dapat menggunakan perangkat lunak SIG. Seiring dengan waktu aplikasi SIG makin mudah digunakan --- Sebelumnya perlu pelatihan aplikasi SIG, namun sekarang jauh lebih mudah untuk memulai SIG bagi pemula dan pengguna biasa. Melalui penjelasan di atas, SIG bukan hanya perangkat lunak, tapi merujuk pada seluruh aspek penggunaan dan pengaturan data geografi digital. Tutorial berikut kita akan fokus pada perangkat lunak SIG.
2.3. Apa itu Perangkat Lunak SIG / sebuah aplikasi SIG?
You can see an example of what a GIS Application looks like Gambar. 2.5. GIS Applications are normally programs with a graphical user interface that can be manipulated using the mouse and keyboard. The application provides menus near to the top of the window (File, Edit etc.) which, when clicked using the mouse, show a panel of actions. These actions provide a way for you to tell the GIS Application what you want to do. For example you may use the menus to tell the GIS Application to add a new layer to the display output.
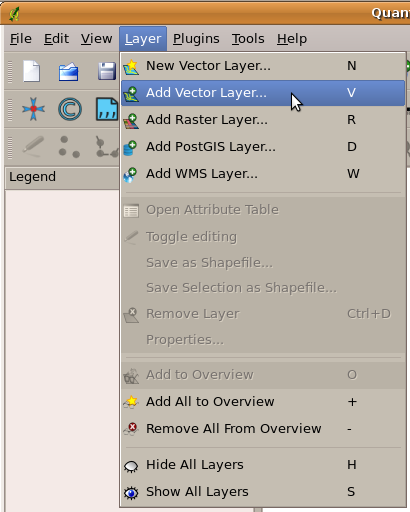
Gambar. 2.6 Menu aplikasi, ketika tetikus di klik, perluas untuk menampilkan daftar tindakan yang dapat dilakukan.
Toolbars (rows of small pictures that can be clicked with the mouse) normally sit just below the menus and provide a quicker way to use frequently needed actions.
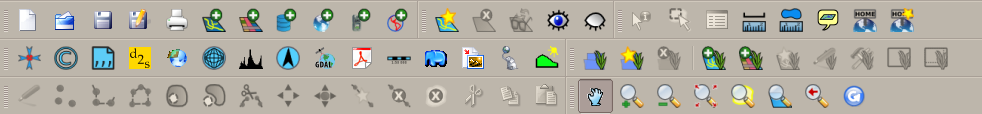
Gambar. 2.7 Toolbars provide quick access to commonly used functions. Holding your mouse over a picture will usually tell you what will happen when you click on it.
A common function of GIS Applications is to display map layers. Map layers are stored as files on a disk or as records in a database. Normally each map layer will represent something in the real world –-- a roads layer for example will have data about the street network.
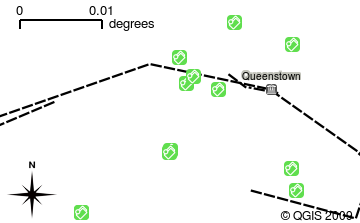
When you open a layer in the GIS Application it will appear in the map view. The map view shows a graphic representing your layer. When you add more than one layer to a map view, the layers are overlaid on top of each other. Look at figures Gambar. 2.8, Gambar. 2.9, Gambar. 2.10 and Gambar. 2.11 to see a map view that has several layers being added to it. An important function of the map view is to allow you to zoom in to magnify, zoom out to see a greater area and move around (panning) in the map.
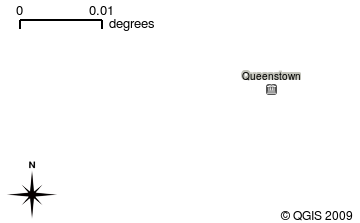
Gambar. 2.8 Sebuah tampilan peta dengan beberapa tema lapisan sedang ditambahkan. Lapisan kota ditambahkan ke tampilan peta.
Gambar. 2.9 A map view with several layers being added to it. A schools layer added to the map view
Gambar. 2.10 A map view with several layers being added to it. A railways layer added to the map view
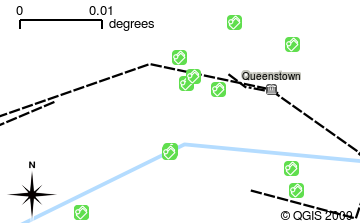
Gambar. 2.11 A map view with several layers being added to it. A rivers layer added to the map view
Another common feature of GIS Applications is the map legend. The map legend provides a list of layers that have been loaded in the GIS Application. Unlike a paper map legend, the map legend or 'layers list' in the GIS Application provides a way to re-order, hide, show and group layers. Changing the layer order is done by clicking on a layer in the legend, holding the mouse button down and then dragging the layer to a new position. In figures Gambar. 2.13 and Gambar. 2.14 the map legend is shown as the area to the left of the GIS Application window. By changing the layer order, the way that layers are drawn can be adjusted –-- in this case so that rivers are drawn below the roads instead of over them.
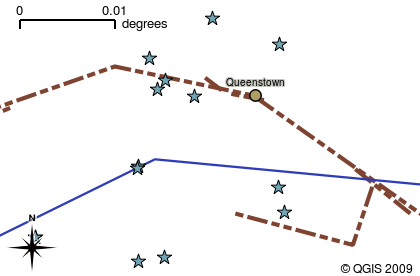
Gambar. 2.12 Perangkat lunak GIS memudahkan anda untuk mengubah simbol --- sebuah cara informasi ditampilkan
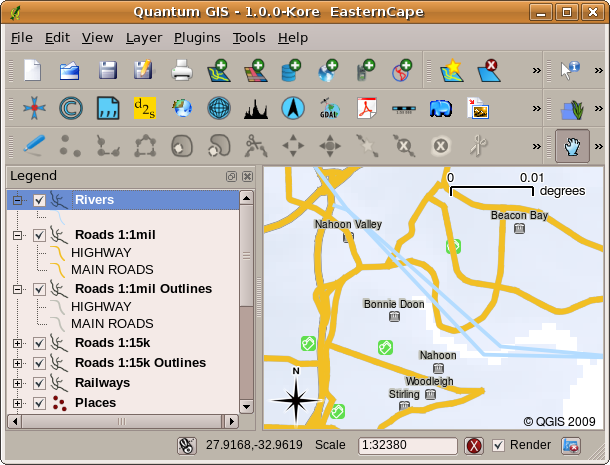
Gambar. 2.13 Changing the layer order allows to adjust the way that layers are drawn. Before changing the layer order, rivers are drawn on top of roads
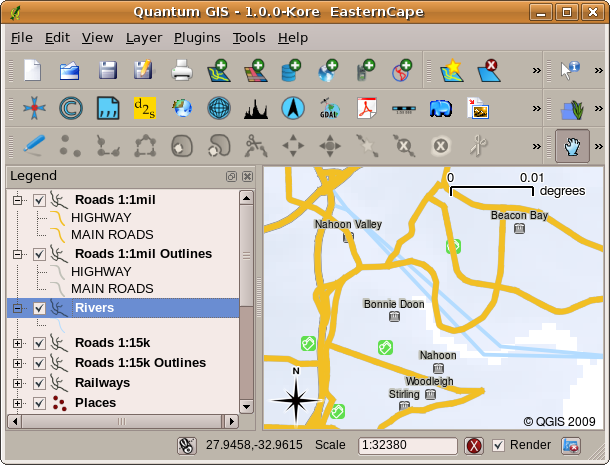
Gambar. 2.14 Changing the layer order allows to adjust the way that layers are drawn. After changing the layer order, rivers are drawn underneath roads
2.4. Mendapatkan sebuah Aplikasi GIS untuk komputer milik anda
There are many different GIS Applications available. Some have many sophisticated features and cost tens of thousands of Rands for each copy. In other cases, you can obtain a GIS Application for free. Deciding which GIS Application to use is a question of how much money you can afford and personal preference. For these tutorials, we will be using the QGIS Application. QGIS is completely free and you can copy it and share it with your friends as much as you like. If you received this tutorial in printed form, you should have received a copy of QGIS with it. If not, you can always visit https://www.qgis.org/ to download your free copy if you have access to the internet.
2.5. Data GIS
Sekarang setelah kita telah memahami GIS dan apa yang dapat dilakukan oleh sebuah aplikasi GIS, mari berdiskusi tentang Data GIS. Data adalah istilah lain untuk informasi. Informasi yang digunakan dalam GIS biasanya memiliki aspek geografis. Melihat contoh diatas, tentang pekerja perawatan kesehatan. Dia telah membuat sebuah tabel yang berisi tentang catatan penyakit seperti berikut ini:
Bujur |
Lintang |
Penyakit |
Tanggal |
|---|---|---|---|
26.870436 |
-31.909519 |
Gondongan |
13/12/2008 |
Kolom bujur dan lintang menyimpan data geografis. Kolom penyakit dan tanggal menyimpan data non-geografis.
A common feature of GIS is that they allow you to associate information (non-geographical data) with places (geographical data). In fact, the GIS Application can store many pieces of information which are associated with each place --– something that paper maps are not very good at. For example, our health care worker could store the person's age and gender on her table. When the GIS Application draws the layer, you can tell it to draw the layer based on gender, or based on disease type, and so on. So, with a GIS Application we have a way to easily change the appearance of the maps we created based on the non-geographical data associated with places.
GIS Systems work with many different types of data. Vector data is stored as
a series of X, Y coordinate pairs inside the computer's memory. Vector data
is used to represent points, lines and areas. Illustration Gambar. 2.15
shows different types of vector data being viewed in a GIS application. In the
tutorials that follow we will be exploring vector data in more detail.
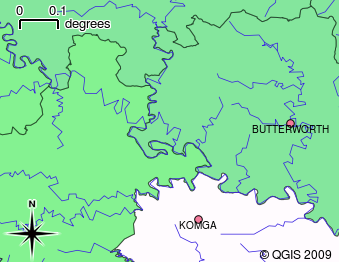
Gambar. 2.15 Vector data is used to represent points (e.g. towns), lines (e.g. rivers) and polygons (e.g. municipal boundaries).
Raster data are stored as a grid of values. There are many satellites circling the earth and the photographs they take are a kind of raster data that can be viewed in a GIS. One important difference between raster and vector data is that if you zoom in too much on a raster image, it will start to appear 'blocky' (see illustrations Gambar. 2.16 and Gambar. 2.17). In fact these blocks are the individual cells of the data grid that makes up the raster image. We will be looking at raster data in greater detail in later tutorials.
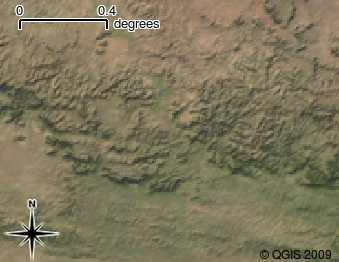
Gambar. 2.16 Raster data are often images taken by satellites. Here we can see mountains in the Eastern Cape.
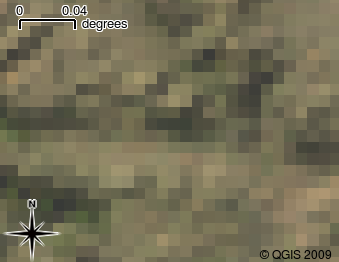
Gambar. 2.17 The same raster data, but this time zoomed in. The grid nature of the data can be seen.
2.6. What have we learned?
Let's wrap up what we covered in this worksheet:
A GIS is a system of computer hardware, computer software and geographical data.
A GIS Application allows you to view geographical data and is an important part of the GIS.
A GIS Application normally consists of a menu bar, toolbars, a map view and a legend.
Vector and raster data are geographical data used in a GIS application.
Geographical data can have associated non-geographical data.
2.7. Now you try!
Here are some ideas for you to try with your learners:
Geography: Describe the concept of GIS to your learners as outlined in this tutorial. Ask them to try to think of 3 reasons why it might be handy to use a GIS instead of paper maps. Here are some that we could think of:
GIS Applications allow you to create many different types of maps from the same data.
GIS is a great visualisation tool that can show you things about your data and how they are related in space (e.g. those disease outbreaks we saw earlier).
Paper maps need to be filed and are time consuming to view. The GIS can hold a very large amount of map data and make it quick and easy to find a place you are interested in.
Geography: Can you and your learners think of how raster data from satellites could be useful? Here are some ideas we had:
During natural disasters, raster data can be useful to show where the impacted areas are. For example a recent satellite image taken during a flood can help to show where people may need rescuing.
Sometimes people do bad things to the the environment, like dumping dangerous chemicals that kill plants and animals. Using raster data from satellites can help us to monitor for these type of problems.
Town planners can use raster data from satellites to see where informal settlements are and to help in planning infrastructure.
2.8. Something to think about
If you don't have a computer available, many of the topics we cover in this tutorial can be reproduced using an overhead and transparency as it uses the same technique of layering information. However, to properly understand GIS it is always better to learn it using a computer.
2.9. Further reading
Book: Desktop GIS: Mapping the Planet with Open Source Tools. Author: Gary Sherman. ISBN: 9781934356067
The QGIS User Guide also has more detailed information on working with QGIS.
2.10. What's next?
In the sections that follow we are going to go into more detail, showing you how to use a GIS Application. All of the tutorials will be done using QGIS. Next up, let's look at vectors!