5. QGIS Configuration
QGIS is highly configurable. Through the menu, it provides different tools to:
 Style Manager…: create and manage symbols,
styles and color ramps.
Style Manager…: create and manage symbols,
styles and color ramps. Custom Projections…: create your own
coordinate reference systems.
Custom Projections…: create your own
coordinate reference systems. Keyboard Shortcuts…: define your own set of
keyboard shortcuts.
Also, they can be overridden during each QGIS session by the project
properties (accessible under menu).
Keyboard Shortcuts…: define your own set of
keyboard shortcuts.
Also, they can be overridden during each QGIS session by the project
properties (accessible under menu). Interface Customization…: configure the
application interface, hiding dialogs or tools you may
not need.
Interface Customization…: configure the
application interface, hiding dialogs or tools you may
not need. Options…: set global options to
apply in different areas of the software. These preferences are saved in the
active User profile settings and applied by default
whenever you open a new project with this profile.
Options…: set global options to
apply in different areas of the software. These preferences are saved in the
active User profile settings and applied by default
whenever you open a new project with this profile.
5.1. Options
Some basic options for QGIS can be selected using the
Options dialog. Select the menu option
.
You can modify the options according to your needs. Some of the changes may
require a restart of QGIS before they will be effective.
The tabs where you can customize your options are described below.
Note
Plugins can embed their settings within the Options dialog
While only Core settings are presented below, note that this list can be extended by installed plugins implementing their own options into the standard Options dialog. This avoids each plugin having their own config dialog with extra menu items just for them…
5.1.1. General Settings
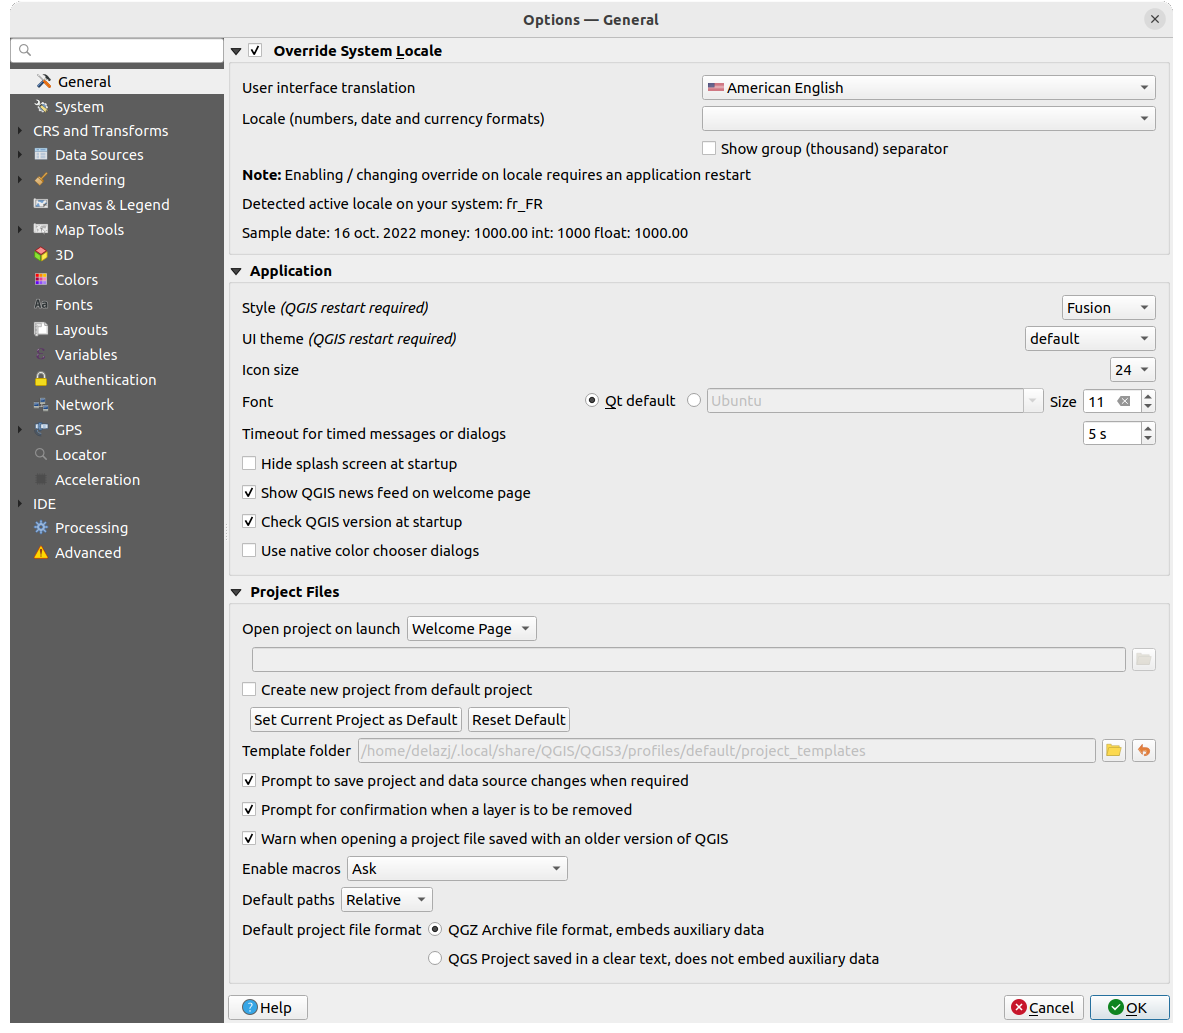
Fig. 5.1 General Settings
Override System Locale
By default, QGIS relies on your Operating System configuration to set language and manipulate numerical values. Enabling this group allows you to customize the behavior.
Select from User interface translation the language to apply to the GUI
Select in Locale (number, date and currency formats) the system on which date and numeric values should be input and rendered
 Show group (thousand) separator
A summary of the selected settings and how they would be interpreted is displayed at the bottom of the frame.
Application
Select the Style (QGIS restart required) ie, the widgets look and placement in dialogs. Possible values depend on your Operating System.
Define the UI theme (QGIS restart required)
 .
It can be ‘default’, ‘Night Mapping’, or ‘Blend of Gray’
.
It can be ‘default’, ‘Night Mapping’, or ‘Blend of Gray’Define the Icon size
Define the Font and its Size. The font can be
 Qt default or a user-defined one
Change the Timeout for timed messages or dialogs
 Hide splash screen at startup
- Show QGIS news feed on welcome page: displays a curated
QGIS news feed on the welcome page, giving you a direct way to be aware of
project news (user/developer meetings date and summary, community surveys,
releases announcements, various tips…)
- Check QGIS version at startup to keep you informed
if a newer version is released
- Use native color chooser dialogs
(see Color Selector)
Project files
Open project on launch
‘Welcome Page’ (default): can display the “News” feed, the project template(s) and the most recent projects (with thumbnails) of the user profile. No project is opened by default.
‘New’: opens a new project, based on the default template
‘Most recent’: reopens the last saved project
and ‘Specific’: opens a particular project. Use the … button to define the project to use by default.
- Create new project from default project. You have the
possibility to press on Set current project as default or on
Reset default. You can browse through your files and define a
directory where you find your user-defined project templates. This will be
added to . If you first activate
Create new project from default project and then save
a project in the project templates folder.
- Prompt to save project and data source changes when
required to avoid losing changes you made.
- Prompt for confirmation when a layer is to be removed
- Warn when opening a project file saved with an older
version of QGIS. You can always open projects created with older version of
QGIS but once the project is saved, trying to open with older release may fail
because of features not available in that version.
Enable project’s embedded Python code
. This option
handles execution of macros that are written to perform an action on project
events, as well as custom Python functions to be used as expressions. You can
choose between ‘Never’, ‘Ask’, ‘For this session only’ and
‘Always (not recommended)’.Default paths: defines whether paths to files and layers used in new projects are stored as ‘Absolute’ or ‘Relative’ to the project file. This setting can be overwritten at the project level.
Default project file format
- QGZ Archive file format, embeds auxiliary data
(see auxiliary data)
 QGS Project saved in a clear text, does not
embed auxiliary data: the auxiliary data is stored in a separate
QGS Project saved in a clear text, does not
embed auxiliary data: the auxiliary data is stored in a separate .qgdfile along with the project file.
5.1.2. System Settings
SVG paths
Add or Remove Path(s) to search for Scalable Vector Graphic (SVG) symbols. These SVG files are then available to symbolize or label the features or decorate your map composition.
Also read Remote or embedded file selector for different ways to refer to svg files in a QGIS path.
Plugin paths
Add or Remove Path(s) to search for additional C++ plugin libraries.
Documentation paths
Add or Remove Documentation Path(s) to use for QGIS help. By default,
a link to the official online User Manual corresponding to the version being used
is added (i.e., https://docs.qgis.org/§qgis_short_version/$qgis_locale/docs/user_manual/).
You can however add other links and prioritize them from top to bottom:
each time you click on a Help button in a dialog, the topmost link
is checked and if no corresponding page is found, the next one is tried,
and so on.
Note
Documentation is versioned and translated only for QGIS Long Term Releases (LTR), meaning that if you are running a regular release (eg, QGIS 3.0), the help button will by default open the next LTR manual page (ie. 3.4 LTR), which may contain description of features in newer releases (3.2 and 3.4). If no LTR documentation is available then the testing doc, with features from newer and development versions, is used.
Settings
It helps you Reset user interface to default settings (restart required) if you made any customization.
Environment
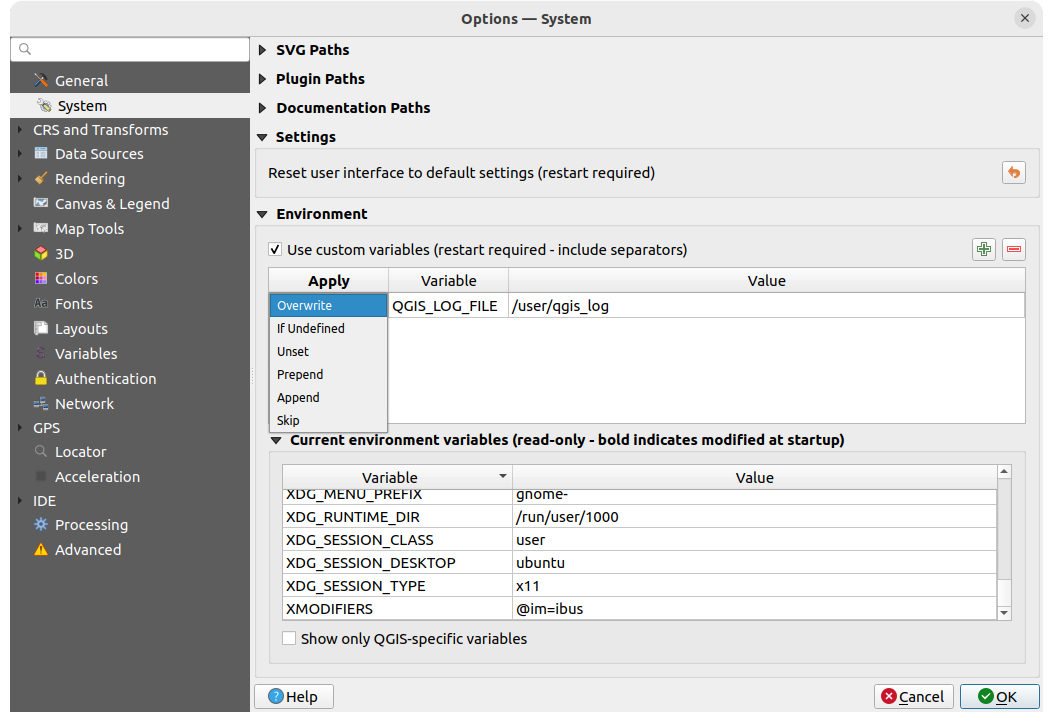
Fig. 5.2 System environment variables
System environment variables can be viewed, and many configured, in the Environment group. This is useful for platforms, such as Mac, where a GUI application does not necessarily inherit the user’s shell environment. It’s also useful for setting and viewing environment variables for the external tool sets controlled by the Processing toolbox (e.g., GRASS), and for turning on debugging output for specific sections of the source code.
Check Use custom variables (restart required - include separators)
and you can  Add and
  Remove environment
variables.
For each new item, you can configure a Variable name, its Value
and the Apply method to use, among which:
Remove environment
variables.
For each new item, you can configure a Variable name, its Value
and the Apply method to use, among which:
Overwrite: replace any preexisting value of the variable
If undefined: use this value for the variable if not already defined at a higher level (e.g., OS or application levels)
Unset: remove the variable from the environment (the Value parameter is not used)
Prepend: prepend the value to the preexisting value of the variable
Append: append the value to the preexisting value of the variable
Skip: the item is kept in the list for future reference but unused
Already defined environment variables are displayed in Current environment
variables, and it’s possible to filter them by activating
Show only QGIS-specific variables.
5.1.3. User Profiles Settings
Note
For more information on how to manage user profiles, please read the dedicated section at Working with User Profiles.
5.1.4. CRS and Transforms Settings
Note
For more information on how QGIS handles layer projection, please read the dedicated section at Working with Projections.
5.1.4.1. CRS Handling
In the  CRS Handling tab you can configure which CRS will
be used for a new project or layer.
CRS Handling tab you can configure which CRS will
be used for a new project or layer.
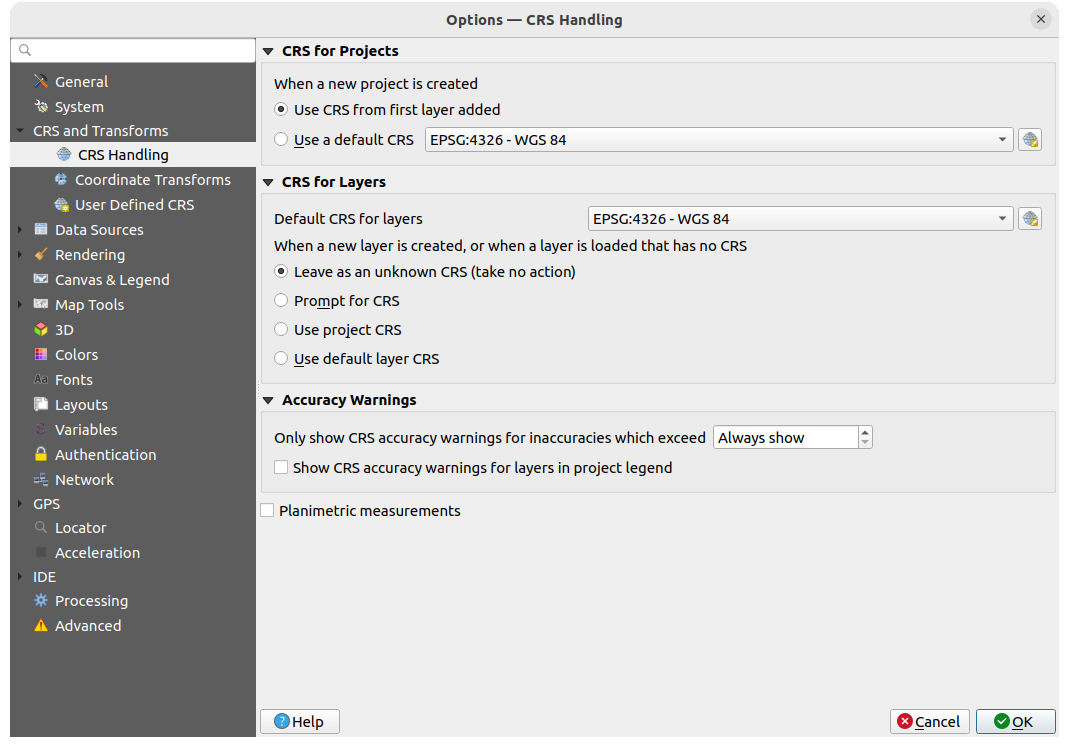
Fig. 5.3 CRS Settings
CRS for Projects
There is an option to automatically set new project’s CRS:
- Use CRS from first layer added: the CRS of the
project will be set to the CRS of the first layer loaded into it
- Use a default CRS: a preselected CRS is applied by
default to any new project and is left unchanged when adding layers to the
project.
The choice will be saved for use in subsequent QGIS sessions. The Coordinate Reference System of the project can still be overridden from the tab.
CRS for Layers
Default CRS for layers: select a default CRS to use when you create a layer
You can also define the action to take when a new layer is created, or when a layer without a CRS is loaded.
- Leave as unknown CRS (take no action)
- Prompt for CRS
- Use project CRS
- Use default layer CRS
Accuracy Warnings
Only show CRS accuracy warnings for inaccuracies which exceed a given
distance: occurs when you are explicitly creating or modifying a dataset and
select a CRS based on a datum ensemble with lower
accuracy. The default is to Always show the warning if any inaccuracy.
Show CRS accuracy warning for layers in project legend:
If checked, any layer with a CRS with accuracy issues (i.e., a dynamic crs with
no coordinate epoch available, or a CRS based on a datum ensemble with inherent inaccuracy
exceeding the user-set limit) will have the  warning icon
in the Layers panel reflecting that it is a low-accuracy layer.
warning icon
in the Layers panel reflecting that it is a low-accuracy layer.
This is designed for use in engineering, BIM, asset management, and other fields where inaccuracies of meter/submeter level are potentially very dangerous or expensive!
Planimetric measurements: sets the default for the
planimetric measurements property for newly created projects.
5.1.4.2. Coordinate Transforms
The  Coordinate Transforms tab helps you set coordinate
transformations and operations to apply when loading a layer to a project or
reprojecting a layer.
Coordinate Transforms tab helps you set coordinate
transformations and operations to apply when loading a layer to a project or
reprojecting a layer.
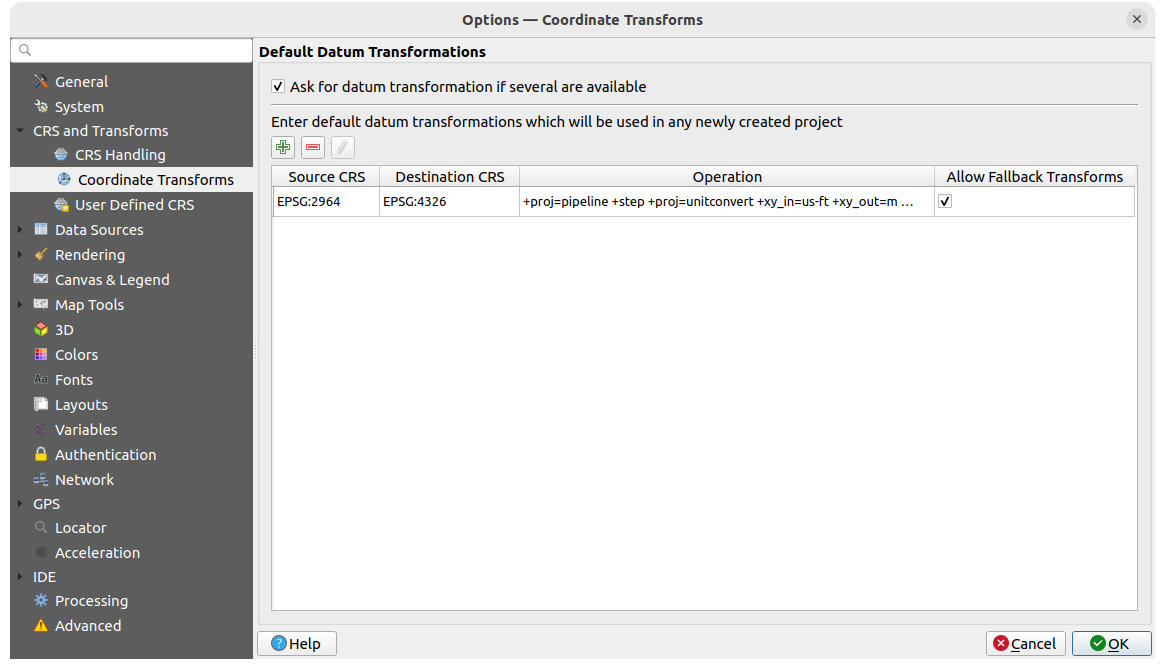
Fig. 5.4 Transformations settings
Default Datum Transformations
Here you can control whether reprojecting layers to another CRS should be:
automatically processed using QGIS default transformations settings;
and/or more controlled by you with custom preferences such as:
- Ask for datum transformation if several are available
a predefined list of datum transformations to apply by default. See Datum Transformations for more details.
You can Add, Remove
or  Edit transformations,
which will be used in any newly created project.
Edit transformations,
which will be used in any newly created project.
5.1.4.3. User Defined CRS
The User Defined CRS tab helps you to define a custom CRS
which must conform to a WKT or Proj string format.
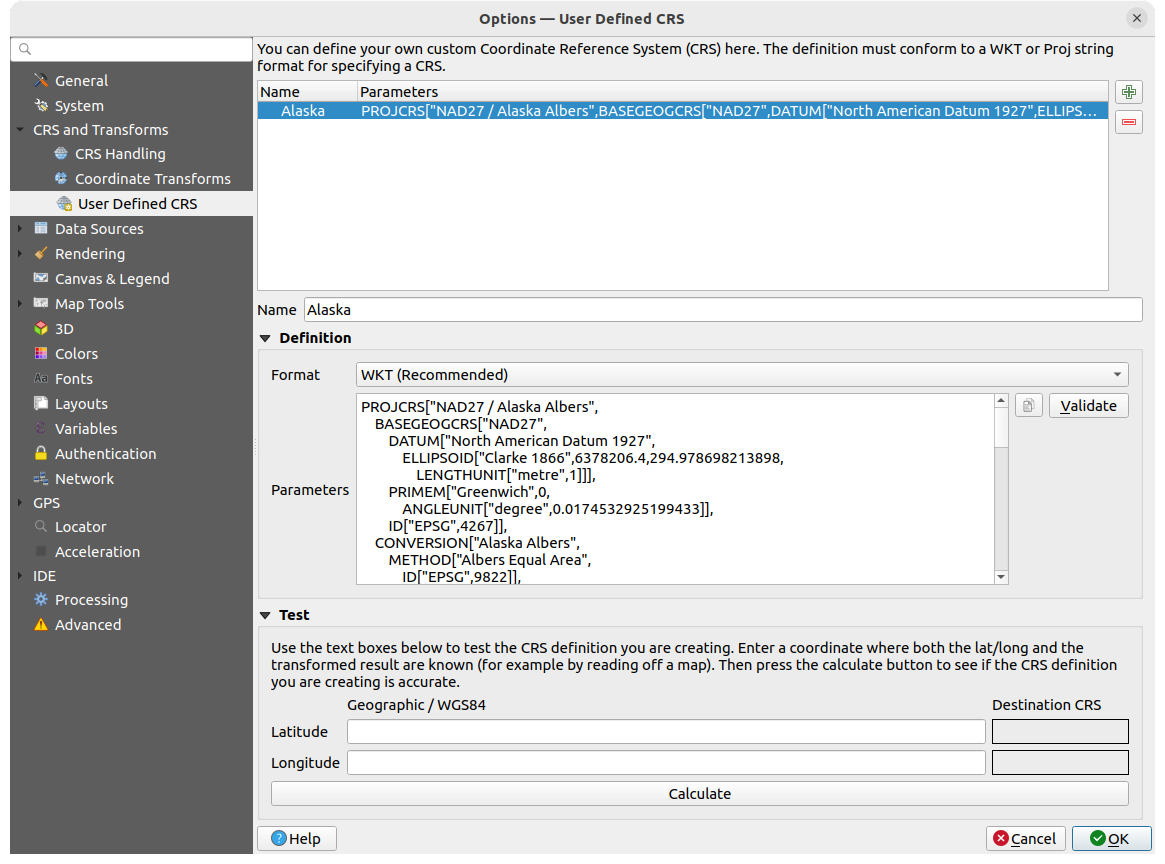
Fig. 5.5 User Defined CRS
Set a Name and use Add new CRS.
If you want to delete an existing one you can use Remove CRS.
Definition
- Format
WKT (Recommended)
Proj String (Legacy - Not Recommended)
- Parameters
 Copy parameters from an existing CRS.
Validate tests if your expression is correct.
Test
Here you can test your created CRS definition by Latitude and Longitude. Use a known coordinate to control if your definition is accurate.
5.1.5. Data Sources settings
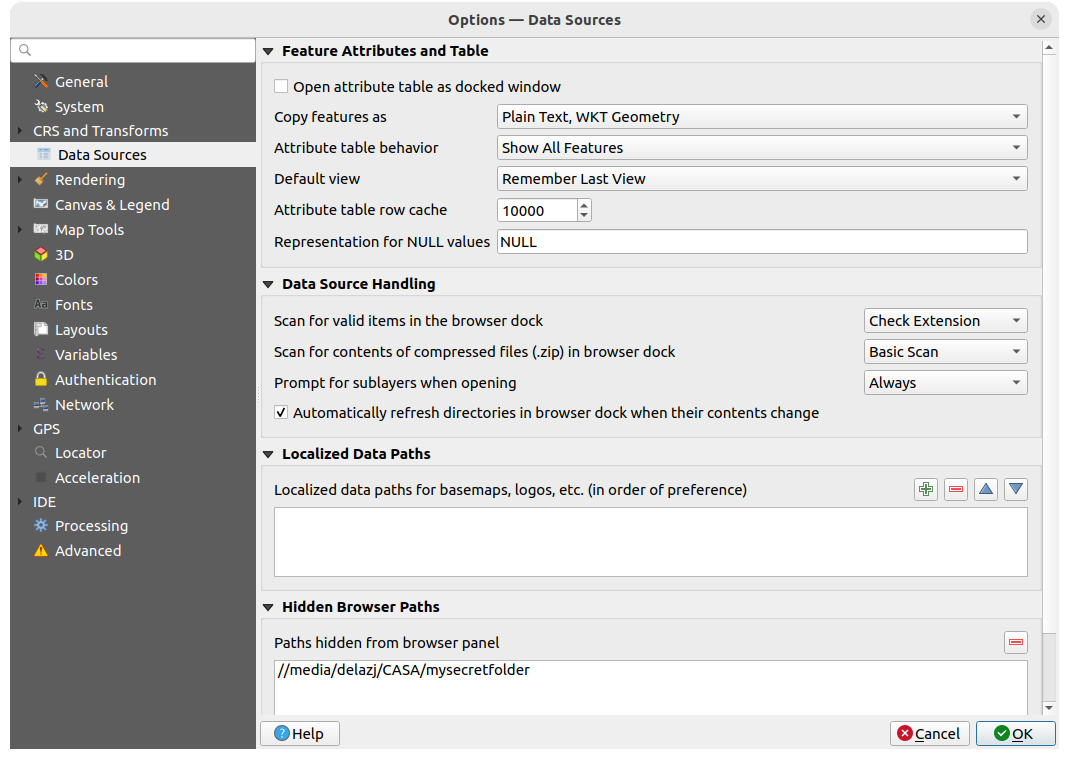
Fig. 5.6 Data Sources settings
Feature attributes and table
- Open attribute table as docked window
- Autosize all columns by default when opening attribute table
Copy features as: defines the format to use for data when pasting features in other applications.
Plain text, no geometry: attributes are copied as text but the geometry is skipped
Plain text, WKT geometry: attributes are copied as text and the geometry is returned in WKT
Plain text, WKB geometry: attributes are copied as text and the geometry is returned in WKB (hex format)
GeoJSON: attributes and geometry are formatted as GeoJSON data
Attribute table behavior
: set filter on the attribute
table at the opening. There are three possibilities: ‘Show all features’,
‘Show selected features’ and ‘Show features visible on map’.Default view: define the view mode of the attribute table at every opening. It can be ‘Remember last view’, ‘Table view’ or ‘Form view’.
Attribute table row cache
 . This row cache makes
it possible to save the last loaded N attribute rows so that working with the
attribute table will be quicker. The cache will be deleted when closing the
attribute table.
. This row cache makes
it possible to save the last loaded N attribute rows so that working with the
attribute table will be quicker. The cache will be deleted when closing the
attribute table.Representation for NULL values. Here, you can define a value for data fields containing a NULL value.
Tip
Improve opening of big data attribute table
When working with layers with big amount of records, opening the attribute table may be slow as the dialog request all the rows in the layer. Setting the Attribute table behavior to Show features visible on map will make QGIS request only the features in the current map canvas when opening the table, allowing a quick data loading.
Note that data in this attribute table instance will be always tied to the canvas extent it was opened with, meaning that selecting Show All Features within such a table will not display new features. You can however update the set of displayed features by changing the canvas extent and selecting Show Features Visible On Map option in the attribute table.
Data source handling
Scan for valid items in the browser dock
. You can
choose between ‘Check extension’ and ‘Check file contents’.Scan for contents of compressed files (.zip) in browser dock
defines how detailed is the widget information at the bottom
of the Browser panel when querying such files. ‘No’, ‘Basic scan’ and ‘Full scan’
are possible options.Prompt for sublayers when opening. Some rasters support sublayers — they are called subdatasets in GDAL. An example is netCDF files — if there are many netCDF variables, GDAL sees every variable as a subdataset. The option allows you to control how to deal with sublayers when a file with sublayers is opened. You have the following choices:
‘Always’: Always ask (if there are existing sublayers)
‘If needed’: Ask if layer has no bands, but has sublayers
‘Never’: Never prompt, will not load anything
‘Load all’: Never prompt, but load all sublayers
- Automatically refresh directories in browser dock when
their contents change: Allows you to manually opt-out of monitoring directories
in the Browser panel by default (eg, to avoid potential slow down
due to network latency).
Localized data paths
It is possible to use localized paths for any kind of file based data source.
They are a list of paths which are used to abstract the data source location.
For instance, if C:\my_maps is listed in the localized paths,
a layer having C:\my_maps\my_country\ortho.tif as data source
will be saved in the project using localized:my_country\ortho.tif.
The paths are listed by order of preference, in other words QGIS will first look for the file in the first path, then in the second one, etc.
Hidden browser paths
This widget lists all the folders you chose to hide from the Browser panel. Removing a folder from the list will make it available in the Browser panel.
5.1.5.1. GDAL Settings
GDAL is a data exchange library for geospatial data that supports a large number of vector and raster formats. It provides drivers to read and (often) write data in these formats. The GDAL tab exposes the drivers for raster and vector formats with their capabilities.
GDAL raster and vector drivers
The Raster Drivers and Vector Drivers tabs allow you to define which GDAL driver is enabled to read and/or write files, as in some cases more than one GDAL driver is available.
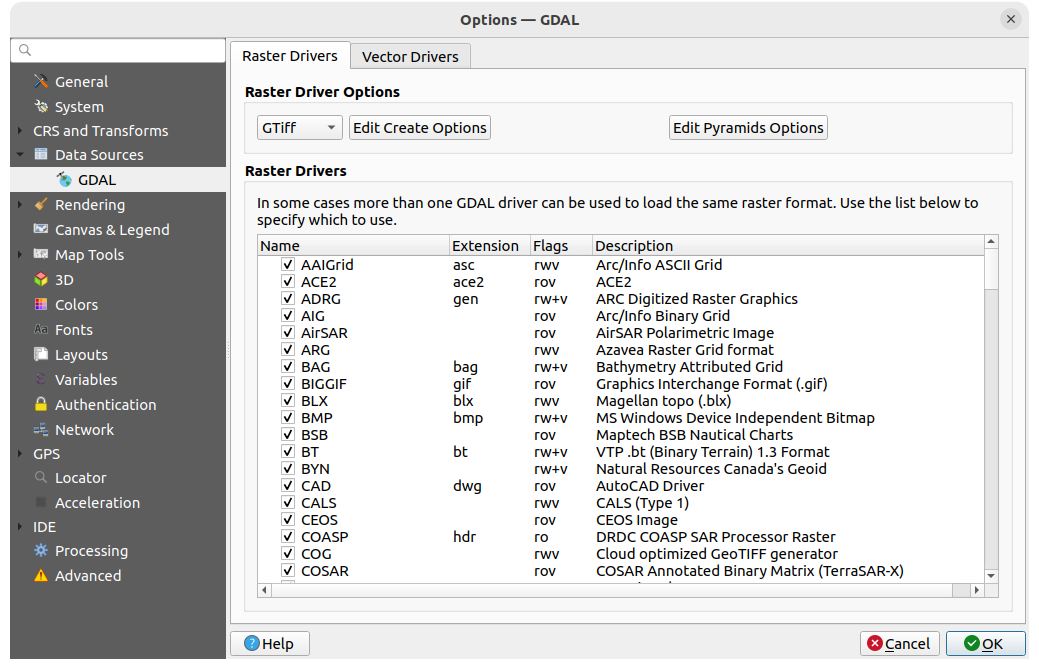
Fig. 5.7 GDAL Settings - Raster drivers
Tip
Double-click a raster driver that allows read and write access
(rw+(v)) opens the Edit Create options
dialog for customization.
Raster driver options
This frame provides ways to customize the behavior of raster drivers that support read and write access:
Edit create options: allows you to edit or add different profiles of file transformation, i.e., a set of predefined combinations of parameters (type and level of compression, BIGTIFF support, blocks size, overview, colorimetry, alpha…) to use when outputting raster files. The parameters depend on the driver.
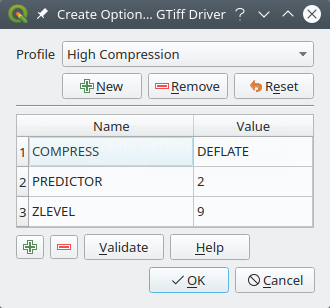
Fig. 5.8 Sample of create options profile (for GeoTiff)
The upper part of the dialog lists the current profile(s) and allows you to add new ones or remove any of them. You can also reset the profile to its default parameters if you have changed them. Some drivers (eg, GeoTiff) have some sample of profiles you can work with.
At the bottom of the dialog:
The
button lets you add rows to fill with the parameter name and valueThe
button deletes the selected parameterClick the Validate button to check that the creation options entered for the given format are valid
Use the Help button to find the parameters to use, or refer to the GDAL raster drivers documentation.
Edit Pyramids Options
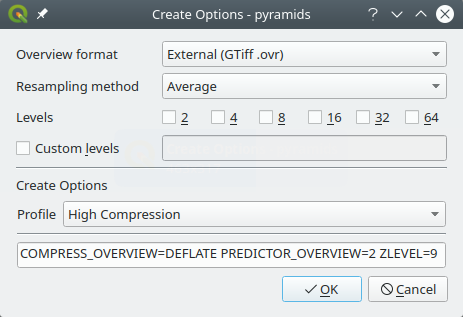
Fig. 5.9 Sample of pyramids profile
5.1.6. Rendering Settings
The  Rendering tab provides settings for controlling
layers rendering in the map canvas.
Rendering tab provides settings for controlling
layers rendering in the map canvas.
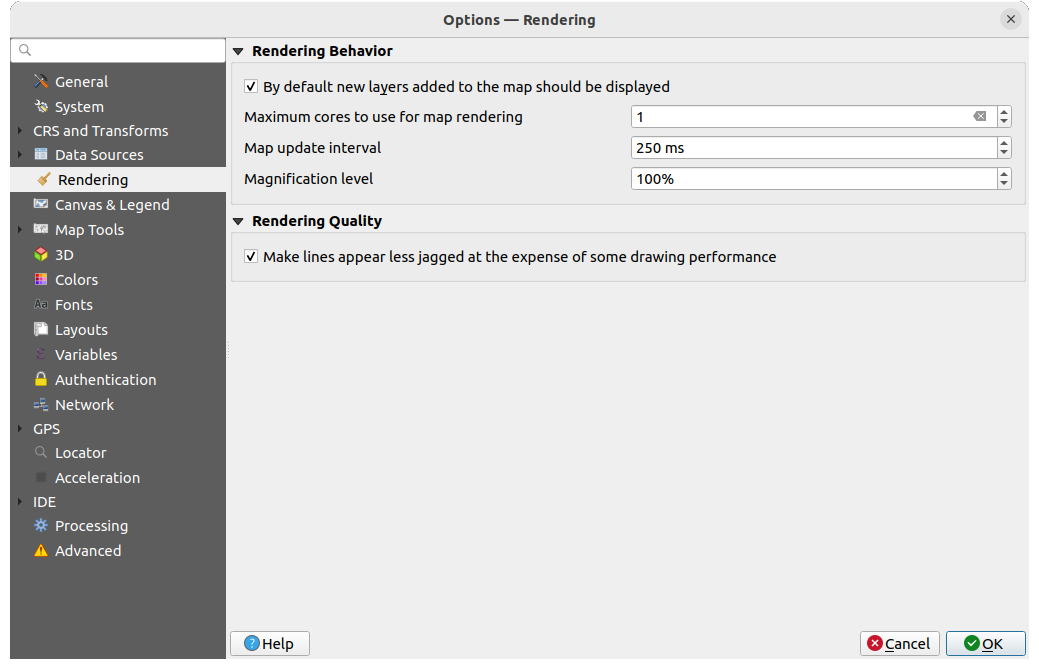
Fig. 5.10 Rendering settings
Rendering Behavior
- By default new layers added to the map should be
displayed: unchecking this option can be handy when loading multiple layers
to avoid each new layer being rendered in the canvas and slow down the process
Set the Maximum cores to use for map rendering
The map canvas renders in the background onto a separate image and at each Map update interval (defaults to 250 ms), the content from this (off-screen) image will be taken to update the visible screen representation. However, if rendering finishes faster than this duration, it will be shown instantaneously.
Magnification level (see the magnifier)
Rendering Quality
- Make lines appear less jagged at the expense of some
drawing performance
5.1.6.1. Vector rendering settings
The  Vector tab contains specific settings
for rendering vector layers.
Vector tab contains specific settings
for rendering vector layers.
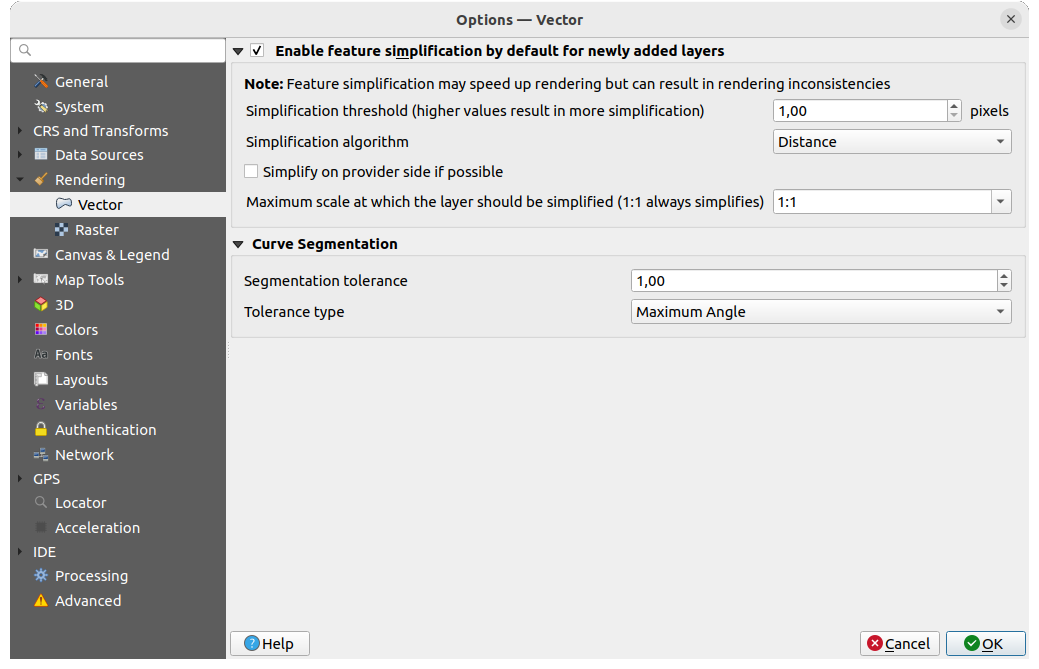
Fig. 5.11 Vector rendering settings
- Enable Feature Simplification by Default for Newly Added
Layers: you simplify features’ geometry (fewer nodes) and as a result, they
display more quickly. Be aware that this can cause rendering inconsistencies.
Available settings are:
Simplification threshold (higher values result in more simplification)
Simplification algorithm: This option performs a local “on-the-fly” simplification on feature’s and speeds up geometry rendering. It doesn’t change the geometry fetched from the data providers. This is important when you have expressions that use the feature geometry (e.g., calculation of area) - it ensures that these calculations are done on the original geometry, not on the simplified one. For this purpose, QGIS provides three algorithms: ‘Distance’ (default), ‘SnapToGrid’ and ‘Visvalingam’.
- Simplify on provider side if possible: the geometries
are simplified by the provider (PostgreSQL, Oracle…) and unlike the
local-side simplification, geometry-based calculations may be affected
Maximum scale at which the layer should be simplified (1:1 always simplifies)
Note
Besides the global setting, feature simplification can be set for any specific layer from its menu.
Curve Segmentation
Segmentation tolerance: this setting controls the way circular arcs are rendered. The smaller maximum angle (between the two consecutive vertices and the curve center, in degrees) or maximum difference (distance between the segment of the two vertices and the curve line, in map units), the more straight line segments will be used during rendering.
Tolerance type: it can be Maximum angle or Maximum difference between approximation and curve.
5.1.6.2. Raster rendering settings
The  Raster tab contains specific settings for rendering
raster layers.
Raster tab contains specific settings for rendering
raster layers.
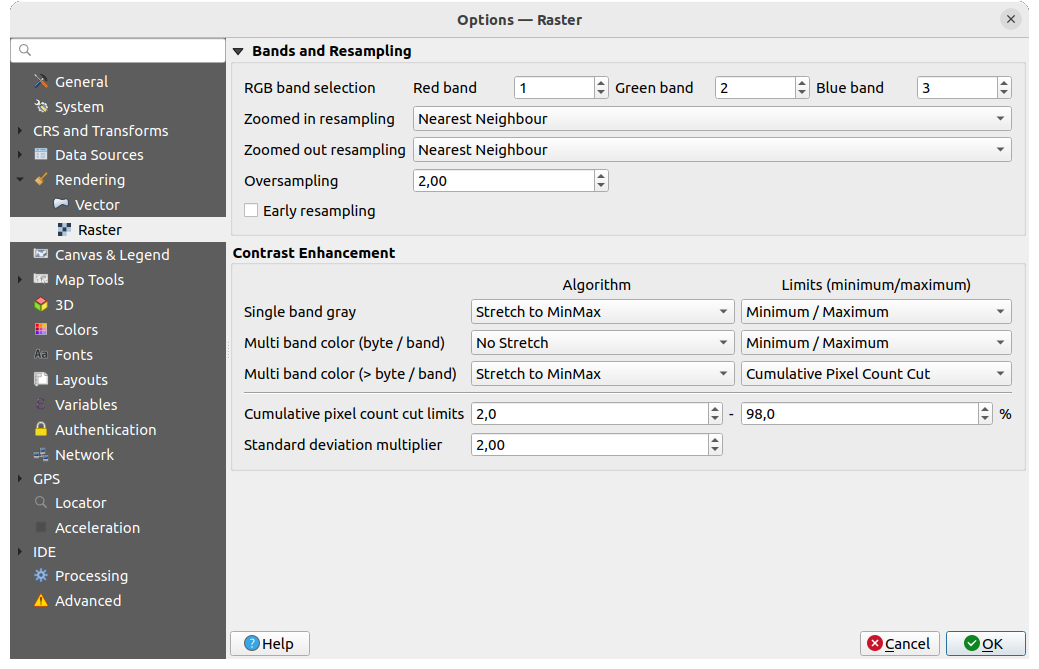
Fig. 5.12 Raster rendering settings
Under Bands and Resampling:
With RGB band selection, you can define the number for the Red, Green and Blue band.
The Zoomed in resampling and the Zoomed out resampling methods can be defined. For Zoomed in resampling you can choose between three resampling methods: ‘Nearest neighbour’, ‘Bilinear (2x2 kernel)’ and ‘Cubic (4x4 kernel)’. For Zoomed out resampling you can choose between ‘Nearest Neighbour’ and ‘Average’. You can also set the Oversampling value (between 0.0 and 99.99 - a large value means more work for QGIS - the default value is 2.0).
- Early resampling: allows to calculate the raster
rendering at the provider level where the resolution of the source is known,
and ensures a better zoom in rendering with QGIS custom styling.
Really convenient for tile rasters loaded using an interpretation method.
The option can also be set at the layer level (Symbology properties)
Contrast Enhancement options can be applied to Single band gray, Multi band color (byte/band) or Multi band color (>byte/band). For each, you can set:
the Algorithm to use, whose values can be ‘No stretch’, ‘Stretch to MinMax’, ‘Stretch and Clip to MinMax’ or ‘Clip to MinMax’
the Limits (minimum/maximum) to apply, with values such as ‘Cumulative pixel count cut’, ‘Minimum/Maximum’, ‘Mean +/- standard deviation’.
The Contrast Enhancement options also include:
Cumulative pixel count cut limits
Standard deviation multiplier
5.1.7. Canvas and Legend Settings
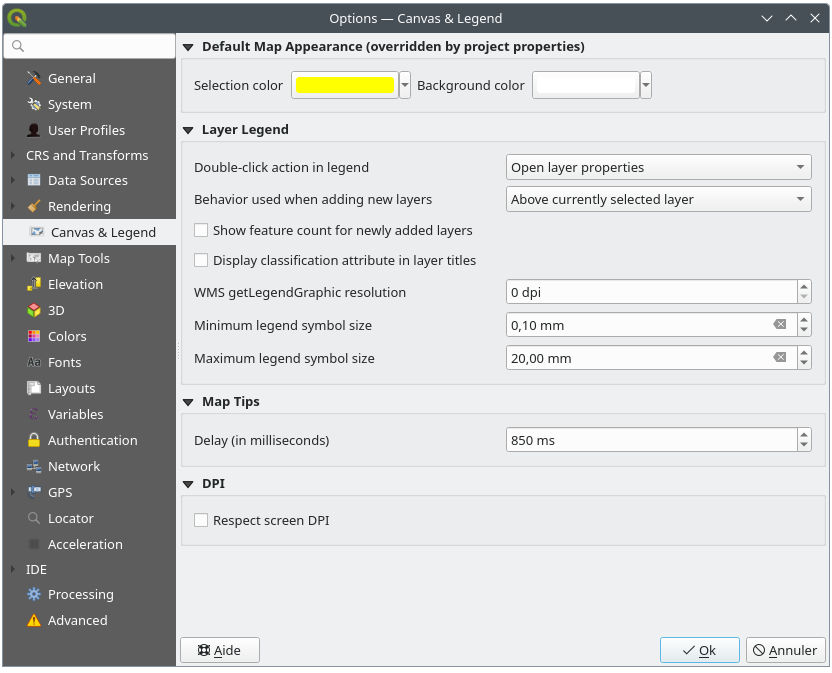
Fig. 5.13 Canvas & Legend settings
These properties let you set:
the Default map appearance (overridden by project properties): the Selection color and Background color.
Layer legend interaction:
Double click action in legend: whether a double-click on a layer should either Open layer properties (default), Open attribute table or Open layer styling dock.
Behavior used when adding new layers: determines where layers are placed in the Layers panel when loaded into QGIS. It can be:
Above currently selected layer
Always on top of the layer tree
Optimal index within current layer tree group: Unlike the other options that sort the new layers among them and place them as a stack at the desired location, this option extents the sorting logic to the whole layer tree (or the active group) and inserts new layers in an “optimal” fashion by insuring that point layers sit on top of point layers, followed by line layers on top of lines, followed by polygon layers, etc.
- Show feature count for newly added layers:
displays in the Layers panel the number of features next to the layer name.
Feature count of classes, if any, is as well displayed.
You can right-click on a layer to turn on/off its feature count.
- Display classification attribute names in the Layers
panel, e.g., when applying a categorized or rule-based renderer
(see Symbology Properties for more information).
the WMS getLegendGraphic Resolution
Minimum and Maximum legend symbol size to control symbol size display in the Layers panel
the Delay in milliseconds of layers map tips display
Whether QGIS should
Respect screen DPI: If enabled,
QGIS will attempt to display the canvas with physically
accurate scale on screen, depending on the monitor’s physical DPI. Symbology with specified
display size will also be rendered accurately, e.g., a 10mm
symbol will show as 10mm on screen. However, label font sizes on canvas may differ from those in
QGIS’ UI or other applications. If this setting is turned off, QGIS will use the operating
system’s logical DPI, which will be consistent with other applications on the system. However,
canvas scale and symbology size may be physically inaccurate on screen. In particular, on
high-dpi screens, symbology is likely to appear too small.For best experience, it is recommended to enable
Respect screen DPI,
especially when using multiple or different monitors and preparing visually high-quality maps.
Disabling Respect screen DPI will generate output that
may be more suitable for mapping intended for on-screen use only, especially
where font sizes should match other applications.
Note
Rendering in layouts is not affected by the Respect screen DPI setting; it always respects the specified DPI for the target output device. Also note that this setting uses the physical screen DPI as reported by the operating system, which may not be accurate for all displays.
5.1.8. Map tools Settings
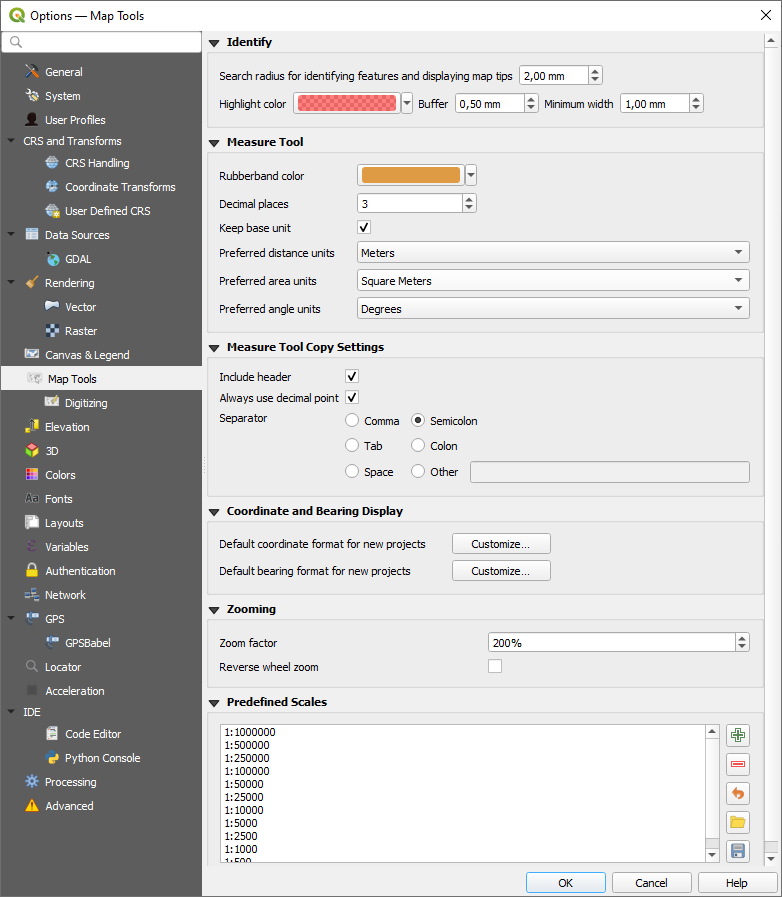
Fig. 5.14 Map tools settings
Measurements, Coordinate and Bearing Display
This section provides ways to configure default units parameters:
Define Decimal places
- Keep base unit to not automatically convert large
numbers (e.g., meters to kilometers)
Preferred angle units: options are ‘Degrees’, ‘Radians’, ‘Gon/gradians’, ‘Minutes of arc’, ‘Seconds of arc’, ‘Turns/revolutions’, milliradians (SI definition) or mil (NATO/military definition)
Default distance units for new projects: options are ‘Meters’, ‘Kilometers’, ‘Feet’, ‘Yards’, ‘Miles’, ‘Nautical Miles’, ‘Centimeters’, ‘Millimeters’, ‘Inches’, ‘Degrees’ or ‘Map Units’ (automatically matches the project’s CRS units)
Preferred area units for new projects: options are ‘Square meters’, ‘Square kilometers’, ‘Square feet’, ‘Square yards’, ‘Square miles’, ‘Hectares’, ‘Acres’, ‘Square nautical miles’, ‘Square centimeters’, ‘Square millimeters’, ‘Square inches’, ‘Square degrees’ or ‘Map Units’ (automatically matches the project’s CRS units)
Default coordinate format for new projects, as displayed in the Coordinates box on QGIS status bar and in the Derived section of the
 Identify features tool’s results
Default bearing format for new projects, as displayed in the status bar for the map canvas panning direction and by the
 Measure bearing tool.
The global options can be overridden at the project level, here for measurement units and here for coordinate and bearing formatting.
Identify tool
This group offers some options regarding the behavior of the Identify tool.
Search radius for identifying features and displaying map tips is a tolerance distance within which the identify tool will depict results as long as you click within this tolerance.
Highlight color allows you to choose with which color features being identified should be highlighted.
Buffer determines a buffer distance to be rendered from the outline of the identify highlight.
Minimum width determines how thick should the outline of a highlighted object be.
Measure tool
Define Rubberband color for measure tools
Measure Tool Copy Settings
These settings allow you to control the behavior of the Copy button
in the  Measure Line window. You can choose to
Include header to keep column names, and you can also
select Separator of your choice. You can also choose
Always use decimal point to keep your coordinates copied
to the clipboard with a dot as a decimal separator, even if your language settings
in QGIS options are set up to use a comma. In this case, if you don’t have the
Always use decimal point
option checked, you will be unable to select comma as a field separator.
Measure Line window. You can choose to
Include header to keep column names, and you can also
select Separator of your choice. You can also choose
Always use decimal point to keep your coordinates copied
to the clipboard with a dot as a decimal separator, even if your language settings
in QGIS options are set up to use a comma. In this case, if you don’t have the
Always use decimal point
option checked, you will be unable to select comma as a field separator.
Panning and zooming
Define a Zoom factor for zoom tools or wheel mouse
- Reverse wheel zoom allows you to adjust
mouse wheel scrolling direction.
Predefined scales
Here, you find a list of predefined scales to display by default in the scale-related drop-down widgets,
such as the status bar Scale, the visibility scales selector or secondary 2D map view settings,…
With the and buttons you can add or remove your personal scales.
You can also import or export scales from/to a .XML file. Note that you
still have the possibility to remove your changes and reset to the predefined list.
From the project properties dialog, you can also set your own list of scales, overriding this global one in the widgets.
5.1.8.1. Digitizing settings
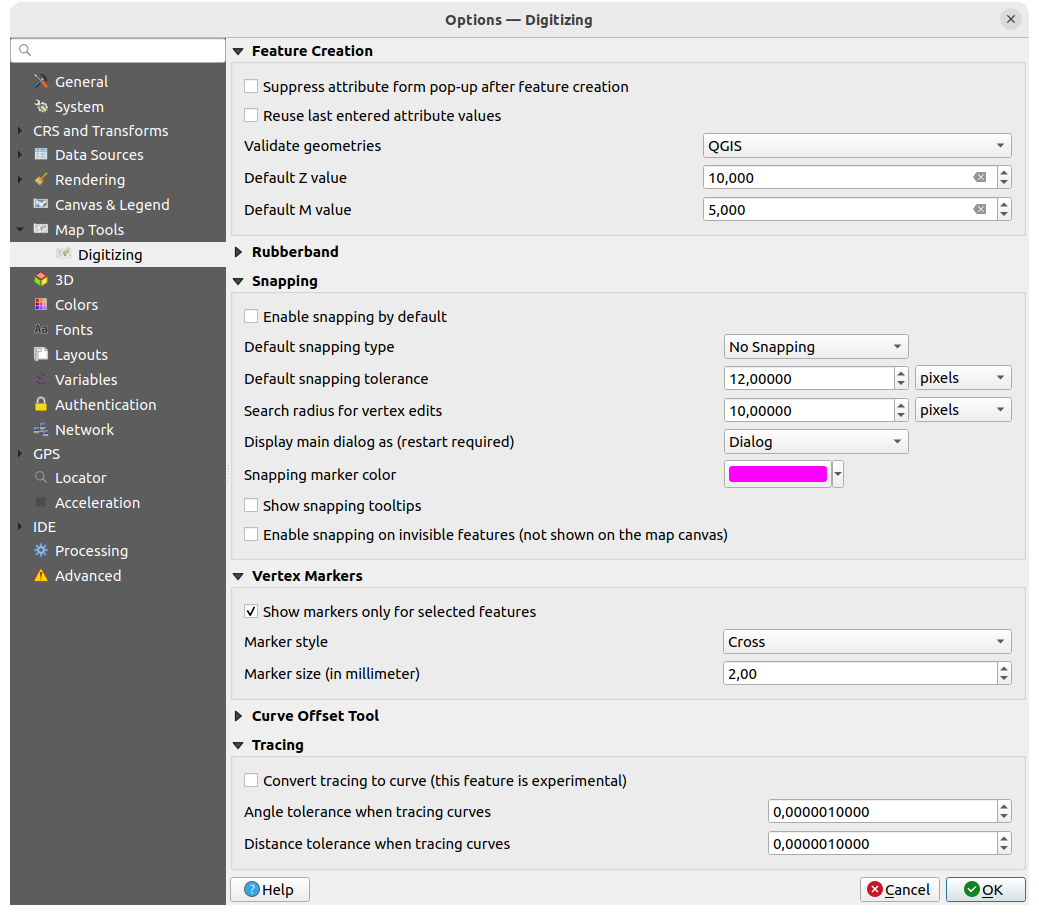
Fig. 5.15 Digitizing settings
This tab helps you configure general settings when editing vector layer (attributes and geometry).
Feature creation
- Suppress attribute form pop-up after feature creation:
this choice can be overridden in each layer properties dialog.
- Reuse last entered attribute values: remember the last
used value of every attribute and use it as default for the next feature being digitized.
Works per layer. This behavior can also be controlled on a per-field basis
(see Configure the field behavior).
Validate geometries. Editing complex lines and polygons with many nodes can result in very slow rendering. This is because the default validation procedures in QGIS can take a lot of time. To speed up rendering, it is possible to select GEOS geometry validation or to switch it off. GEOS geometry validation is much faster, but the disadvantage is that only the first geometry problem will be reported.
Note that depending on the selection, reports of geometry errors may differ (see Types of error messages and their meanings)
Default Z value to use when creating new 3D features.
Rubberband
Define Rubberband Line width, Line color and Fill color.
Don’t update rubberband during vertex editing.
Snapping
- Enable snapping by default activates snapping when
a project is opened
Define Default snap mode
(‘Vertex’, ‘Segment’, ‘Centroid’,
‘Middle of segments’, ‘Line endpoints’, ‘Area’)Define Default snapping tolerance in map units or pixels
Define the Search radius for vertex edits in map units or pixels
Display main dialog as (restart required): set whether the Advanced Snapping dialog should be shown as ‘Dialog’ or ‘Dock’.
Snapping marker color
- Show snapping tooltips such as name of the layer whose
feature you are about to snap. Helpful when multiple features overlap.
- Enable snapping on invisible features (not shown on the
map canvas)
Vertex markers
- Show markers only for selected features
Define vertex Marker style
(‘Cross’ (default), ‘Semi
transparent circle’ or ‘None’)Define vertex Marker size (in millimeter)
Curve offset tool
The next options refer to the  Offset Curve tool in Advanced digitizing.
Through the various settings, it is possible to influence the shape of the line offset.
Offset Curve tool in Advanced digitizing.
Through the various settings, it is possible to influence the shape of the line offset.
Join style: specifies whether ‘Round’, ‘Miter’ or ‘Bevel’ joins should be used when offsetting corners
Quadrant segments: controls the number of line segments to use to approximate a quarter circle when creating rounded offsets
Miter limit: Sets the maximum distance from the offset geometry to use when creating a mitered join as a factor of the offset distance (only applicable for miter join style)
End cap style: controls how line endings are handled; they can be ‘Round’, ‘Flat’ or ‘Square’.
Tracing
By activating the Convert tracing to curve you can
create curve segments while digitizing. Keep in mind that your data provider
must support this feature.
5.1.9. Elevation settings
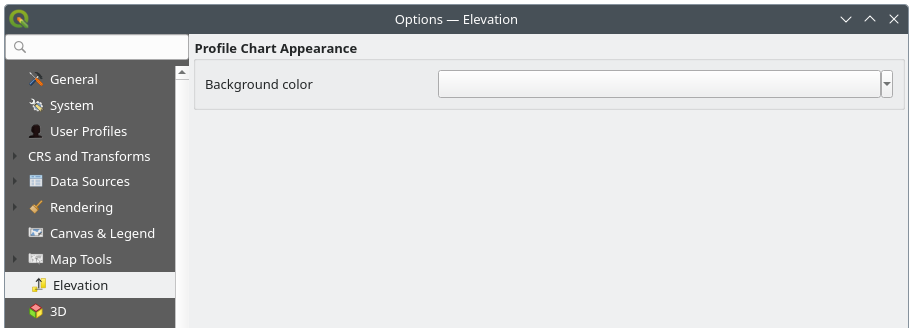
Fig. 5.16 Elevation settings
In  Elevation menu, you can set a specific color
to use as the Background color for elevation profiles.
This can make the chart more readable for certain datasets, e.g., point clouds with RGB coloring,
where the default background color is too similar to point colors to be easily discernible.
If unchanged, the elevation profiles will continue to display using the standard system background color.
Elevation menu, you can set a specific color
to use as the Background color for elevation profiles.
This can make the chart more readable for certain datasets, e.g., point clouds with RGB coloring,
where the default background color is too similar to point colors to be easily discernible.
If unchanged, the elevation profiles will continue to display using the standard system background color.
5.1.10. 3D settings
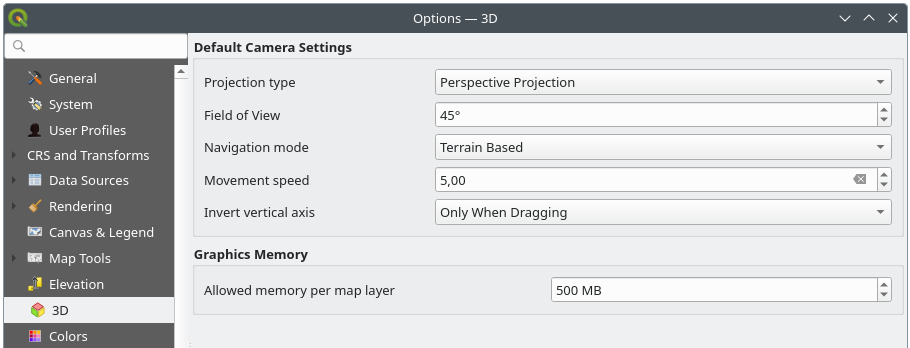
Fig. 5.17 3D settings
The  3D menu helps you configure some default settings to use
for any 3D Map view. These can refer to:
3D menu helps you configure some default settings to use
for any 3D Map view. These can refer to:
Default Camera Settings:
Projection type: allowing to view the 3D scene in a:
Perspective projection (default): Parallel lines appear to meet in the distance. Objects appear to shrink the farther they are from the camera.
or an Orthogonal projection: Parallel lines appear parallel. Objects appear the same size regardless of distance.
Camera’s Field of view: only relevant in perspective projection, specifies the current vertical field of view in degrees and determines how much of the scene is visible to the camera. Default value is 45°.
Navigation mode: provides different means to interact with the 3D scene. Available modes are:
Terrain based: the camera follows around a fixed position on the surface of the terrain as the scene is navigated.
Walk mode (first person)
Depending on the selected mode, navigation commands differ.
Movement speed
Invert vertical axis: Controls whether vertical axis movements should be inverted from their normal behaviour. Only affects movement in the Walk mode. It can be set to:
Never
Only when dragging: causes the vertical motion to inverted only when performing a click-and-drag camera rotation
and Always: causes the motions to be inverted when both click-and-dragging and when the camera movement is locked to the cursor (via a ~ key press)
Under Graphics memory, the Allowed memory per layer option lets you set the GPU memory limit configuration on each layer. This is useful for users utilizing large 3D scenes which exhaust the available GPU memory resources. When a limit is hit, a warning is also displayed, which should assist in troubleshooting large scenes.
5.1.11. Colors settings
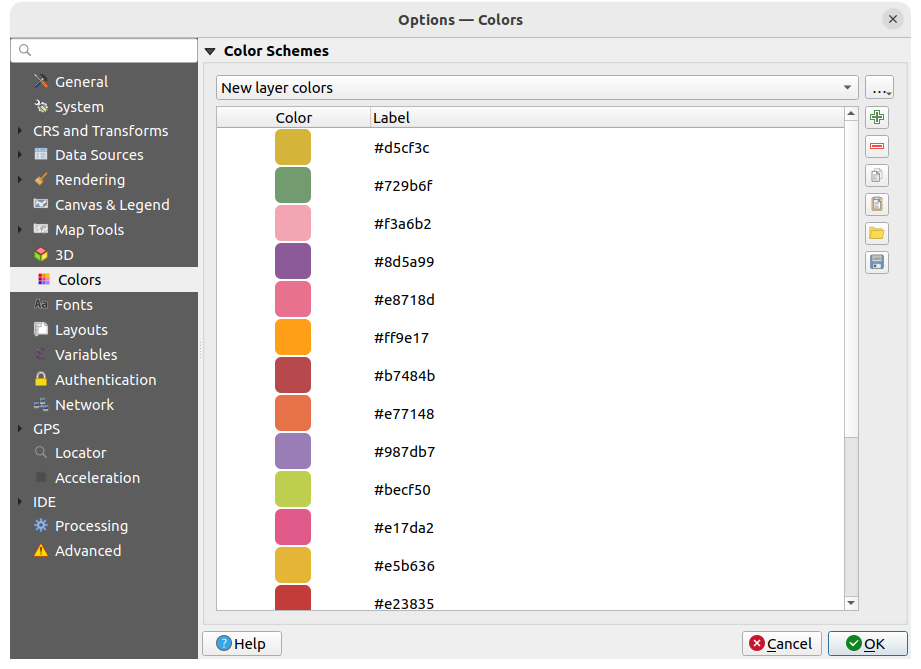
Fig. 5.18 Colors settings
This menu allows you to create or update palettes of colors used throughout the application in the color selector widget. You can choose from:
Recent colors showing recently used colors
Standard colors, the default palette of colors
Project colors, a set of colors specific to the current project (see Styles Properties for more details)
New layer colors, a set of colors to use by default when new layers are added to QGIS
or custom palette(s) you can create or import using the … button next to the palette combobox.
By default, Recent colors, Standard colors and Project colors palettes can not be removed and are set to appear in the color button drop-down. Custom palettes can also be added to this widget thanks to the Show in Color Buttons option.
For any of the palettes, you can manage the list of colors using the set of tools next to the frame, ie:
- Add or Remove color
- Copy or
 Paste color
  Import or
  Export the set of colors
from/to
Export the set of colors
from/to .gplfile.
Double-click a color in the list to tweak or replace it in the Color Selector dialog. You can also rename it by double-clicking in the Label column.
5.1.12. Fonts Settings
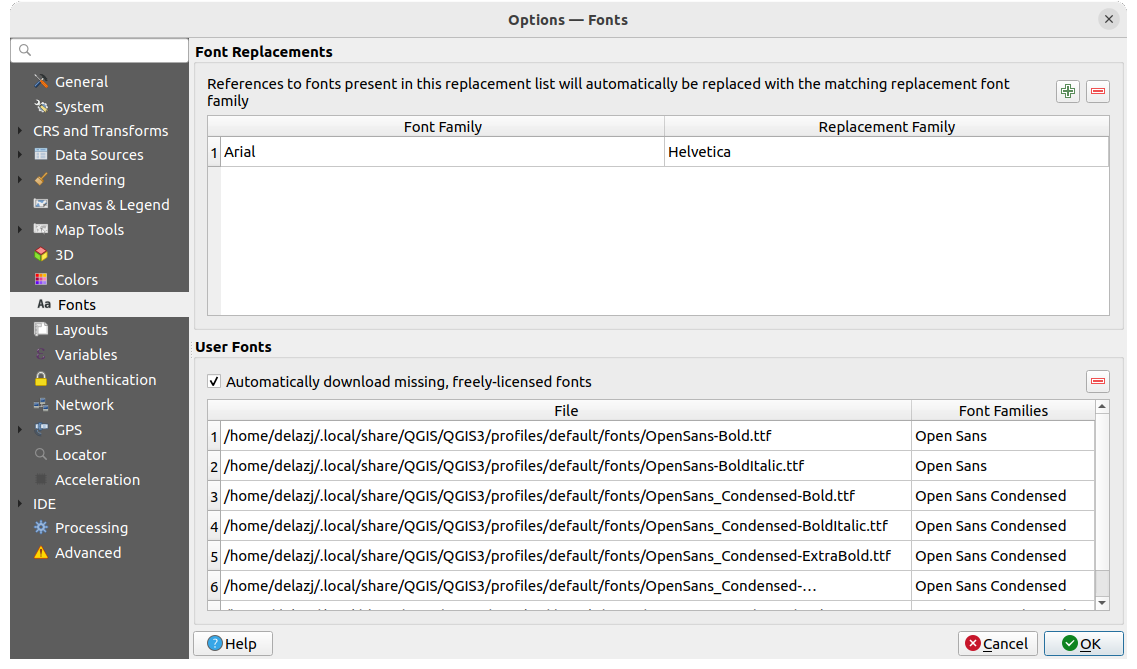
Fig. 5.19 Fonts settings
The Fonts tab provides support to manage fonts used across the projects:
Font Replacements: gives ability to populate a list of automatic font replacements to apply when loading projects or styles, allowing better support for projects and styles to be used across different operating systems (e.g., replace “Arial” with “Helvetica”).
User Fonts: Allows you to place TTF or OTF fonts in the
fontssub-folder of the user profile. These fonts can be automatically loaded at QGIS startup time. This provides a way to use fonts without requiring them to be installed on an operating system level, which is often blocked in enterprise environments. The panel lists all installed user fonts and allows you to manage (i.e., remove) previously installed user fonts.It is also possible to
Automatically download missing, freely-licensed fonts:
E.g., if you open a project or style, or try to load a vector tile layer that references fonts that aren’t currently available,
then a hard-coded list of freely licensed fonts to download via URL is consulted to determine whether
it’s possible to automatically download the font to the user profile font directory (with notification of the font license).
5.1.13. Layouts settings
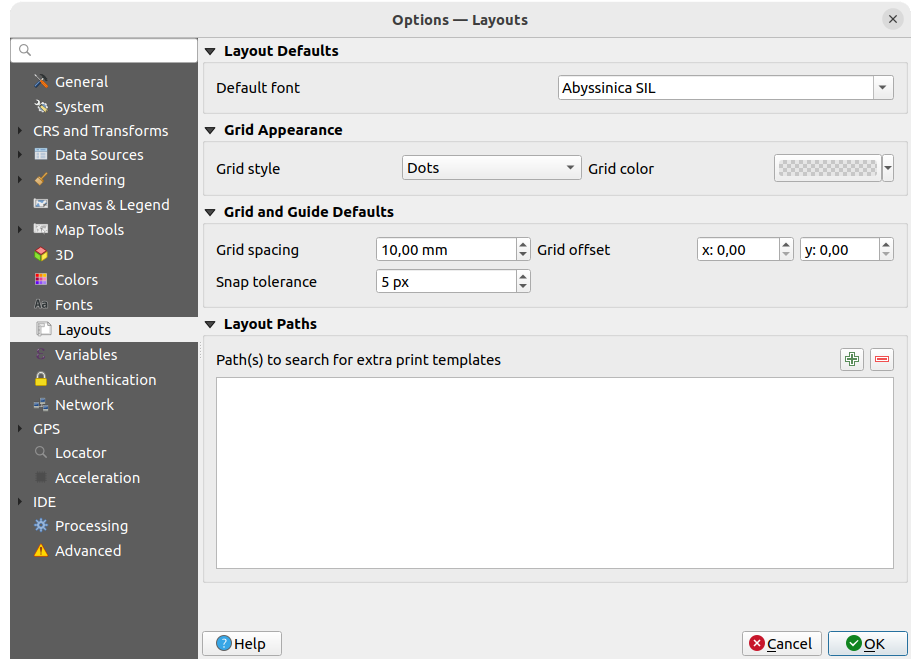
Fig. 5.20 Layouts settings
Composition defaults
You can define the Default font used within the print layout.
Grid appearance
Define the Grid style (‘Solid’, ‘Dots’, ‘Crosses’)
Define the Grid color
Grid and guide defaults
Define the Grid spacing
Define the Grid offset for X and Y
Define the Snap tolerance
Layout Paths
Define Path(s) to search for extra print templates: a list of folders with custom layout templates to use while creating new one.
5.1.14. Variables settings
The Variables tab lists all the variables available at the global-level.
It also allows the user to manage global-level variables. Click the
button to add a new custom global-level variable. Likewise, select a custom
global-level variable from the list and click the button to remove
it.
More information about variables in the Storing values in Variables section.
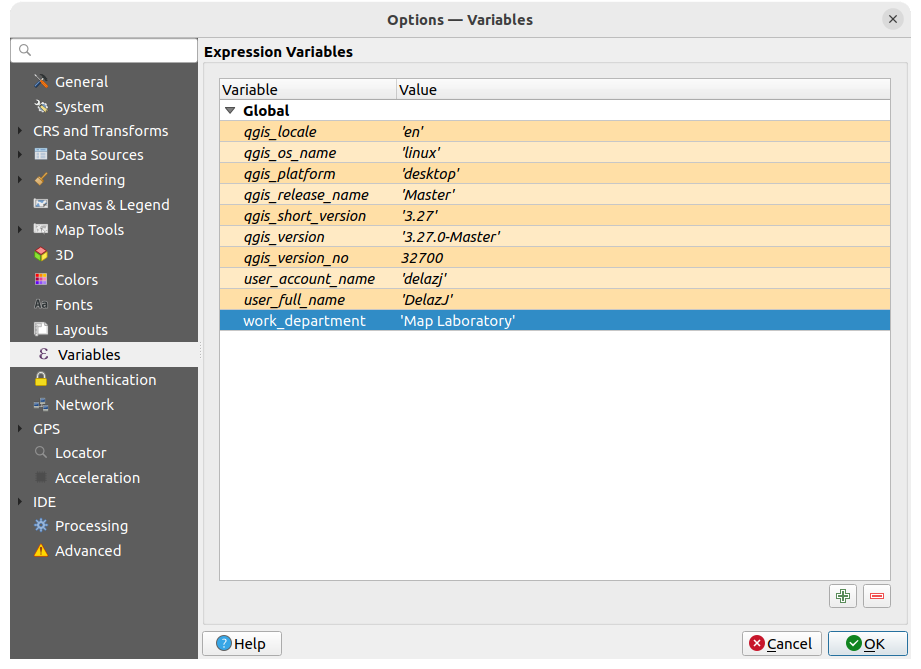
Fig. 5.21 Variables settings
5.1.15. Authentication settings
In the Authentication tab you can set authentication configurations and manage PKI certificates. See Authentication System for more details.
To manage authentications, you can use the list of tools next to the frame, ie:
- Add new authentication configuration
- Remove selected authentication configuration
 Edit selected authentication configuration

Fig. 5.22 Authentication settings
5.1.16. Network settings
General
Define Timeout for network requests (ms) - default is 60000
Define Default expiration period for WMS Capabilities (hours) - default is 24
Define Default expiration period for WMS-C/WMTS tiles (hours) - default is 24
Define Max retry in case of tile or feature request errors
Define User-Agent prefix which defaults to
Mozilla/5.0. This value will be prepended to both QGIS and OS version e.g.,Mozilla/5.0 QGIS/33801/Ubuntu 22.04.4 LTSto shape the user-agent.
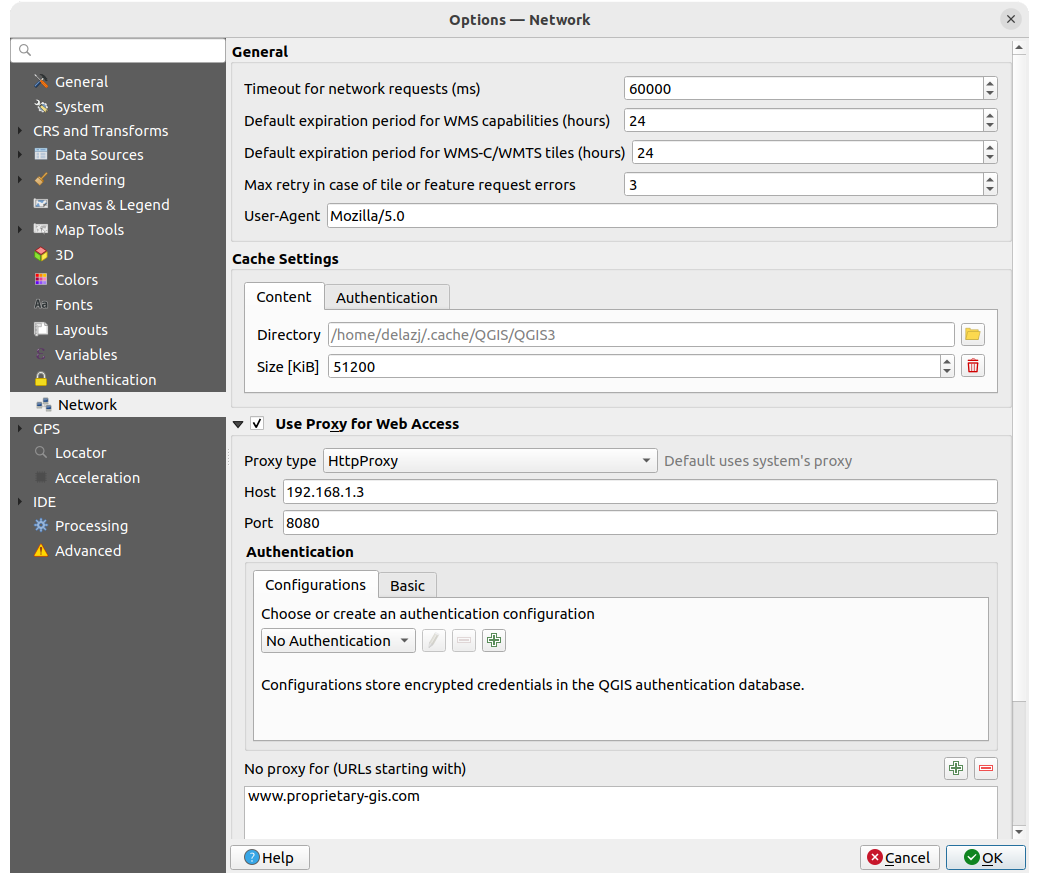
Fig. 5.23 Network and proxy settings
Cache settings
Defines the Directory and a Size for the cache specified in megabytes. You can clear the value to enable the Smart cache size, which sets the maximum cache size based on available disk space. Also offers tools to automatically clear the connection authentication cache on SSL errors (recommended).
Proxy for web access
- Use proxy for web access
Set the Proxy type
according to your needs and
define ‘Host’ and ‘Port’. Available proxy types are:: Proxy is determined based on system’s proxy
: Generic proxy for any kind of connection. Supports TCP, UDP, binding to a port (incoming connections) and authentication.
: Implemented using the “CONNECT” command, supports only outgoing TCP connections; supports authentication.
: Implemented using normal HTTP commands, it is useful only in the context of HTTP requests.
: Implemented using an FTP proxy, it is useful only in the context of FTP requests.
Credentials of proxy are set using the authentication widget.
Excluding some URLs can be added to the text box below the proxy settings (see Fig. 5.23). No proxy will be used if the target url starts with one of the string listed in this text box.
If you need more detailed information about the different proxy settings, please refer to the manual of the underlying QT library documentation at https://doc.qt.io/archives/qt-5.9/qnetworkproxy.html#ProxyType-enum
Tip
Using Proxies
Using proxies can sometimes be tricky. It is useful to proceed by ‘trial and error’ with the above proxy types, to check if they succeed in your case.
5.1.17. GPS settings
The  GPS dialog helps you configure GPS devices connections and properties in QGIS.
It also provides settings for GPS tracking and data digitizing.
GPS dialog helps you configure GPS devices connections and properties in QGIS.
It also provides settings for GPS tracking and data digitizing.
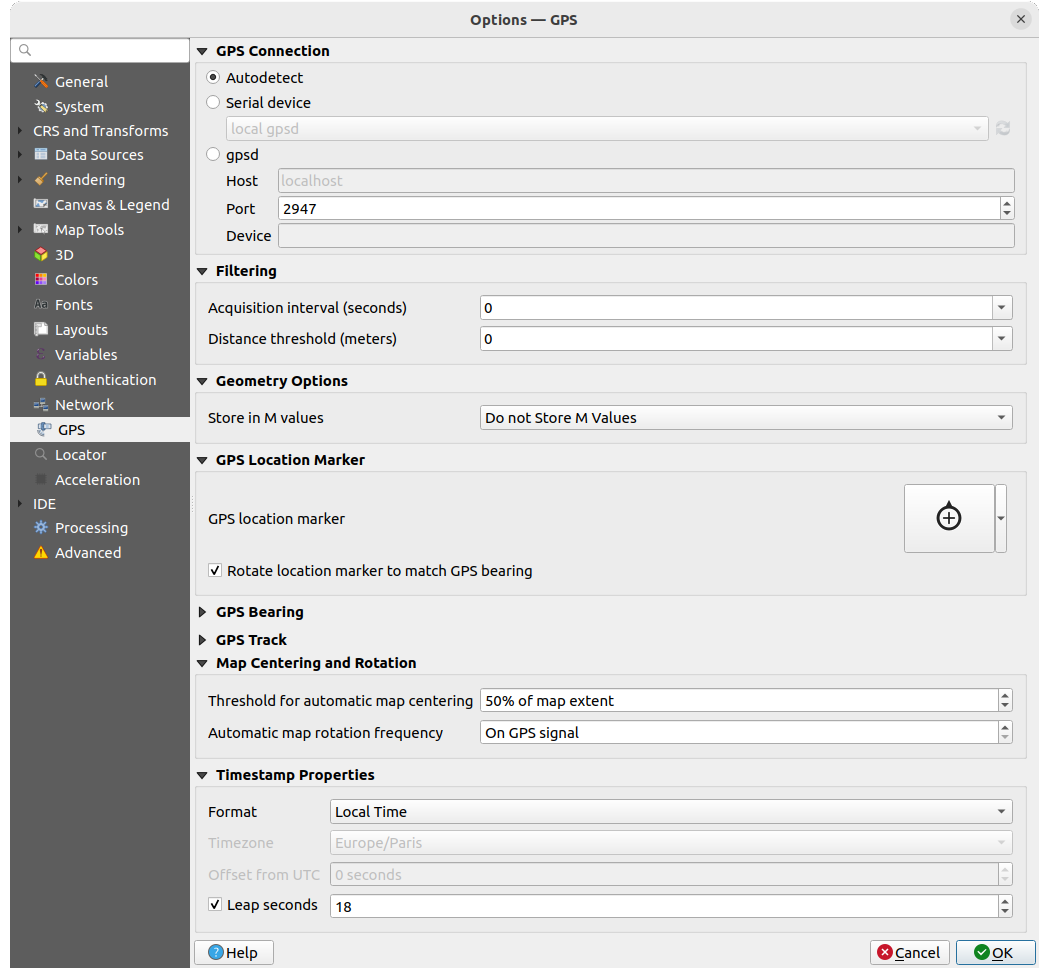
Fig. 5.24 GPS settings
You can specify:
GPS Connection: provides different means to connect the device to QGIS
- Autodetect
- Serial device (reload required if a new GPS Device is connected)
- gpsd (selecting the Host and Port
your GPS is connected to, and providing a Device name)
In case of connection problems, you can try to switch from one to another.
Filtering: You can set an Acquisition interval (seconds) and/or a Distance threshold (meters) parameters to keep the cursor still active when the receiver is in static conditions.
Under Geometry Options, the Store in M values option allows to create geometries with M values from the inbuilt GPS logging tools. This applies to both features digitized from GPS logs and from the Log to Geopackage/SpatiaLite functionality… Options include storing timestamps (as ms since epoch), ground speed, altitudes, bearings, and accuracy components as m values.
GPS Location Marker
Configure a symbol for the GPS location marker, indicating the current GPS position
- Rotate location marker to match GPS bearing:
whether the marker symbol should be rotated to match the GPS direction
GPS Bearing:
configure a Bearing line style using QGIS line symbol properties
set whether to
Calculate Bearings from travel direction:
If checked, the bearing reported by the GPS device will be ignored
and the bearing will instead be calculated by the angle between the previous two GPS locations.
GPS Track: set symbol to use for the Track line style
Map Centering and Rotation: defines when the map canvas is updated according to the user displacement on the field:
Threshold for automatic map centering: defines the minimal offset of the GPS position from the map canvas center to trigger an automatic map recentering if enabled.
Automatic map rotation frequency: defines how often the map rotation to match the GPS bearing could happen; it can be on a custom duration or On GPS signal.
Timestamp Properties to configure how time values are displayed and stored in the data. Parameters include the Format which can be:
Local time
UTC
UTC with offset, to account for daylight savings offsets or other complex time zone issues
a specific Time zone
Moreover, Leap seconds correction can be applied, by adding the seconds to GPS timestamp.
5.1.17.1. GPSBabel
GPSBabel converts waypoints, tracks, and routes between popular GPS receivers such as Garmin or Magellan and mapping programs like Google Earth or Basecamp. Literally hundreds of GPS receivers and programs are supported. QGIS relies on GPSBabel to interact with these devices and manipulate their data.
For details on how-to, please refer to Loading to or from a device.
5.1.18. Locator settings
 The Locator tab lets you configure the Locator bar, a quick search widget available on the status bar to help
you perform searches in the application.
It provides some default filters (with prefix) to use:
The Locator tab lets you configure the Locator bar, a quick search widget available on the status bar to help
you perform searches in the application.
It provides some default filters (with prefix) to use:
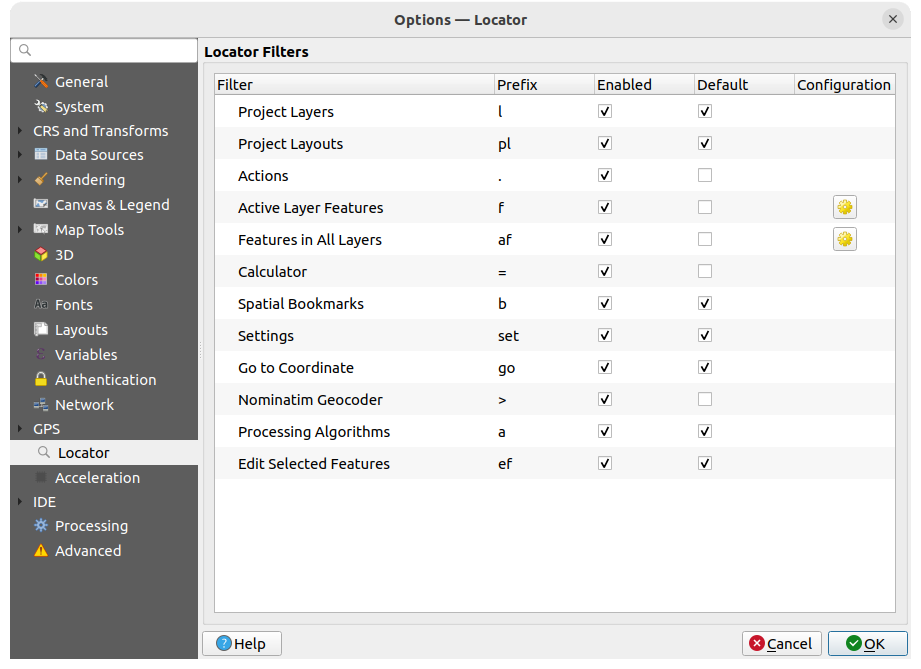
Fig. 5.25 Locator settings
Project Layers (
l): finds and selects a layer in the Layers panel.Project Layouts (
pl): finds and opens a print layout.Actions (
.): finds and executes a QGIS action; actions can be any tool or menu in QGIS, opening a panel…Active Layer Features (
f): searches for matching attributes in any field from the current active layer and zooms to the selected feature. Press to configure the maximum number of results.
Features in All Layers (
af): searches for matching attributes in the display name of each searchable layers and zooms to the selected feature. Press to configure the maximum number of results and the maximum
number of results per layer.Calculator (
=): allows evaluation of any QGIS expression and, if valid, gives an option to copy the result to the clipboard.Spatial Bookmarks (
b): finds and zooms to the bookmark extent.Settings (
set): browses and opens project and application-wide properties dialogs.Go to Coordinate (
go): pans the map canvas to a location defined by a comma or space separated pair of x and y coordinates or a formatted URL (e.g., OpenStreetMap, Leaflet, OpenLayer, Google Maps, …). The coordinate is expected in WGS 84 (epsg:4326) and/or map canvas CRS.Nominatim Geocoder (
>): geocodes using the Nominatim geocoding service of the OpenStreetMap Foundation. Press to limit results to one or more countries using list of country codes.
This helps narrow down the search to specific countries, avoiding ambiguous results from other locations.
For example, entering DEorDE,FRrestricts results to Germany or Germany and France, respectively.Processing Algorithms (
a): searches and opens a Processing algorithm dialog.Edit Selected Features (
ef): gives quick access and runs a compatible modify-in-place Processing algorithm on the active layer.
In the dialog, you can:
customize the filter Prefix, i.e., the keyword to use to trigger the filter
set whether the filter is Enabled: the filter can be used in the searches and a shortcut is available in the locator bar menu
set whether the filter is Default: a search not using a filter returns results from only the default filters categories.
Some filters provide a way to configure the number of results in a search.
The set of default locator filters can be extended by plugins, eg for OSM nominatim searches, direct database searching, layer catalog searches, …
5.1.19. Acceleration settings
OpenCL acceleration settings.
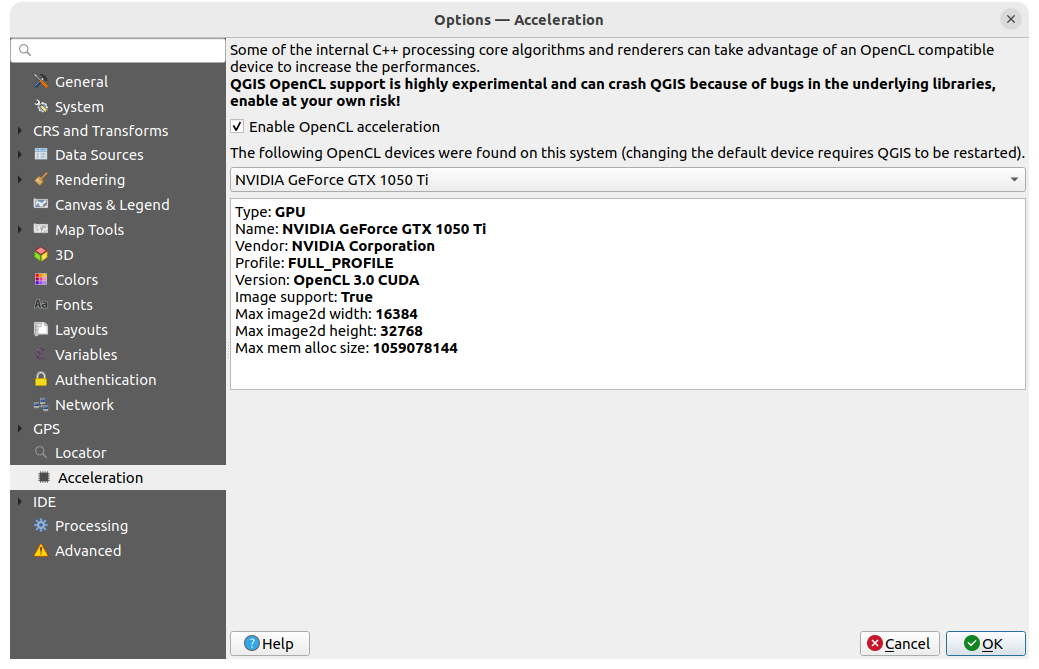
Fig. 5.26 Acceleration settings
Depending on your hardware and software, you may have to install additional libraries to enable OpenCL acceleration.
5.1.20. IDE settings
Under GitHub access token, you can generate a personal token allowing you to share code snippets from within the Python code editor. More details on GitHub authentication
5.1.20.1. Code Editor settings
In the  Code Editor tab, you can control the appearance
and behaviour of code editor widgets (Python interactive console and editor,
expression widget and function editor, …).
Code Editor tab, you can control the appearance
and behaviour of code editor widgets (Python interactive console and editor,
expression widget and function editor, …).
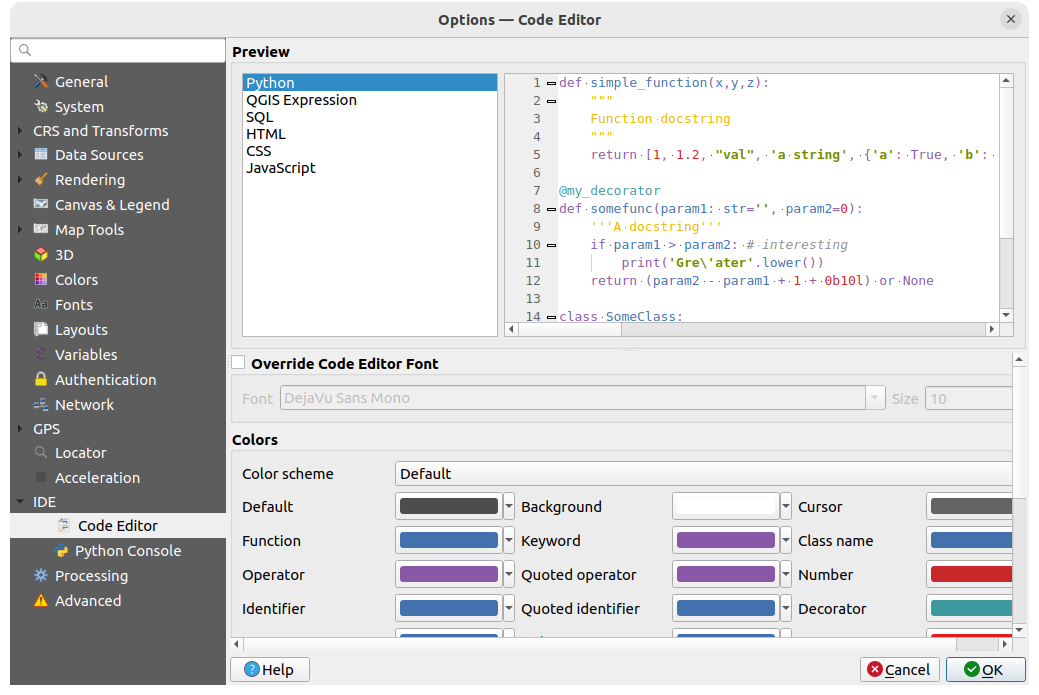
Fig. 5.27 Code Editor settings
At the top of the dialog, a widget provides a live preview of the current settings, in various coding languages (Python, QGIS expression, HTML, SQL, JavaScript). A convenient way to adjust settings.
Check
Override Code Editor Font to modify the default
Font family and Size.Under the Colors group, you can:
select a Color scheme: predefined settings are
Default,Solarized DarkandSolarized Light. ACustomscheme is triggered as soon as you modify a color and can be reset with selecting a predefined scheme.change the color of each element in code writing, such as the colors to use for comments, quotes, functions, background, …
5.1.20.2. Python settings
The  Python settings help you manage and control
the behavior of the Python editors (interactive console,
code editor, project macros,
custom expressions, …).
It can also be accessed using the Options… button from:
Python settings help you manage and control
the behavior of the Python editors (interactive console,
code editor, project macros,
custom expressions, …).
It can also be accessed using the Options… button from:
the Python console toolbar
the contextual menu of the Python console widget
and the contextual menu of the code editor.
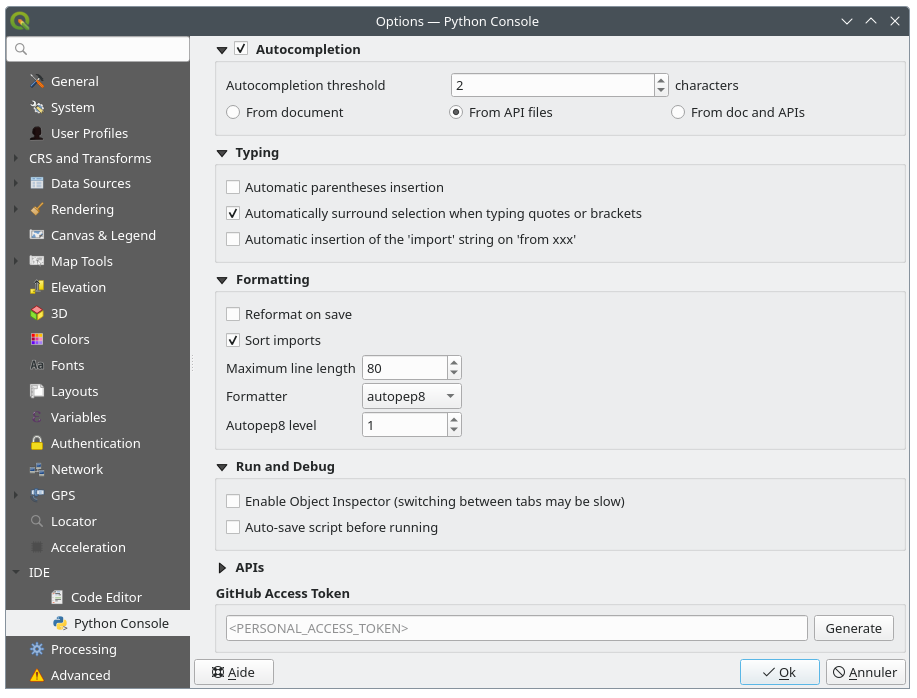
Fig. 5.28 Python settings
You can specify:
- Autocompletion: Enables code completion. You can get
autocompletion from the current document, the installed API files or both.
Autocompletion threshold: Sets the threshold for displaying the autocompletion list (in number of characters)
under Typing
- Automatic parentheses insertion:
When no text is selected, if an opening character (parentheses, quotes, brackets, …) is entered,
inserts the matching closing character just after the cursor.
Note that this behavior is disabled if the current cursor is inside a string or comment.
- Automatically surround selection when typing quotes or brackets:
When an opening character is entered, the selected text is enclosed in the opening/closing pair.
Selection remains the same, so it is possible to quote a selected word
and enclose it in parentheses just by typing
"then(.Special case for multiline selection with quotes and double quotes: selection is enclosed in triple single/double quotes.
- Automatic insertion of the ‘import’ string on ‘from xxx’:
Enables insertion of ‘import’ when specifying imports
Contextual Help (F1) provides options to control QGIS behavior when requesting help on a PyQGIS or Qt object in a Python code sample. When pressing F1, QGIS will open the API page (or a search results page) matching:
the selected text if any OR
the word at the mouse position (if
F1 works on hovered words is enabled) ORthe word at the text cursor position
This works for both Qt and PyQGIS API documentation. The page is opened either in QGIS, as an Embedded webview (developer tools), or in the Default system web browser.
under Formatting, you can add automated tools to reformat the code you are writing:
- Reformat on save: formatting is applied just before saving the script
- Sort imports: sorts ‘import’ statements using the isort library
Maximum line length: controls how the formatter will wrap the lines, and controls the editor ruler
Formatter - supported tools are autopep8 and black, with dedicated option:
Autopep8 level - more details at autopep8 advanced usage
- Normalize quotes: replaces all single quotes with double quotes if possible
under Run and Debug
- Enable Object Inspector (switching between tabs may
be slow)
- Auto-save script before running: Saves the script
automatically when executed. This action will store a temporary file (in the
temporary system directory) that will be deleted automatically after running.
Under APIs, you can specify which APIs your code should rely on:
- Using preloaded APIs file: You can choose if you would
like to use the preloaded API files. By default, supported APIs are:
Python
PyQGIS
PyQt
QScintilla2
osgeo-gdal-ogr
osgeo-geos
You can also choose to add specific API files.
- Using prepared APIs file: If checked, the chosen
*.papfile will be used for code completion. To generate a prepared API file you have to load at least one*.apifile and then compile it by clicking the Compile APIs… button.
The External Editor group allows you to provide command line instructions to launch an external Python code editor, given a file name, a line and column number. If empty, the default system editor will be used.
5.1.21. Processing settings
The  Processing tab provides you with general settings
of tools and data providers that are used in the QGIS Processing framework.
More information at Configuring the Processing Framework.
Processing tab provides you with general settings
of tools and data providers that are used in the QGIS Processing framework.
More information at Configuring the Processing Framework.
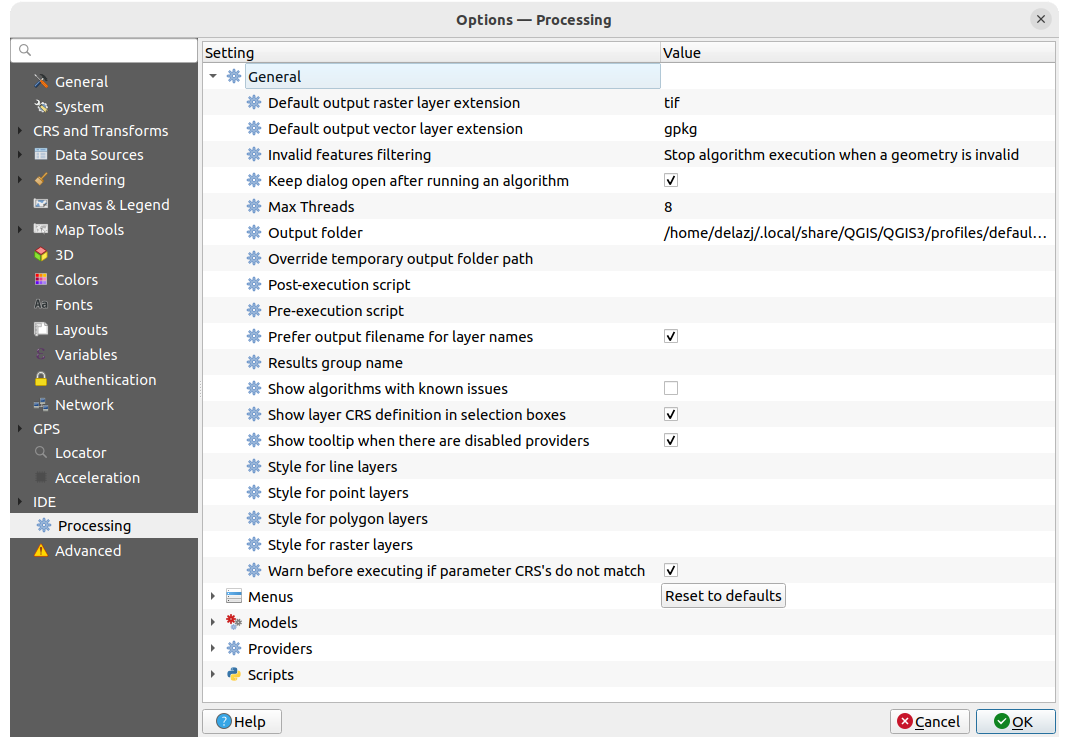
Fig. 5.29 Processing settings
5.1.22. Advanced settings
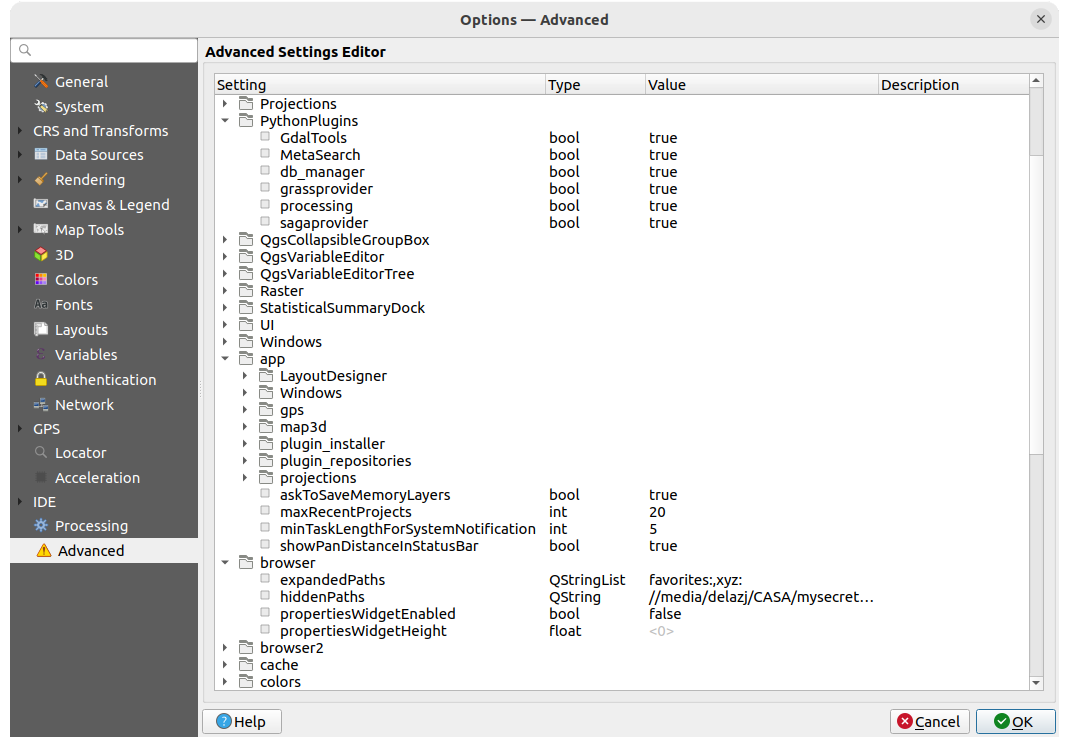
Fig. 5.30 Advanced settings
All the settings related to QGIS (UI, tools, data providers, Processing
configurations, default values and paths, plugins options, expressions,
geometry checks…) are saved in a QGIS/QGIS3.ini file under the active
user profile directory.
Configurations can be shared by copying this file to other installations.
From within QGIS, the Advanced tab offers a way to manage these
settings through the Advanced Settings Editor.
After you promise to be careful, the widget is populated with a tree of all
the existing settings, and you can edit their value.
Right-click over a setting or a group and you can delete it
(to add a setting or group, you have to edit the QGIS3.ini file).
Changes are automatically saved in the QGIS3.ini file.
Warning
Avoid using the Advanced tab settings blindly
Be careful while modifying items in this dialog given that changes are automatically applied. Doing changes without knowledge can break your QGIS installation in various ways.
5.2. Working with User Profiles
5.2.1. The concept
The menu provides functions to set and access user profiles. A user profile is a unified application configuration that allows to store in a single folder:
all the global settings, including locale, projections, authentication settings, color palettes, shortcuts…
GUI configurations and customization
grid files and other proj helper files installed for datum transformation
installed plugins and their configurations
project templates and history of saved project with their image preview
processing settings, logs, scripts, models.
By default, a QGIS installation contains a single user profile named default.
But you can create as many user profiles as you want:
Click the entry.
You’ll be prompted to provide a profile name, creating a folder of the same name under
~/<UserProfiles>/where:~represents the HOME directory, which on Windows is usually
something like
Windows is usually
something like C:\Users\<username>.and
<UserProfiles>represents the main profiles folder, i.e.:
.local/share/QGIS/QGIS3/profiles/-
%AppData%\Roaming\QGIS\QGIS3\profiles\ 
Library/Application Support/QGIS/QGIS3/profiles/
The user profile folder can be opened from within QGIS using the Open Active Profile Folder.
A new instance of QGIS is started, using a clean configuration. You can then set your custom configurations.
If you have more than one profile in your QGIS installation, the name of the active profile is shown in the application title bar between square brackets.
As each user profile contains isolated settings, plugins and history they can be great for different workflows, demos, users of the same machine, or testing settings, etc. And you can switch from one to the other by selecting them in the menu. You can also run QGIS with a specific user profile from the command line.
Tip
Run QGIS under a new user profile to check for bug persistence
Bugs you may encounter with functions in QGIS can be related to leftovers in the current user profile. Running QGIS under another user profile can help you solve them or check the origin of the issue. The general advice is to launch QGIS under a new user profile, thus a cleaner configuration, and run the commands again.
If the bug prevents you to create a new user profile from within the menu, you can either:
Rename in the file explorer, the “broken” user profile folder in the
QGIS3/profilesfolder and restart QGIS. A newdefaultuser profile will be created and executed.Start QGIS from the command line, using the new profile name argument:
qgis-ltr --profile newprofilename
5.2.2. Setting user profile
By default, QGIS opens a new session with the profile of the last closed session.
This, among other settings, can be customized in
 tab:
tab:
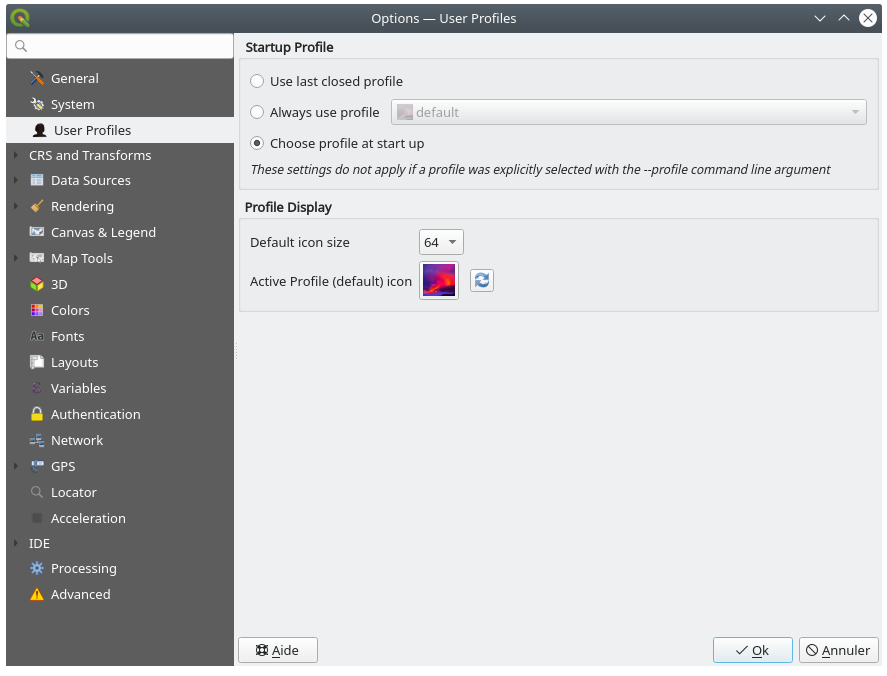
Fig. 5.31 User profiles settings
Startup profile: indicates the user profile to use when starting a QGIS session. It can be:
Use last closed profile
a specific user profile to select from Always use profile drop-down menu
Choose profile at start up: Opens the User Profile Selector dialog listing available user profiles. Double-click an entry or select a profile and press OK to use that user profile for the starting session. It is also possible to
Add new profile to the list:
a profile is created from scratch and automatically run with the opening session.
Under Profile display, you can set:
The size of icons to use when selecting a profile from the User Profile Selector dialog.
A specific icon to display next to the current profile in the menu or the User Profile Selector dialog. Press
 Reset profile icon to remove custom modifications.
5.3. Project Properties
In the properties window for the project under , you can set project-specific options. The project-specific options overwrite their equivalent in the Options dialog described above.
5.3.1. General Properties
In the  General tab, the General settings let you:
see the location of the project file
set the folder for the project home (available in the Project home item of the Browser panel). The path can be relative to the folder of the project file (type it in) or absolute. The project home can be used for storing data and other content that is useful for the project. Convenient when dataset and project files are not stored at the same place. If not filled, the Project home defaults to the project file folder.
give a title to the project beside the project file path
choose the color to use for features when they are selected
choose the background color: the color to use for the map canvas
set whether the path to layers in the project should be saved as absolute (full) or as relative to the project file location. You may prefer relative path when both layers and project files can be moved or shared or if the project is accessed from computers on different platforms.
choose to avoid artifacts when project is rendered as map tiles. Note that checking this option can lead to performance degradation.
Remember attribute tables windows and docks between sessions: If checked for a project, then any opened attribute tables will be saved into the project and immediately restored when loading that project. This can improve workflows when you constructed a project with a particular set of attribute table configurations for your requirements, and re-setting up these attribute tables is a hassle.
Calculating areas and distances is a common need in GIS. However, these values are really tied to the underlying projection settings. The Measurements frame lets you control these parameters. You can indeed choose:
the Ellipsoid, on which distance, area and angle calculations are entirely based; it can be:
None/Planimetric: returned values are in this case cartesian measurements. This option can be set as default for new projects from the
menua Custom one: you’ll need to set values of the semi-major and semi-minor axes.
or an existing one from a predefined list (Clarke 1866, Clarke 1880 IGN, New International 1967, WGS 84…).
the Units for distance measurements for length and perimeter, and the Units for area measurements. These settings default to their corresponding global options and can be manually changed for the current project. They are used in:
Attribute table field update bar
Field calculator calculations
Identify tool derived length, perimeter and area values
Note
To ensure measurement units (for distance and area) always reflect the units of the current project’s CRS, select Map Units for these options.
the Scale calculation method: when working on large map extents, especially with geographic CRS, the scale bar may not reflect actual distance measurement depending on the latitude at which the calculation is done. This setting helps you define the area you want the calculation to be taken from:
Average top, middle and bottom scales
Calculate along top of map
Calculate along middle of map (the default)
Calculate along bottom of map
Always calculate at equator, regardless of the actual visible map extent. It can be used to provide a consistent, static scale for maps in geographic reference systems, regardless of the latitudes actually visible in the map (permitting consistent appearance of these maps when rendering relies on scale based visibility or calculations). Otherwise a project in e.g.
EPSG:4326which uses scale based visibility of layers and symbols will see layers and features “randomly” disappear as the map is panned, even though you have not zoomed in or out of the map.Note
This method is only applicable when calculating scales with a degree based reference system, and while it ensures that the scale remains constant and does not change as the map is panned, it will calculate misleading scales when the map extent is not close to the equator.
Changing the scale calculation method has the following impacts:
New layout scale bars will default to the project’s scale calculation method
The scale calculations for the status bar widget and map renders will be changed (including flow on impacts like the value of
@map_scalevariable, scale based visibility of layers and symbols)This also affects QGIS server map rendering
Processing algorithms which render maps will respect the project’s scale calculation method
Note
Symbology sizes in map units are NOT affected by this setting.
The Coordinate and Bearing display allows you to customize the display of:
the coordinates shown in the Coordinates box on QGIS status bar and in the Derived section of the
Identify
features tool’s resultsthe bearing value displayed in the status bar for the map canvas panning direction and by the
Measure bearing tool.
Available parameters are:
Display coordinates using either:
Map Units, based on the project CRSMap Geographic (degrees): based on the project CRS if it is of geographic type, otherwise uses its associated geographic CRS. This is helpful e.g., for non-earth celestial bodies.or
Custom Projection Units: allows to rely on any CRS you desire for coordinates display
In the Coordinate CRS option, you can view or define the CRS to use depending on your display mode.
Coordinate format: you can configure it as
Decimal Degrees,Degrees, MinutesorDegrees, Minutes, Seconds, and whether it should display:- Show directional suffix
- Show leading zeros for minutes and seconds
- Show leading zeros for degrees
- Show trailing zeros
Coordinate precision: the number of decimal places can be automatic (derived from the type of CRS) or set manually
Coordinate order: you can opt to display the coordinates in the native order of the CRS (
Default) or switch it to eitherEasting, Northing (Longitude, Latitude)orNorthing, Easting (Latitude, Longitude)orderBearing format possible values are
0 to 180°, with E/W suffix,-180 to +180°or0 to 360°. The number of Decimal places as well as whether to Show trailing zeros can be set.
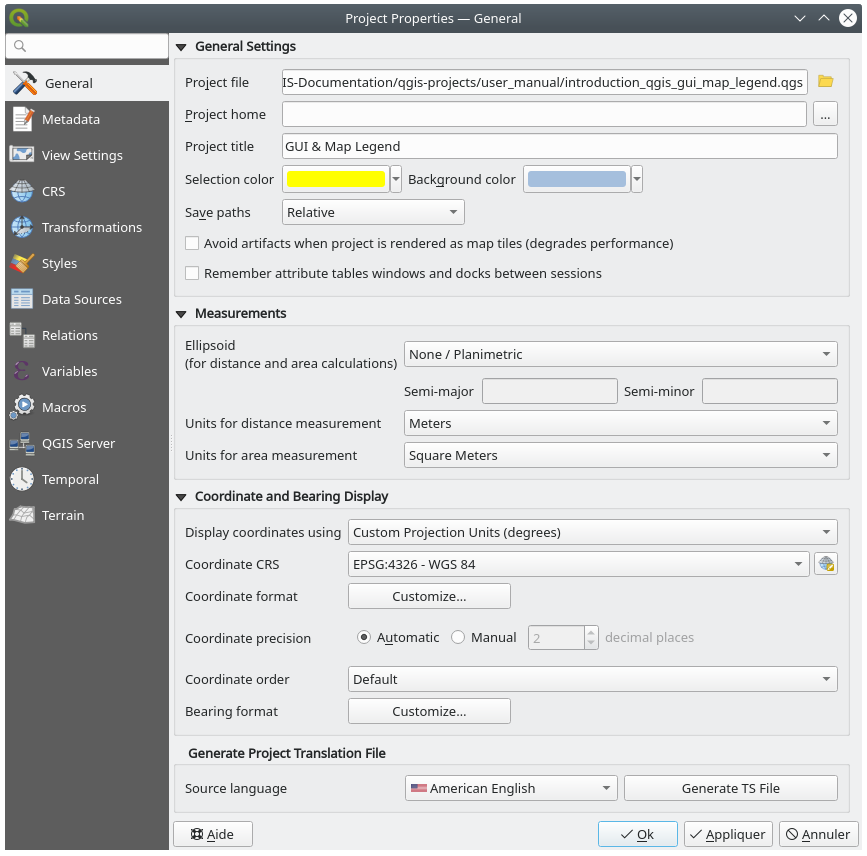
Fig. 5.32 General tab of the Project Properties dialog
5.3.2. Metadata Properties
The  Metadata tab provides you with options
to create and edit a metadata report on your project.
See Metadata for more information.
Metadata tab provides you with options
to create and edit a metadata report on your project.
See Metadata for more information.
5.3.3. View Settings
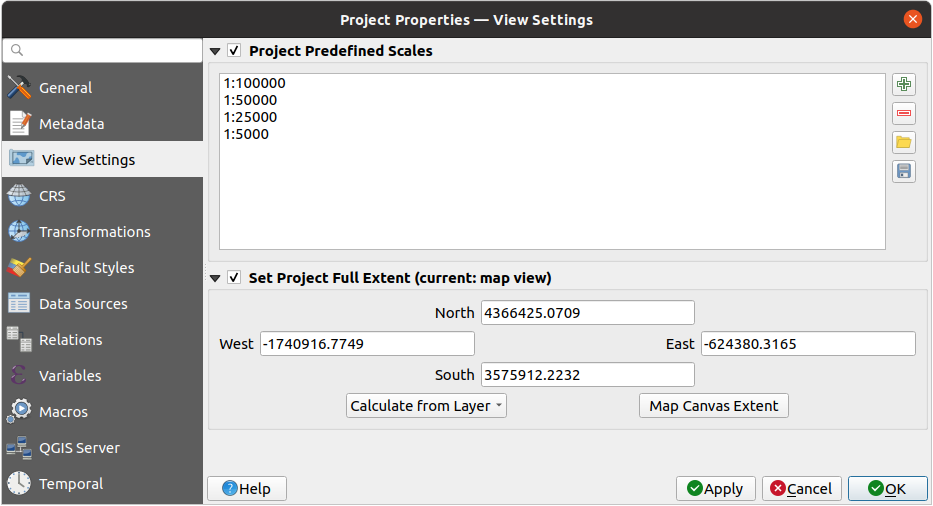
Fig. 5.33 View Settings tab of the Project Properties dialog
The  View Settings tab provides means to control
the project map canvas. You can:
View Settings tab provides means to control
the project map canvas. You can:
set Project predefined scales: the list of scales to display in scale-related drop-down widgets, such as the status bar Scale, the visibility scales selector or secondary 2D map view settings,… in replacement of the global predefined scales.
Set Project full Extent: this extent will be used instead of the extent of all layers when zooming to full map extent (
 ).
It’s useful when a project contains web layers/national layers/global layers
yet the actual area of interest for the project is a smaller geographic area.
The project full extent coordinates can be set with the extent selector widget.
).
It’s useful when a project contains web layers/national layers/global layers
yet the actual area of interest for the project is a smaller geographic area.
The project full extent coordinates can be set with the extent selector widget.
5.3.4. CRS Properties
Note
For more information on how QGIS handles project projection, please read the dedicated section at Working with Projections.
The CRS tab helps you set the coordinate reference system
to use in this project. It can be:
- No CRS (or unknown/non-Earth projection):
layers are drawn based on their raw coordinates
or an existing coordinate reference system that can be geographic, projected or user-defined. Layers added to the project are translated on-the-fly to this CRS in order to overlay them regardless their original CRS.
5.3.5. Transformations Properties
The Transformations tab helps you control the
layers reprojection settings by configuring the datum transformation preferences
to apply in the current project. As usual, these override any corresponding
global settings. See Datum Transformations for more details.
5.3.6. Styles Properties
Under  Styles tab, you can configure symbols and colors
inherent to the project, allowing to safely share the project among different
machines.
Styles tab, you can configure symbols and colors
inherent to the project, allowing to safely share the project among different
machines.
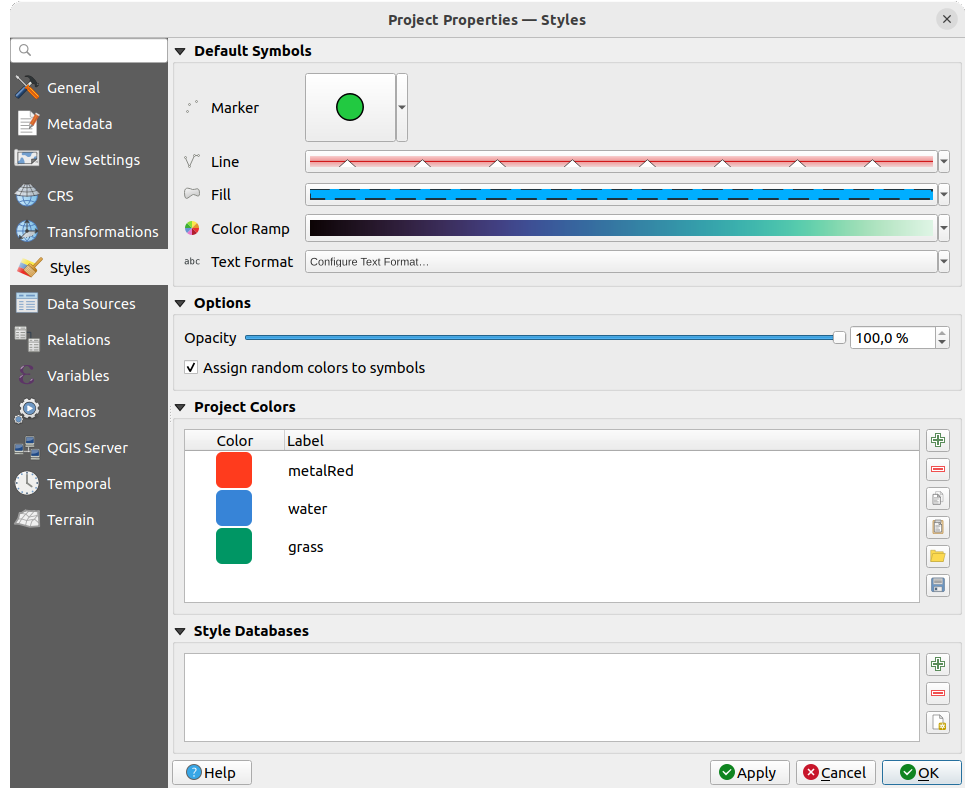
Fig. 5.34 Styles tab
5.3.6.1. Default symbols
The Default Symbols group lets you control how new layers will
be drawn in the project when they do not have an existing .qml style
defined. You can set Marker, Line, Fill to
apply depending on the layer geometry type as well as default Color
Ramp and Text Format (e.g., when enabling labeling).
Any of these items can be reset using the Clear entry from
the corresponding drop-down widget.
5.3.6.2. Symbol options
In the Symbol options group, you can:
Apply a default Opacity to new layers
- Assign random colors to symbols, modifying the symbols
fill colors, hence avoiding same rendering for all layers.
5.3.6.3. Style Database
A style database in QGIS is a structured repository designed to store symbols, text formats, and other styling elements. It serves as a centralized location where you can organize and manage your symbology resources efficiently. You can create a dedicated style database for a specific client, housing symbols tailored to that client’s need. This ensures a clean and organized approach, without cluttering the default style database. In multi-user environments, it’s possible to store project-specific styles in a shared location. By linking a project to these styles, all users within the project gain access to common symbology, eliminating the need for manual import or updates to individual local style database. Storing symbols in a project file offers a practical solution, preventing users from overcrowding their global style database with project-specific symbology. This approach guarantees that other users working on the same project immediately have access to all the necessary symbology upon loading the project.
In the Style Database section you can choose to
Add or Remove
style database or you can  Create new style database.
When you add or remove a style database in this section, the changes will
be automatically reflected in the Symbology Properties.
Create new style database.
When you add or remove a style database in this section, the changes will
be automatically reflected in the Symbology Properties.
5.3.7. Colors properties
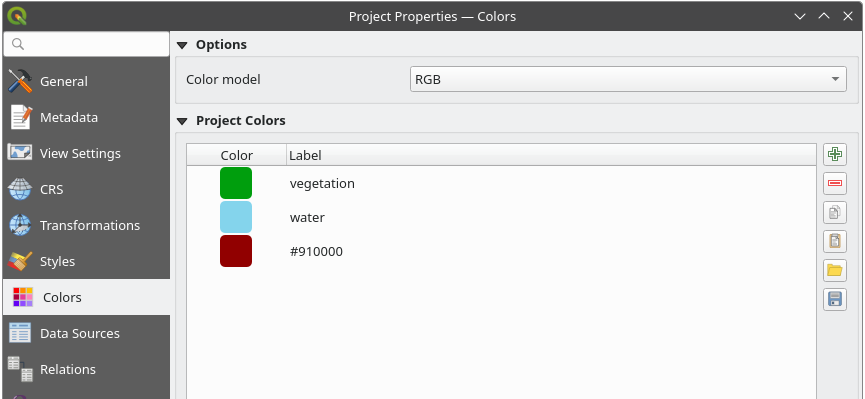
Fig. 5.35 Colors tab
In the  Colors tab, you can select the Color model,
i.e., whether selecting a color should by default be defined as
Colors tab, you can select the Color model,
i.e., whether selecting a color should by default be defined as RGB or CMYK.
Any color defined in a different color model than the one specified here
will be converted to this color model when exporting a layout.
Additionally, an option is available for selecting an ICC Profile
which allows you to Load a specific ICC profile that defines the color space
for your project. After you load the ICC profile, you can choose to Save ICC Profile
to a file on disk or to  Remove selected ICC Profile.
Once applied, QGIS will enforce the selected color model to ensure
consistent color representation.
Remove selected ICC Profile.
Once applied, QGIS will enforce the selected color model to ensure
consistent color representation.
Note
Note that the ICC Profile option will only be visible if QGIS is built with Qt 6.8.0 or higher.
There is also an additional section where you can define specific colors for the running project. Like the global colors, you can:
- Add or Remove color
- Copy or Paste color
- Import or Export the set of colors
from/to
.gplfile.
Double-click a color in the list to tweak or replace it in the Color Selector dialog. You can also rename it by double-clicking in the Label column.
These colors are identified as Project colors and listed as part of color widgets.
Tip
Use project colors to quickly assign and update color widgets
Project colors can be referred to using their label and the color widgets they are used in are bound to them. This means that instead of repeatedly setting the same color for many properties and, to avoid a cumbersome update you can:
Define the color as a project color
Click the data defined override widget next to the color property you want to set
Hover over the Color menu and select the project color. The property is then assigned the expression
project_color('color_label')and the color widget reflects that color.Repeat steps 2 and 3 as much as needed
Update the project color once and the change is reflected EVERYWHERE it’s in use.
5.3.8. Data Sources Properties
In the  Data Sources tab, you can:
Transaction mode, defines how edits are sent to the data provider:
Local Edit Buffer: edits are buffered locally and sent to the provider when toggling layer editing mode or clicking Save edits.
Automatic Transaction Groups: on supported datasources (postgres and geopackage databases) the edit state of all tables that originate from the same database are synchronized and executed in a server side transaction. Also, instead of buffering edit changes locally, they are directly sent to a transaction in the database which gets committed when toggling layer editing mode or clicking Save edits.
Buffered Transaction Groups: all editable layers, disregarding from which provider, are toggled synchronously and all edits are saved in a local edit buffer. Saving changes is executed within a single transaction on all layers (per provider).
Note that you can change this option only if no layer is being edited in the project.
- Evaluate default values on provider side: When adding
new features in a PostgreSQL table, fields with default value constraint are
evaluated and populated at the form opening, and not at the commit moment.
This means that instead of an expression like
nextval('serial'), the field in the Add Feature form will display expected value (e.g.,25). - Remember editable layer status between sessions:
makes sure that all layers that are editable
in a project will be remembered as such when saving the project, as well as
making sure that those layers are immediately made editable whenever the project
is restored.
Configure the Layers Capabilities, i.e.:
Set (or disable) which layers are
identifiable, i.e., will respond to the identify tool. By default, layers are set queryable.Set whether a layer should appear as
read-only, meaning that it can not be edited by the user, regardless of the data provider’s capabilities. Although this is a weak protection, it remains a quick and handy configuration to avoid end-users modifying data when working with file-based layers.Define which layers are
searchable, i.e., could be queried using the locator widget. By default, layers are set searchable.Define which layers are defined as
required. Checked layers in this list are protected from inadvertent removal from the project.Define which layers are
private, i.e., hidden from the Layers panel. This is meant for accessory layers (basemap, join, lookups for value-relations, most probably aspatial layers, …) that you still need in a project but you don’t want them to pollute the legend tree and other layer selection tools. If set visible, they are still displayed in the map canvas and rendered in the print layout legend. Use the option in the
Layers panel top toolbar to temporarily turned them on
for any interaction.
option in the
Layers panel top toolbar to temporarily turned them on
for any interaction.
The Layers Capabilities table provides some convenient tools to:
Select multiple cells and press Toggle Selection to have them change their checkbox state;
- Show spatial layers only, filtering out non-spatial
layers from the layers list;
- Filter layers… and quickly find a particular layer to
configure.
Under the Advanced Settings group, you can select
Trust project when data source has no metadata:
To speed up project loading by skipping data checks. Useful in QGIS Server context
or in projects with huge database views/materialized views. The extent of layers
will be read from the QGIS project file (instead of data sources) and when
using the PostgreSQL provider the primary key unicity will not be
checked for views and materialized views.
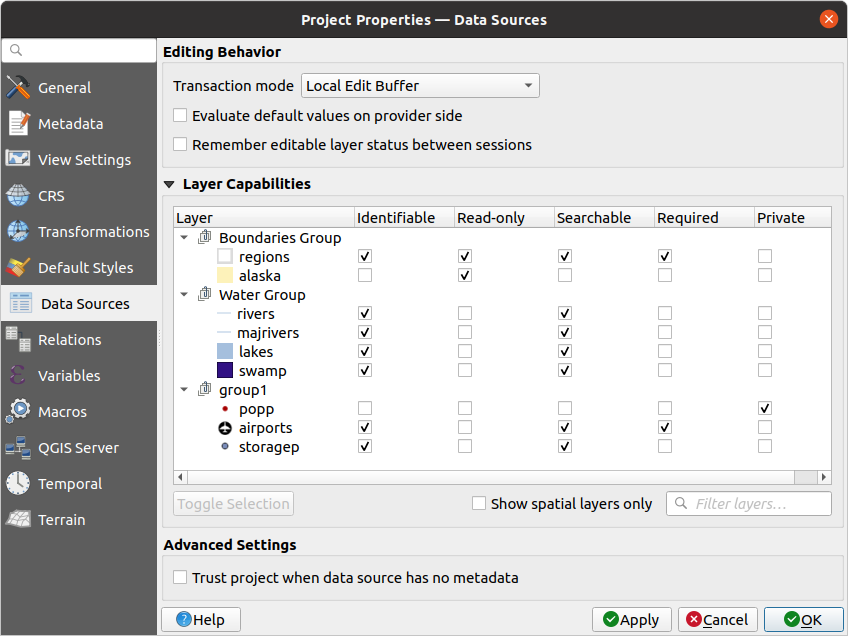
Fig. 5.36 Data Sources tab
5.3.9. Relations Properties
The  Relations tab is used to define relations between layers.
The relations can be of one to one, many to many or polymorphic type.
They are defined in the project properties dialog.
Once relations exist for a layer, a new user interface element in the form view
(e.g., when identifying a feature and opening its form) will list the related entities.
This provides a powerful way to express e.g., the inspection history on a length of pipeline or road segment.
You can find out more about relations support in section Setting relations between multiple layers.
Relations tab is used to define relations between layers.
The relations can be of one to one, many to many or polymorphic type.
They are defined in the project properties dialog.
Once relations exist for a layer, a new user interface element in the form view
(e.g., when identifying a feature and opening its form) will list the related entities.
This provides a powerful way to express e.g., the inspection history on a length of pipeline or road segment.
You can find out more about relations support in section Setting relations between multiple layers.
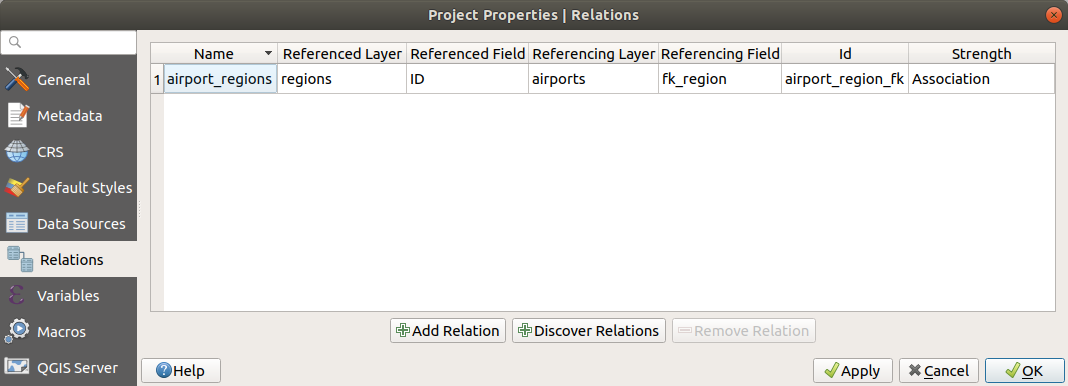
Fig. 5.37 Relations tab
5.3.10. Variables Properties
The  Variables tab lists all the variables available at
the project’s level (which includes all global variables). Besides, it
also allows the user to manage project-level variables. Click the
button to add a new custom project-level variable. Likewise, select a custom
project-level variable from the list and click the button to
remove it.
More information on variables usage in the General Tools
Storing values in Variables section.
Variables tab lists all the variables available at
the project’s level (which includes all global variables). Besides, it
also allows the user to manage project-level variables. Click the
button to add a new custom project-level variable. Likewise, select a custom
project-level variable from the list and click the button to
remove it.
More information on variables usage in the General Tools
Storing values in Variables section.
5.3.11. Macros Properties
The  Macros tab is used to edit Python macros for projects.
Currently, only three macros are available:
Macros tab is used to edit Python macros for projects.
Currently, only three macros are available: openProject(), saveProject()
and closeProject().
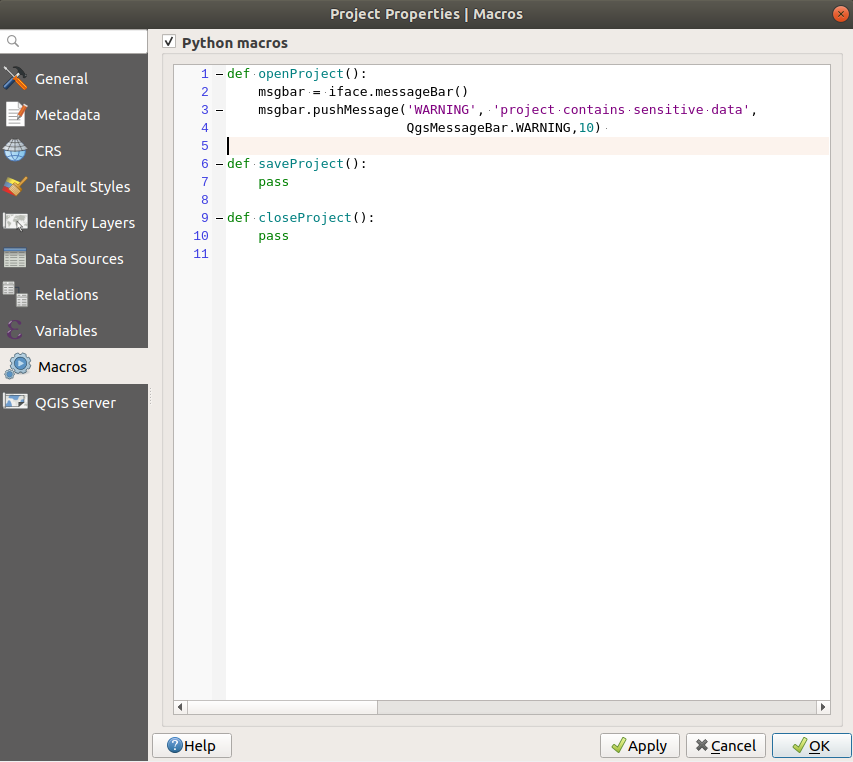
Fig. 5.38 Macro settings
5.3.12. QGIS Server Properties
The QGIS Server tab allows you to configure your project
in order to publish it online. Here you can define information about the QGIS
Server WMS and WFS capabilities, extent and CRS restrictions. More information
available in section Configure your project and subsequent.
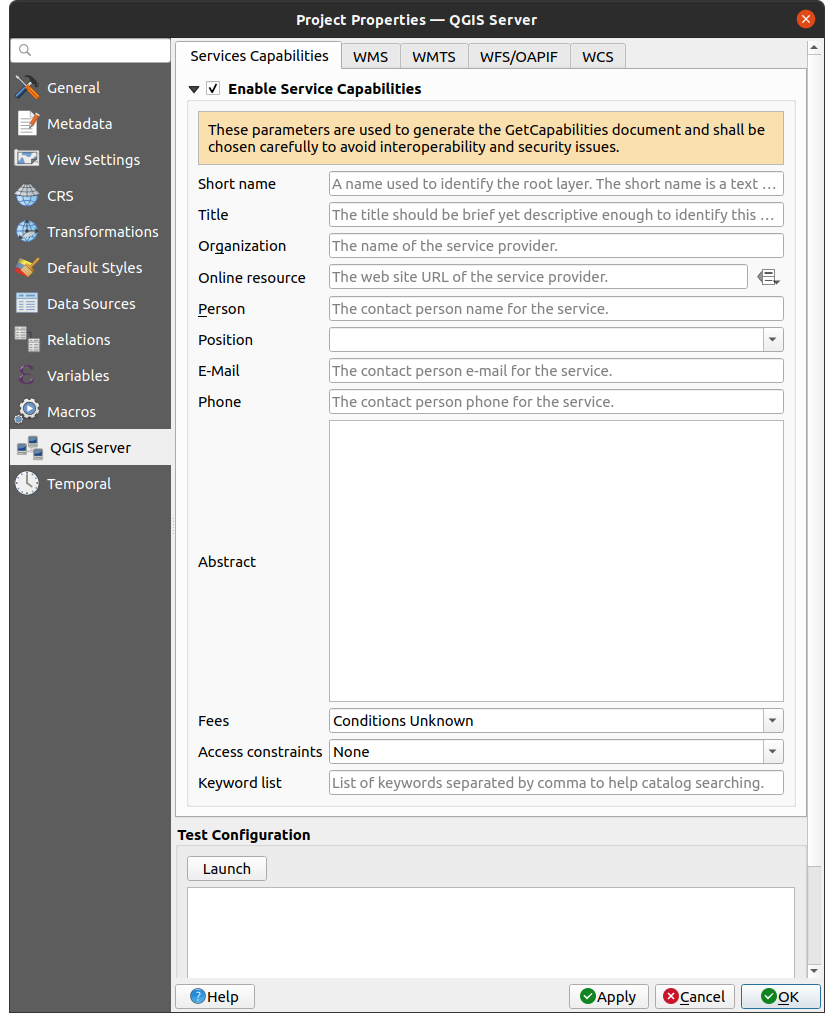
Fig. 5.39 QGIS Server settings
5.3.13. Temporal Properties
The  Temporal tab is used to set the temporal range of your project,
either by using manual Start date and End date inputs
or by calculating it from the current project temporal layers.
The project time range can then be used in the Temporal controller
panel to manage the map canvas temporal navigation.
Temporal tab is used to set the temporal range of your project,
either by using manual Start date and End date inputs
or by calculating it from the current project temporal layers.
The project time range can then be used in the Temporal controller
panel to manage the map canvas temporal navigation.
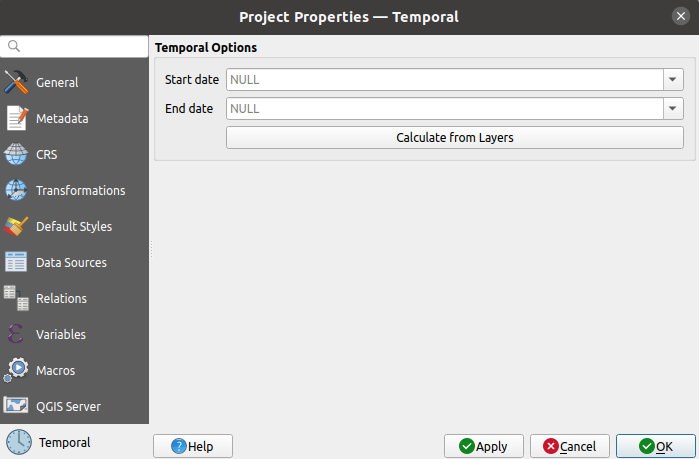
Fig. 5.40 Project Temporal tab
5.3.14. Elevation Properties
The  Elevation tab helps you configure default settings
for the terrain and elevation.
When any new 3d map is created in the project,
the map will default to using the same terrain settings as are defined for the project.
The project elevation settings will also be respected
by the elevation profile tool.
Elevation tab helps you configure default settings
for the terrain and elevation.
When any new 3d map is created in the project,
the map will default to using the same terrain settings as are defined for the project.
The project elevation settings will also be respected
by the elevation profile tool.
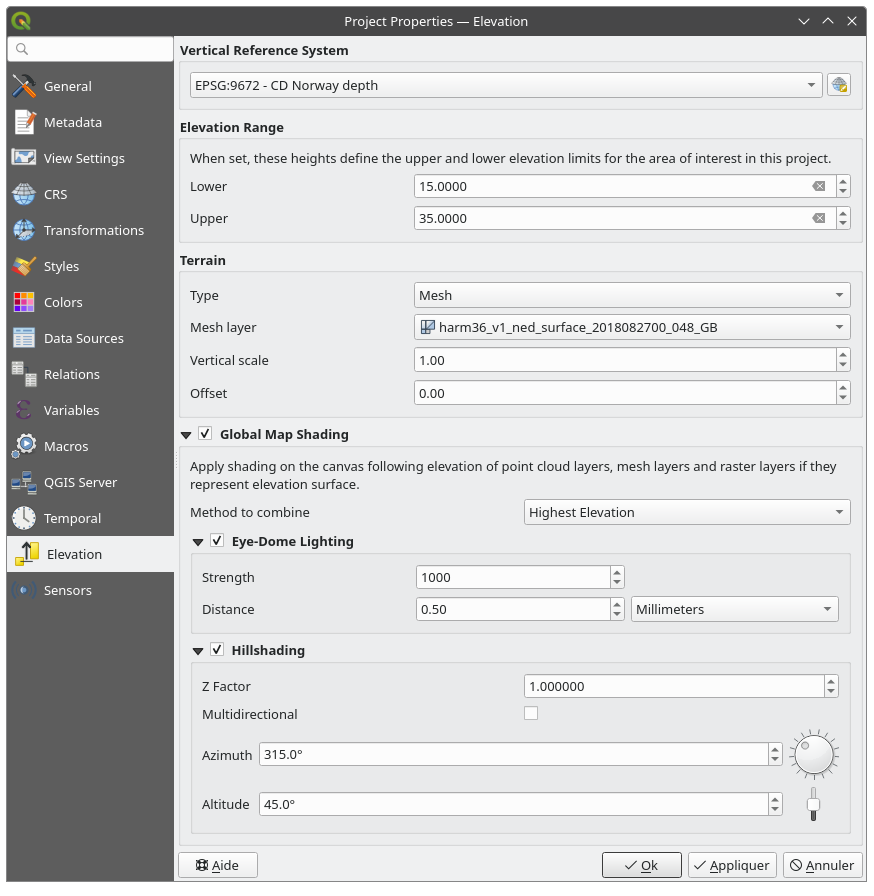
Fig. 5.41 Project Elevation tab
Vertical Reference System: If the CRS of your project is compound one (including a Z dimension), then the vertical CRS used for the project will be the vertical component of the project CRS. If your project CRS is horizontal, then you can select a specific vertical CRS by clicking on the
 Select CRS.
Elevation Range: helps you define the Lower and Upper limits for the elevation controller in the project.
Terrain and elevation options are available for:
Flat terrain with Terrain height setting
DEM (Raster Layer): with setting for defining the Raster layer, a Vertical scale factor to apply to band values and a vertical Offset
Mesh: with setting for defining the Mesh layer, a Vertical scale factor to apply to vertices Z value and a vertical Offset
These settings can be overwritten from the 3D map configuration dialog.
With
Global map shading settings, you apply a global shading effect to the map,
based on the elevation of all the active layers that have elevation properties enabled, including:Method to combine: the elevation value at any particular position for all the relevant layers are combined, and the considered elevation is chosen depending on one of these methods:
Highest elevation value
Based on layer’s order: the elevation on the topmost layer in the layer tree is considered.
Supported shading options are:
- Eye-dome lighting: applies shading effects to the map canvas for a better depth rendering.
Following parameters can be controlled:
Strength: increases the contrast, allowing for better depth perception
Distance: represents the distance of the used pixels off the center pixel and has the effect of making edges thicker.
- Hillshading, shaping some reliefs on the map using shading (levels of gray):
Z Factor: Scaling factor for the elevation value
- Multidirectional: Specify if multidirectional hillshading is to be used
Azimuth: The azimuth of the light source
Altitude: The elevation angle of the light source
Note
A shortcut to Global map shading properties is available through the Layer Styling panel.
5.3.15. Sensors Properties
The  Sensors tab is used to configure sensors and toggle
their connection status. When active, sensors will passively collect data in
the background and make available their latest data to expressions and
python scripts.
Sensors tab is used to configure sensors and toggle
their connection status. When active, sensors will passively collect data in
the background and make available their latest data to expressions and
python scripts.
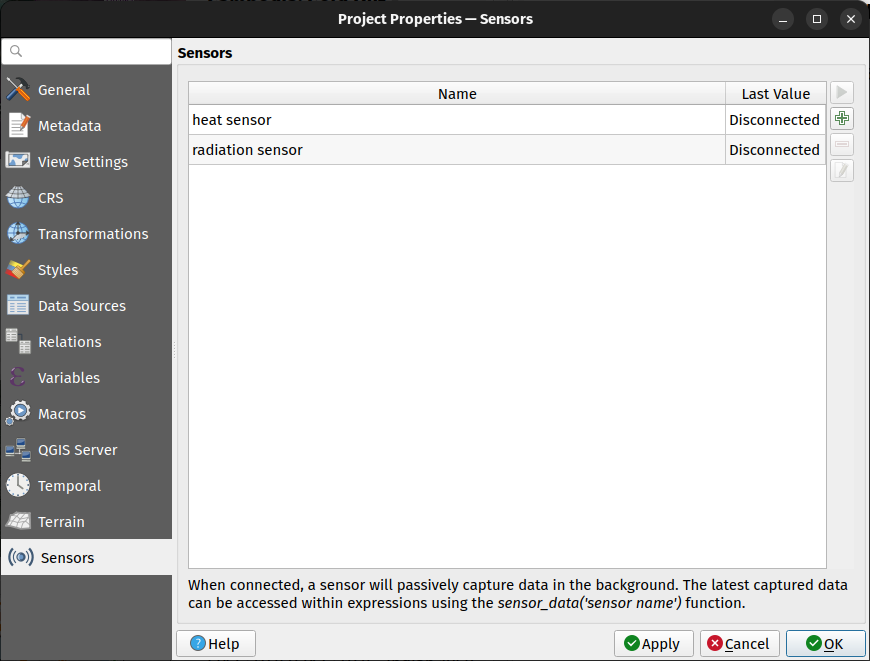
Fig. 5.42 Project Sensors tab
To add a new sensor, click on the button. A settings sub-panel
will open and allow you to configure:
the Sensor name: used to retrieve sensor values in expressions and python scripts;
the Sensor type: TCP, UDP, serial port, etc.; and
additional type-specific details (e.g., host name and port).
For serial port sensors, comboboxes with the system’s available serial ports and connection baud rate are available for their selection. A Data frame delimiter can be used to parse returned data. In case multiple data frames are found in the last chunk of data pushed by the serial port, all the data frames are returned. You can then use an expression to further split the returned sensor last data value into individual frames (e.g., using string_to_array function).
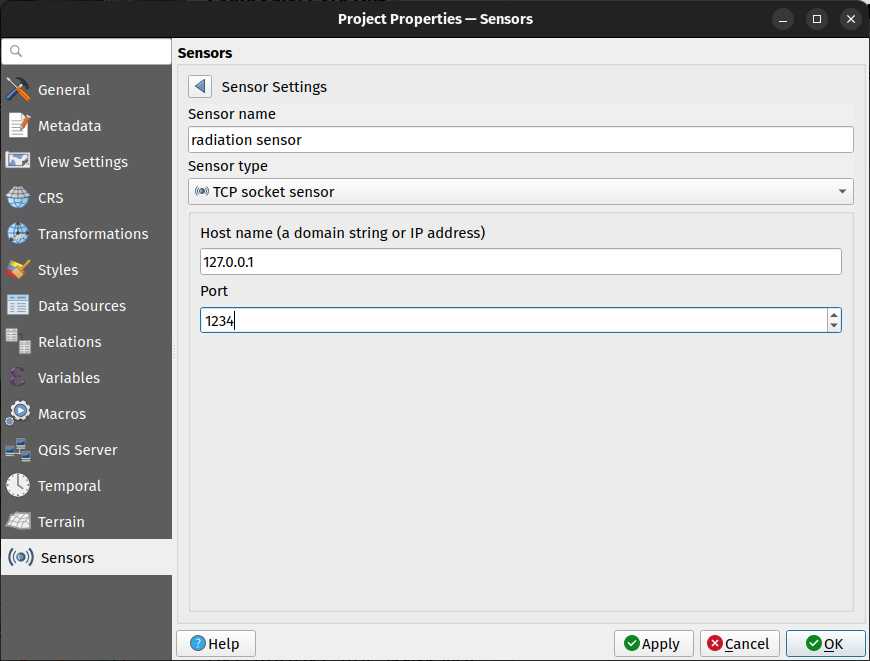
Fig. 5.43 Sensor Settings sub-panel
Once a sensor is configured, you can use the  Start button to connect the
sensor. Once active, the last collected data will be displayed in the sensors
table’s Last value column.
Start button to connect the
sensor. Once active, the last collected data will be displayed in the sensors
table’s Last value column.
5.4. Customization
The Customization dialog lets you (de)activate almost every element in the QGIS user interface. This can be very useful if you want to provide your end-users with a ‘light’ version of QGIS, containing only the icons, menus or panels they need.
Note
Before your changes are applied, you need to restart QGIS.
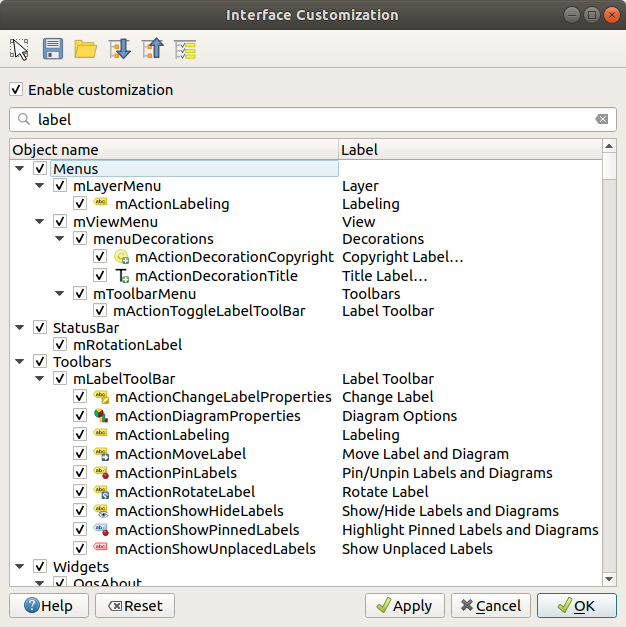
Fig. 5.44 The Customization dialog
Ticking the Enable customization checkbox is the first step
on the way to QGIS customization. This enables the toolbar and the widget
panel from which you can uncheck and thus disable some GUI items.
The configurable item can be:
a Menu or some of its sub-menus from the Menu Bar
a whole Panel (see Panels and Toolbars)
the Status bar described in Status Bar or some of its items
a Toolbar: the whole bar or some of its icons
or any widget from any dialog in QGIS: label, button, combobox…
With  Switch to catching widgets in main application, you
can click on an item in QGIS interface that you want to be hidden and
QGIS automatically unchecks the corresponding entry in the Customization dialog.
You can also use the Search box to find items by their name or label.
Switch to catching widgets in main application, you
can click on an item in QGIS interface that you want to be hidden and
QGIS automatically unchecks the corresponding entry in the Customization dialog.
You can also use the Search box to find items by their name or label.
Once you setup your configuration, click Apply or OK to validate your changes. This configuration becomes the one used by default by QGIS at the next startup.
The modifications can also be saved in a .ini file using
Save To File button. This is a handy way to share a common QGIS
interface among multiple users. Just click on Load from File
from the destination computer in order to import the .ini file.
You can also run command line tools and save various
setups for different use cases as well.
Tip
Easily restore predefined QGIS
The initial QGIS GUI configuration can be restored by one of the methods below:
unchecking
Enable customization option in the
Customization dialog or click the  Check All button
pressing the Reset button in the Settings frame under menu, System tab
launching QGIS at a command prompt with the following command line
qgis --nocustomizationsetting to
falsethe value of variable under menu, Advanced tab (see the warning).
In most cases, you need to restart QGIS in order to have the change applied.
5.5. Keyboard shortcuts
QGIS provides default keyboard shortcuts for many features. You can find them in
section Menu Bar. Additionally, the menu option
allows you to change the default keyboard shortcuts and add new
ones to QGIS features.
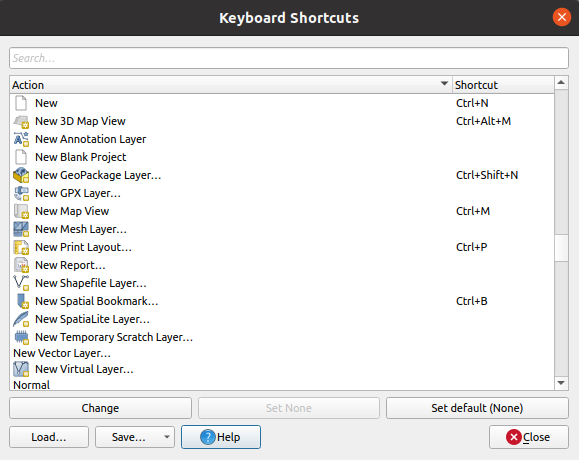
Fig. 5.45 Define shortcut options
Configuration is very simple. Use the search box at the top of the dialog to find a particular action, select it from the list and click on :
Change and press the new combination you want to assign as new shortcut
Set None to clear any assigned shortcut
or Set Default to backup the shortcut to its original and default value.
Proceed as above for any other tools you wish to customize. Once you have
finished your configuration, simply Close the dialog to have your changes
applied. You can also Save the changes either as an .XML file
with only the User Shortcuts or with all Shortcuts or as an .PDF file with
all Shortcuts and Load them into another QGIS installation.
5.6. Running QGIS with advanced settings
5.6.1. Command line and environment variables
We’ve seen that launching QGIS is done as for any
application on your OS.
QGIS provides command line options for more advanced use cases (in some cases
you can use an environment variable instead of the command line option).
To get a list of the options, enter qgis --help on the command line, which
returns:
QGIS is a user friendly Open Source Geographic Information System.
Usage: /usr/bin/qgis.bin [OPTION] [FILE]
  OPTION:
        [-v, --version]     display version information and exit
        [-s, --snapshot filename]   emit snapshot of loaded datasets to given file
        [-w, --width width] width of snapshot to emit
        [-h, --height height]       height of snapshot to emit
        [-l, --lang language]       use language for interface text (changes existing override)
        [-p, --project projectfile] load the given QGIS project
        [-e, --extent xmin,ymin,xmax,ymax]  set initial map extent
        [-n, --nologo]      hide splash screen
        [-V, --noversioncheck]      don't check for new version of QGIS at startup
        [-P, --noplugins]   don't restore plugins on startup
        [-B, --skipbadlayers]     don't prompt for missing layers
        [-C, --nocustomization]     don't apply GUI customization
        [-z, --customizationfile path]      use the given ini file as GUI customization
        [-g, --globalsettingsfile path]     use the given ini file as Global Settings (defaults)
        [-a, --authdbdirectory path] use the given directory for authentication database
        [-f, --code path]   run the given python file on load
        [-F, --py-args arguments]   arguments for python. These arguments will be available for each python execution via 'sys.argv' including the file specified by '--code'. All arguments till '--' are passed to python and ignored by QGIS.
        [-d, --defaultui]   start by resetting user ui settings to default
        [--hide-browser]        hide the browser widget
        [--dxf-export filename.dxf]     emit dxf output of loaded datasets to given file
        [--dxf-extent xmin,ymin,xmax,ymax]      set extent to export to dxf
        [--dxf-symbology-mode none|symbollayer|feature] symbology mode for dxf output
        [--dxf-scale-denom scale]       scale for dxf output
        [--dxf-encoding encoding]       encoding to use for dxf output
        [--dxf-map-theme maptheme]      map theme to use for dxf output
        [--take-screenshots output_path]        take screen shots for the user documentation
        [--screenshots-categories categories]   specify the categories of screenshot to be used (see QgsAppScreenShots::Categories).
        [--profile name]        load a named profile from the user's profiles folder.
        [-S, --profiles-path path]  path to store user profile folders. Will create profiles inside a {path}\profiles folder
        [--version-migration]   force the settings migration from older version if found
        [--openclprogramfolder]         path to the folder containing the sources for OpenCL programs.
        [--help]                this text
        [--]            treat all following arguments as FILEs

  FILE:
    Files specified on the command line can include rasters,
    vectors, and QGIS project files (.qgs and .qgz):
     1. Rasters - supported formats include GeoTiff, DEM
        and others supported by GDAL
     2. Vectors - supported formats include ESRI Shapefiles
        and others supported by OGR and PostgreSQL layers using
        the PostGIS extension
Tip
Example Using command line arguments
You can start QGIS by specifying one or more data files on the command
line. For example, assuming you are in the qgis_sample_data
directory, you could start QGIS with a vector layer and a raster file
set to load on startup using the following command:
qgis ./raster/landcover.img ./gml/lakes.gml
5.6.1.1. --version
This option returns QGIS version information.
5.6.1.2. --snapshot
This option allows you to create a snapshot in PNG format from the current view. This comes in handy when you have many projects and want to generate snapshots from your data, or when you need to create snapshots of the same project with updated data.
Currently, it generates a PNG file with 800x600 pixels. The size can be adjusted
using the --width and --height arguments. The filename can
be added after --snapshot. For example:
qgis --snapshot my_image.png --width 1000 --height 600 --project my_project.qgs
5.6.1.3. --width
This option returns the width of the snapshot to be emitted (used with --snapshot).
5.6.1.4. --height
This option returns the height of the snapshot to be emitted (used with --snapshot).
5.6.1.5. --lang
Based on your locale, QGIS selects the correct localization. If you would like
to change your language, you can specify a language code. For example,
qgis --lang it starts QGIS in Italian localization.
5.6.1.6. --project
Starting QGIS with an existing project file is also possible. Just add the
command line option --project followed by your project name and QGIS will
open with all layers in the given file loaded.
5.6.1.7. --extent
To start with a specific map extent use this option. You need to add the bounding box of your extent in the following order separated by a comma:
--extent xmin,ymin,xmax,ymax
This option probably makes more sense when paired with the --project option
to open a specific project at the desired extent.
5.6.1.8. --nologo
This option hides the splash screen when you start QGIS.
5.6.1.9. --noversioncheck
Skip searching for a new version of QGIS at startup.
5.6.1.10. --noplugins
If you have trouble at start-up with plugins, you can avoid loading them at start-up with this option. They will still be available from the Plugins Manager afterwards.
5.6.1.11. --nocustomization
Using this option, any existing GUI customization will not be applied at startup. This means that any hidden buttons, menu items, toolbars, and so on, will show up on QGIS start up. This is not a permanent change. The customization will be applied again if QGIS is launched without this option.
This option is useful for temporarily allowing access to tools that have been removed by customization.
5.6.1.12. --skipbadlayers
Using this option, you can avoid QGIS prompting the Handle Unavailable Layers dialog at startup. The project file is loaded, with missing layers kept as unavailable. More details on the topic at Handling broken file paths.
5.6.1.13. --customizationfile
Using this option, you can define a UI customization file, that will be used at startup.
5.6.1.14. --globalsettingsfile
The equivalent environment variable is QGIS_GLOBAL_SETTINGS_FILE.
Using this option, you can specify the path for a Global Settings
file (.ini), also known as the Default Settings. The settings in the specified
file replace the original inline default ones, but the user profiles’
settings will be set on top of those.
QGIS looks for the default global settings file in the following order and only the first found file will be used:
path specified by the commandline parameter
path defined by the environment variable
the AppDataLocation folder, where persistent application data can be stored; it is managed by the user or system administrator and is not touched by installer and does not require any additional setup like passing commandline parameters or settings environment variable. Depending on the OS, it is:
-
$HOME/.local/share/QGIS/QGIS3/ -
C:\Users\<username>\%AppData%\Roaming\QGIS\QGIS3\ -
$HOME/Library/Application Support/QGIS/QGIS3/
the installation directory, i.e.,
your_QGIS_package_path/resources/qgis_global_settings.ini.
Presently, there’s no way to specify a file to write settings to; therefore, you can create a copy of an original settings file, rename, and adapt it.
Setting the qgis_global_setting.ini file path to a network shared
folder, allows a system administrator to change global settings and defaults in
several machines by only editing one file.
5.6.1.15. --authdbdirectory
This option is similar to --globalsettingsfile, but defines the path to the
directory where the authentication database will be stored and loaded.
5.6.1.16. --code
This option can be used to run a given python file directly after QGIS has started.
For example, when you have a python file named load_alaska.py with
following content:
from qgis.utils import iface
raster_file = "/home/gisadmin/Documents/qgis_sample_data/raster/landcover.img"
layer_name = "Alaska"
iface.addRasterLayer(raster_file, layer_name)
Assuming you are in the directory where the file load_alaska.py is
located, you can start QGIS, load the raster file landcover.img and give
the layer the name ‘Alaska’ using the following command:
qgis --code load_alaska.py
5.6.1.17. --py-args
This option allows to pass arguments to the script provided via the –code parameter
and more generally to each python execution.
After --py-args, it is not possible to pass any other parameter than – to QGIS.
All arguments after --py-args till -- are passed over to the python interpreter and ignored by QGIS.
qgis --code /home/user/test.py --py-args --specialScriptArguments "a text arg" 'and another arg' -- layer1 layer2
In the above code, test.py will have this content in sys.argv:
[‘/home/user/test.py’, ‘–specialScriptArguments’, ‘a text arg’, ‘and another arg’].
layer1 and layer2 will be normally handled by QGIS as layers to load.
5.6.1.18. --defaultui
On load, permanently resets the user interface (UI) to the default settings. This option will restore the panels and toolbars visibility, position, and size. Unless it’s changed again, the default UI settings will be used in the following sessions.
Notice that this option doesn’t have any effect on GUI customization.
Items hidden by GUI customization (e.g., the status bar) will remain hidden
even using the --defaultui option.
See also the --nocustomization option.
5.6.1.19. --hide-browser
On load, hides the Browser panel from the user interface. The panel
can be enabled by right-clicking a space in the toolbars or using the
( in  Linux KDE).
Unless it’s enabled again, the Browser panel will remain hidden in the following sessions.
5.6.1.20. --dxf-*
These options can be used to export a QGIS project into a DXF file. Several options are available:
–dxf-export: the DXF filename into which to export the layers;
–dxf-extent: the extent of the final DXF file;
–dxf-symbology-mode: several values can be used here:
none(no symbology),symbollayer(Symbol layer symbology),feature(feature symbology);–dxf-scale-denom: the scale denominator of the symbology;
–dxf-encoding: the file encoding;
–dxf-map-theme: choose a map theme from the layer tree configuration.
5.6.1.21. --take-screenshots
Takes screenshots for the user documentation. Can be used together with
--screenshots-categories to filter which categories/sections of the
documentation screenshots should be created (see QgsAppScreenShots::Categories).
5.6.1.22. --profile
Loads QGIS using a specific profile from the user’s profile folder. If the named profile doesn’t exist, it will be created. This option takes precedence over user profile startup setting.
5.6.1.23. --profiles-path
With this option, you can choose a path to load and save the profiles (user
settings). It creates profiles inside a {path}\profiles folder, which
includes settings, installed plugins, processing models and scripts, and so on.
This option allows you to, for instance, carry all your plugins and settings in a flash drive, or, for example, share the settings between different computers using a file sharing service.
The equivalent environment variable is QGIS_CUSTOM_CONFIG_PATH.
5.6.1.24. --version-migration
If settings from an older version are found (e.g., the .qgis2 folder from QGIS
2.18), this option will import them into the default QGIS profile.
5.6.1.25. --openclprogramfolder
Using this option, you can specify an alternative path for your OpenCL programs. This is useful for developers while testing new versions of the programs without needing to replace the existing ones.
The equivalent environment variable is QGIS_OPENCL_PROGRAM_FOLDER.
5.6.1.26. --
This option allows to pass following arguments as files to open in QGIS. They can be supported rasters or vectors files, QGIS layer definition files or project files.
qgis -- /home/user/project.qgs /home/user/path_to_data/layer1.gpkg
The above code will start QGIS, open the project file and load layer1 in it.
5.6.2. Deploying QGIS within an organization
If you need to deploy QGIS within an organization with a custom configuration file,
first you need to copy/paste the content of the default settings file located in
your_QGIS_package_path/resources/qgis_global_settings.ini. This file already
contains some default sections identified by a block starting with [].
We recommend that you keep these defaults values and add your own sections at the bottom
of the file. If a section is duplicated in the file, QGIS will take the last
one from top to bottom.
You can change allowVersionCheck=false to disable the QGIS version check.
If you do not want to display the migration window after a fresh install, you need the following section:
[migration]
fileVersion=2
settings=true
If you want to add a custom variable in the global scope:
[variables]
organisation="Your organization"
A lot of settings can be set using the .INI file such as WMS/WMTS, PostgreSQL connections,
proxy settings, maptips, default values for algorithms parameters…
For example, if you want to configure organization wide default values for some algorithms
it would be handy if you could configure it in the prepared ini-file for all users.
If the users then open the toolbox to execute an algorithm, the default values will be there.
To set the default value, e.g., for GRID_SIZE parameter for the native:intersection algorithm,
you could write the following into the .INI file:
[Processing]
DefaultGuiParam\native%3Aintersection\GRID_SIZE=0.01
Not all settings can be prepared from QGIS GUI,
but to discover the possibilities of the settings .INI file,
we suggest that you set the config you would like in QGIS Desktop
and then search for it in your .INI file located in your profile using a text editor.
Finally, you need to set the environment variable QGIS_GLOBAL_SETTINGS_FILE
to the path of your customized file.
In addition, you can also deploy files such as Python macros, color palettes, layout templates, project templates… either in the QGIS system directory or in the QGIS user profile.
Layout templates must be deployed in the
composer_templatesdirectory.Project templates must be deployed in the
project_templatesdirectory.Custom Python macros must be deployed in the
pythondirectory.