Důležité
Translation is a community effort you can join. This page is currently translated at 79.83%.
2. Úvod do GIS
|
Cíle: |
Pochopení, co je to GIS a k čemu ho lze použít. |
Klíčová slova: |
GIS, počítač, mapy, data, informační systém, prostorový, analýza |
2.1. Přehled
Stejně jako používáme textový editor pro psaní dokumentů a zabýváme se slovy na počítači, můžeme použít aplikaci GIS k zabývání se prostorovými informacemi na počítači. GIS je zkratka pro „geografickým informační systém“.
GIS se skládá z:
Digital Data — the geographical information that you will view and analyse using computer hardware and software.
Computer Hardware — computers used for storing data, displaying graphics and processing data.
Computer Software — computer programs that run on the computer hardware and allow you to work with digital data. A software program that forms part of the GIS is called a GIS Application.
S aplikací GIS můžete otevřít digitální mapy na počítači, vytvářet nové prostorové informace pro přidání do mapy, vytvářet tištěné mapy na míru vašim potřebám a provádět prostorovou analýzu.
Podívejme se podívat na malý příklad toho, jak GIS může být užitečný. Představte si, že jste zdravotník a poznamenáváte si datum a místo bydliště každého pacienta, kterého jste léčil.
Zeměpisná délka |
Zeměpisná šířka |
Choroba |
Datum |
|---|---|---|---|
26.870436 |
-31.909519 |
Příušnice |
13.12.2008 |
26.868682 |
-31.909259 |
Příušnice |
24.12.2008 |
26.867707 |
-31.910494 |
Příušnice |
22.01.2009 |
26.854908 |
-31.920759 |
Spalničky |
11.01.2009 |
26.855817 |
-31.921929 |
Spalničky |
26.01.2009 |
26.852764 |
-31.921929 |
Spalničky |
10.02.2009 |
26.854778 |
-31.925112 |
Spalničky |
22.02.2009 |
26.869072 |
-31.911988 |
Příušnice |
02.02.2009 |
26.863354 |
-31.916406 |
Plané neštovice |
26.02.2009 |
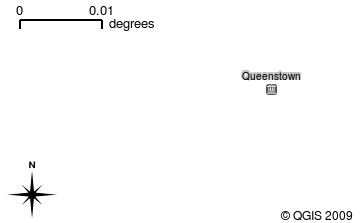
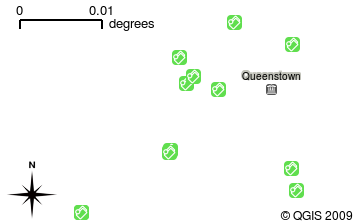
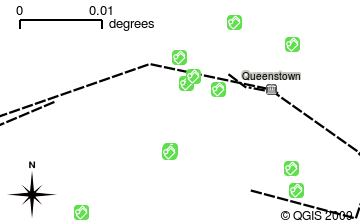
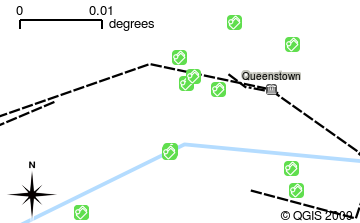
Podíváte-li se na výše uvedené tabulky rychle uvidíte, že bylo mnoho případů onemocnění spalničkami v lednu a únoru. Náše zdravotnice zaznamenala pozici domu každého pacienta, poznamenáním jejich zeměpisné šířky a délky do tabulky. Použitím těchto dat v GIS aplikaci, můžeme rychle zjistit mnohem více o příčinách nemocí:
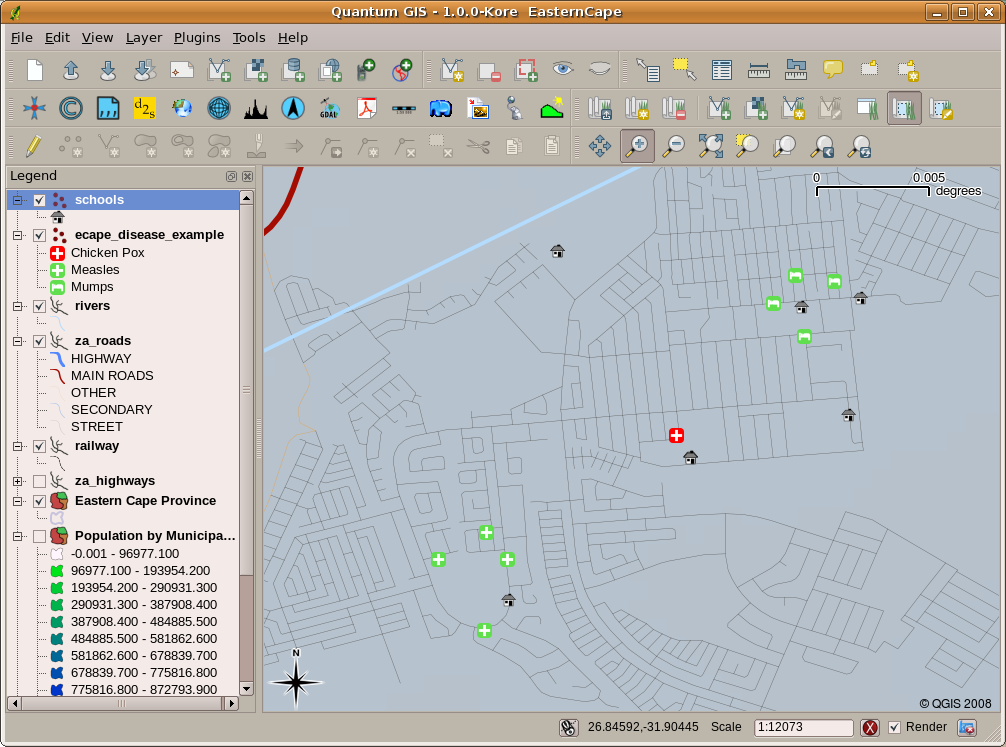
Obr. 2.11 Příklad ukazuje záznamy onemocnění v aplikaci GIS. Je snadno vidět, že všichni pacienti s příušnicemi žijí blízko u sebe.
2.2. Více o GISu
GIS is a relatively new field — it started in the 1970’s. It used to be that computerised GIS was only available to companies and universities that had expensive computer equipment. These days, anyone with a personal computer or laptop can use GIS software. Over time GIS Applications have also become easier to use — it used to require a lot of training to use a GIS Application, but now it is much easier to get started in GIS even for amateurs and casual users. As we described above, GIS is more than just software, it refers to all aspects of managing and using digital geographical data. In the tutorials that follow we will be focusing on GIS Software.
2.3. Co je to software GIS / GIS aplikace?
You can see an example of what a GIS Application looks like in Obr. 2.11. GIS Applications are normally programs with a graphical user interface that can be manipulated using the mouse and keyboard. The application provides menus near to the top of the window (Project, Edit, etc.) which, when clicked using the mouse, show a panel of actions. These actions provide a way for you to tell the GIS Application what you want to do. For example you may use the menus to tell the GIS Application to add a new layer to the display output, as in Obr. 2.12.
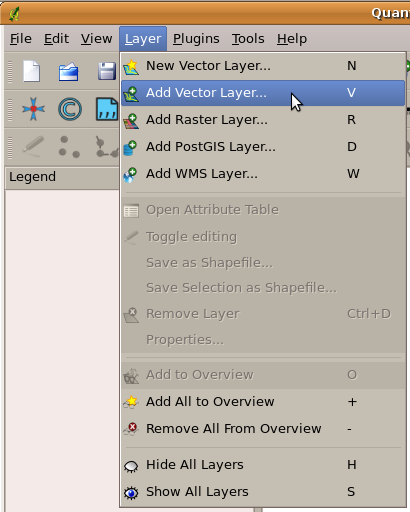
Obr. 2.12 Nabídka aplikace se, po kliknutí myší, rozbalí a zobrazí seznam akcí, které mohou být provedeny.
As seen in Obr. 2.13, toolbars (rows of small pictures that can be clicked with the mouse) normally sit just below the menus and provide a quicker way to use frequently needed actions.
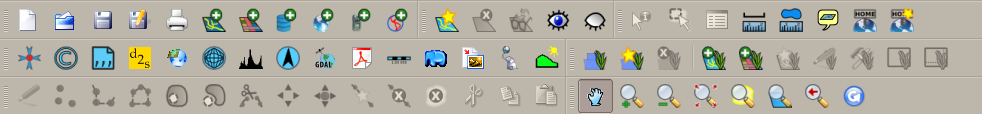
Obr. 2.13 Panely nástrojů poskytují rychlý přístup k běžně používaným funkcím. Poržením myši nad obrázkem vám obvykle řekne, co se stane, když na něj kliknete.
A common function of GIS Applications is to display map layers. Map layers are stored as files on a disk or as records in a database. Normally each map layer will represent something in the real world — a roads layer for example will have data about the street network.
When you open a layer in the GIS Application it will appear in the map view. The map view shows a graphic representing your layer. When you add more than one layer to a map view, the layers are overlaid on top of each other. Look at figures Obr. 2.14, Obr. 2.15, Obr. 2.16 and Obr. 2.17 to see a map view that has several layers being added to it.
Obr. 2.14 A towns layer added to the map view
Obr. 2.15 A schools layer added to the map view
Obr. 2.16 A railways layer added to the map view
Obr. 2.17 A rivers layer added to the map view
An important function of the map view is to allow you to zoom in to magnify, zoom out to see a greater area and move around (panning) in the map. GIS software also lets you easily change symbology — the way information is displayed. Obr. 2.18 shows the map view after panning to the side and changing the symbology of the layers.
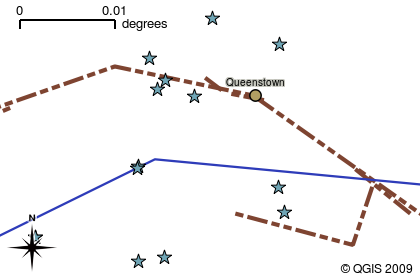
Obr. 2.18 A map view after moving around (panning) and changing the symbology
Another common feature of GIS Applications is the map legend. The map legend provides a list of layers that have been loaded in the GIS Application. Unlike a paper map legend, the map legend or ‚layers list‘ in the GIS Application provides a way to re-order, hide, show and group layers. Changing the layer order is done by clicking on a layer in the legend, holding the mouse button down and then dragging the layer to a new position. In Obr. 2.19 and Obr. 2.20, the map legend is shown as the area to the left of the GIS Application window. By changing the layer order, the way that layers are drawn can be adjusted — in this case so that rivers are drawn below the roads instead of over them.
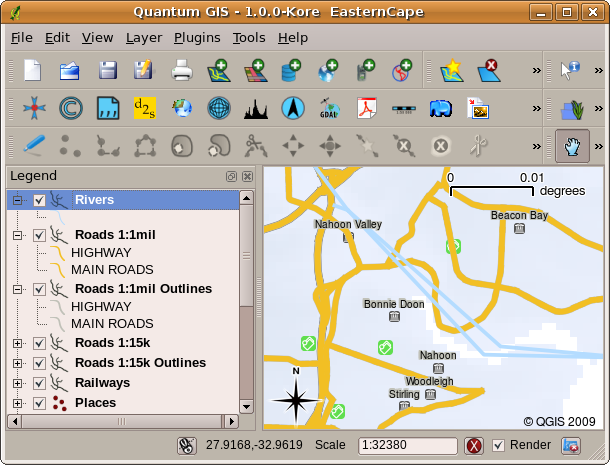
Obr. 2.19 Changing the layer order allows to adjust the way that layers are drawn. Before changing the layer order, rivers are drawn on top of roads
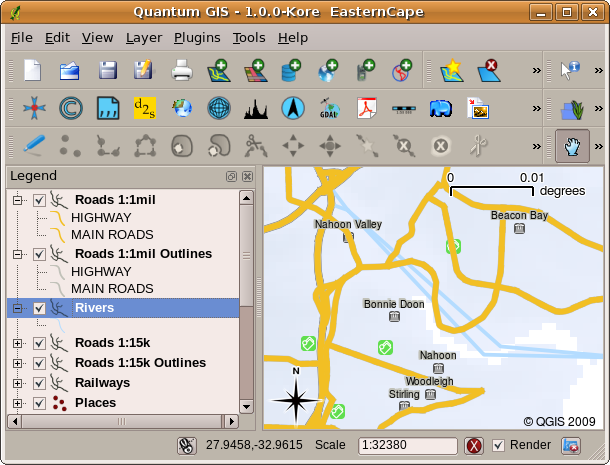
Obr. 2.20 Changing the layer order allows to adjust the way that layers are drawn. After changing the layer order, rivers are drawn underneath roads
2.4. Získání GIS aplikace pro váš vlastní počítač(e)
There are many different GIS Applications available. Some have many sophisticated features and cost tens of thousands of Rands for each copy. In other cases, you can obtain a GIS Application for free. Deciding which GIS Application to use is a question of how much money you can afford and personal preference. For these tutorials, we will be using the QGIS Application. QGIS is completely free and you can copy it and share it with your friends as much as you like. If you received this tutorial in printed form, you should have received a copy of QGIS with it. If not, you can always visit https://www.qgis.org/ to download your free copy if you have access to the internet.
2.5. GIS data
Teď, když víme, co je to GIS a co GIS aplikace může dělat, pojďme se pobavit o GIS datech. Data jsou jiným slovem pro informaci. Informace, které používáme v GISu mají obvykle geografický vzhled. Představte si náš výše uvedený příklad o zdravotnici. Ona vytvořila tabulku, pro zaznamenávání nemocí, která vypadala asi takto:
Zeměpisná délka |
Zeměpisná šířka |
Choroba |
Datum |
|---|---|---|---|
26.870436 |
-31.909519 |
Příušnice |
13.12.2008 |
Sloupce zeměpisné délky a šířky mají geografické údaje. Sloupce nemoci a datumu mají negeografické údaje.
A common feature of GIS is that they allow you to associate information (non-geographical data) with places (geographical data). In fact, the GIS Application can store many pieces of information which are associated with each place — something that paper maps are not very good at. For example, our health care worker could store the person’s age and gender on her table. When the GIS Application draws the layer, you can tell it to draw the layer based on gender, or based on disease type, and so on. So, with a GIS Application we have a way to easily change the appearance of the maps we created based on the non-geographical data associated with places.
GIS Systems work with many different types of data. Vector data are stored as
a series of X, Y coordinate pairs inside the computer’s memory. Vector data
are used to represent points, lines and areas. Obr. 2.21
shows different types of vector data being viewed in a GIS application. In the
tutorials that follow we will be exploring vector data in more detail.
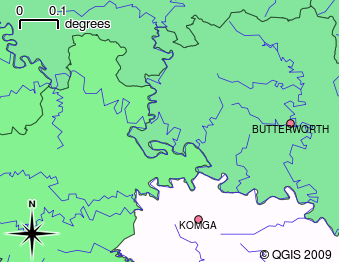
Obr. 2.21 Vector data are used to represent points (e.g., towns), lines (e.g., rivers) and polygons (e.g., municipal boundaries).
Raster data are stored as a grid of values. There are many satellites circling the earth and the photographs they take are a kind of raster data that can be viewed in a GIS. One important difference between raster and vector data is that if you zoom in too much on a raster image, it will start to appear ‚blocky‘ (see Obr. 2.22 and Obr. 2.23). In fact these blocks are the individual cells of the data grid that makes up the raster image. We will be looking at raster data in greater detail in later tutorials.
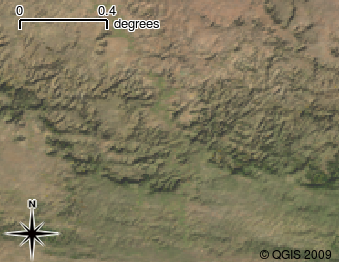
Obr. 2.22 Rastrová data jsou často snímky pořízené družicemi. Zde můžeme vidět hory Východního Kapska.
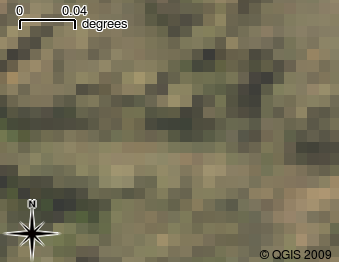
Obr. 2.23 Stejná rastrová data, ale tentokrát přiblížená. Zde můžete vidět povahu mřížky dat.
2.6. Co jsme se naučili?
Pojďme si shrnout, co jsme se naučili v tomto prostředí:
GIS je systém počítačového hardwaru, počítačového softwaru a geografických dat.
GIS aplikace umožňuje zobrazit geografická data a je důležitou součástí GISu.
GIS aplikace se obvykle skládá z nástrojového menu, panelu nástrojů, mapového okna ** a **legendy.
Vectorová a rastrová data jsou geografická data použitá v aplikaci GIS.
Geografická data mohou být spojena s negeografickými daty.
2.7. Nyní si to zkuste sami!
Zde jsou pro Vás nějaké nápady, jak si to zkusit se svými učni:
Zeměpis: Popište pojem GIS svým studentům, jak je uvedeno v tomto návodu. Požádejte je, aby se pokusili vymyslet 3 důvody, proč by mohlo být užitečné použití GISu místo papírových map. Zde jsou některé, které by nás mohli napadnout:
GIS aplikace umožňují vytvářet mnoho různých typů map ze stejných dat.
GIS je skvělý vizualizační nástroj, který vám ukáže náležitosti vašich dat a jak jsou uspořádána v prostoru (např. tato vypuknutí onemocnení, které jsme viděli dříve).
Papírové mapy musí být zakládané a jsou časově náročné ke zobrazení. GIS může pojmout velké množství mapových podkladů a snadno a rychle najít místo, které vás zajímá.
Zeměpis: Vy a vaši studenti můžete přemýšlet o tom, jak by rastrová data z družic mohla být užitečná? Zde jsou některé naše nápady:
Při živelných pohromách, mohou být rastrová data užitečná pro zobrazení, kde postižené jsou. Například nedávný družicový snímek, pořízený při povodni, může pomoci obrazit oblasti, kde lidé mohou potřebovat záchranu.
Sometimes people do bad things to the environment, like dumping dangerous chemicals that kill plants and animals. Using raster data from satellites can help us to monitor for these types of problems.
Urbanisté mohou využívat rastrová data z družic ke zjištění, kde se vyskytují squaty a k pomoci při plánování infrastruktury.
2.8. Něco k zamyšlení
Pokud nemáte k dispozici počítač, mnoho témat, kterými se zabýváme v tomto návodu lze vytvořit za pomoci nadhledu a přehledu, protože je použita stejná technika přidávání informací. Avšak, ke správnému pochopení GISu, je vždy lepší se to naučit pomocí počítače.
2.9. Další k přečtení
Kniha: Desktop GIS: Mapping the Planet with Open Source Tools. Autor: Gary Sherman. ISBN: 9781934356067
Uživatelská příručka QGIS také obsahuje podrobnější informace o práci s QGIS.
2.10. Kam dál?
V následujících částech se budeme zacházet do větších detailů, v ukázkách, jak používat GIS aplikace. Všechny návody budou provedeny pomocí QGISu. Tak tedy další, pojďme se podívat na vektory!