Importante
La traduzione è uno sforzo comunitario you can join. Questa pagina è attualmente tradotta al 84.87%.
2. Introduzione al GIS
|
Obiettivi |
Capire cos’è un GIS e per cosa può essere utilizzato. |
Parole chiave |
GIS, Computer, Mappe, Dati, Sistema inforamativo, Spatial, Analisi |
2.1. Panoramica
Così come usiamo un editor di testo per scrivere dei documenti e gestire del testo con un computer, possiamo usare un” applicazione GIS per gestire dell”informazione spaziale. GIS sta per “Sistema Informativo Geografico”.
Un GIS è costituito da:
Digital Data — the geographical information that you will view and analyse using computer hardware and software.
Computer Hardware — computers used for storing data, displaying graphics and processing data.
Computer Software — computer programs that run on the computer hardware and allow you to work with digital data. A software program that forms part of the GIS is called a GIS Application.
Con un’applicazione GIS puoi aprire delle mappe digitali, creare nuove informazioni da aggiungere alla cartografia, eseguire analisi spaziali, creare delle carte personalizzate in base ai tuoi bisogni e pronte per essere stampate.
Diamo un’occhiata ad un piccolo esempio di come GIS può essere utile. Immagina di essere un operatore sanitario e di prendere nota della data e del luogo di residenza di ogni paziente trattato.
Longitudine |
Latitudine |
Malattia |
Data |
|---|---|---|---|
26.870436 |
-31.909519 |
Orecchioni |
13/12/2008 |
26.868682 |
-31.909259 |
Orecchioni |
24/12/2008 |
26.867707 |
-31.910494 |
Orecchioni |
22/01/2009 |
26.854908 |
-31.920759 |
Morbillo |
11/01/2009 |
26.855817 |
-31.921929 |
Morbillo |
26/01/2009 |
26.852764 |
-31.921929 |
Morbillo |
10/02/2009 |
26.854778 |
-31.925112 |
Morbillo |
22/02/2009 |
26.869072 |
-31.911988 |
Orecchioni |
02/02/2009 |
26.863354 |
-31.916406 |
Varicella |
26/02/2009 |
Se osservi la tabella potrai velocemente vedere che ci sono stati molti casi di morbillo nei mesi di Gennaio e Febbraio. Inoltre è stata salvata la posizione delle abitazioni dei pazienti, riportando in tabella la loro latitdine e longitudine. A questo punto, visualizzando i dati in un’Applicazione GIS, possiamo capire molte più cose sul modello di diffusione delle malattie.
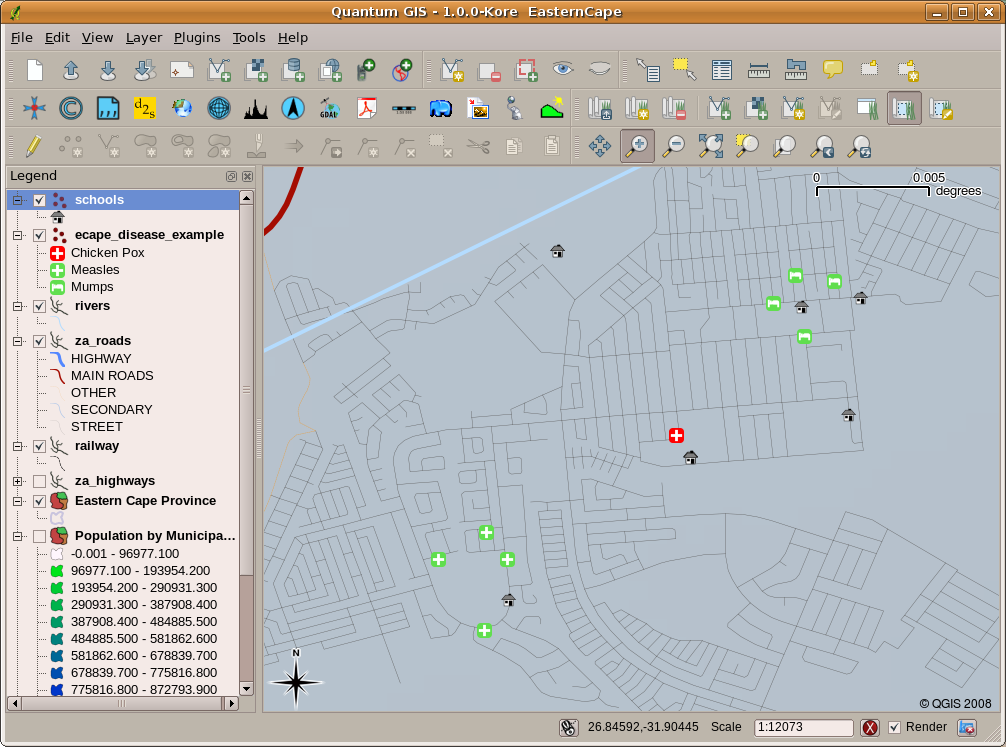
Fig. 2.11 L’esempio mostra i dati sulle malattie visualizzati su un’appplicazione GIS. E” facile vedere come i pazienti affetti da orecchioni vivano tutti vicini gli uni con gli altri.
2.2. Più infromazioni sui GIS
GIS is a relatively new field — it started in the 1970’s. It used to be that computerised GIS was only available to companies and universities that had expensive computer equipment. These days, anyone with a personal computer or laptop can use GIS software. Over time GIS Applications have also become easier to use — it used to require a lot of training to use a GIS Application, but now it is much easier to get started in GIS even for amateurs and casual users. As we described above, GIS is more than just software, it refers to all aspects of managing and using digital geographical data. In the tutorials that follow we will be focusing on GIS Software.
2.3. Cos’è un software GIS / un applicazione GIS ?
You can see an example of what a GIS Application looks like in Fig. 2.11. GIS Applications are normally programs with a graphical user interface that can be manipulated using the mouse and keyboard. The application provides menus near to the top of the window (Project, Edit, etc.) which, when clicked using the mouse, show a panel of actions. These actions provide a way for you to tell the GIS Application what you want to do. For example you may use the menus to tell the GIS Application to add a new layer to the display output, as in Fig. 2.12.
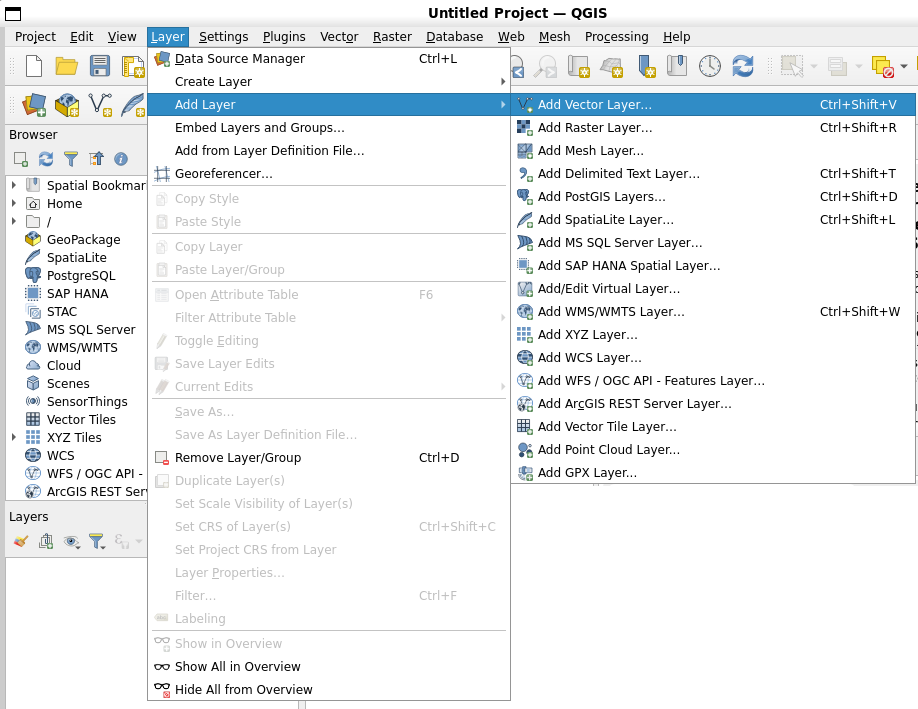
Fig. 2.12 Menù applicazioni, quando cliccato con il mouse, si espande e mostra una lista di azioni che possono essere eseguite.
As seen in Fig. 2.13, toolbars (rows of small pictures that can be clicked with the mouse) normally sit just below the menus and provide a quicker way to use frequently needed actions.
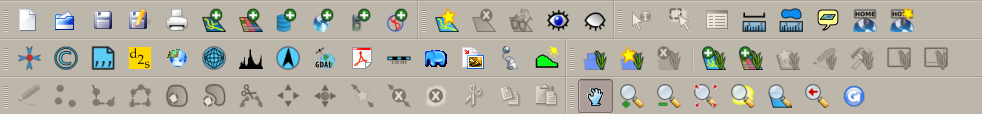
Fig. 2.13 Le barre degli strumenti accedono rapidamente alle funzioni più comunemente usate. Di solito, tenendo fermo il mouse sopra un’icona saprai cosa succederà quando farai click su di essa.
A common function of GIS Applications is to display map layers. Map layers are stored as files on a disk or as records in a database. Normally each map layer will represent something in the real world — a roads layer for example will have data about the street network.
When you open a layer in the GIS Application it will appear in the map view. The map view shows a graphic representing your layer. When you add more than one layer to a map view, the layers are overlaid on top of each other. Look at figures Fig. 2.14, Fig. 2.15, Fig. 2.16 and Fig. 2.17 to see a map view that has several layers being added to it.
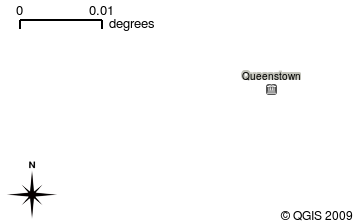
Fig. 2.14 A towns layer added to the map view
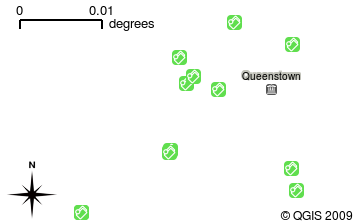
Fig. 2.15 A schools layer added to the map view
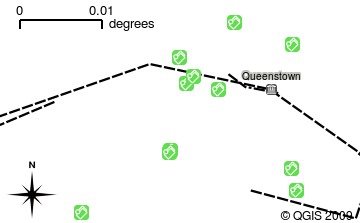
Fig. 2.16 A railways layer added to the map view
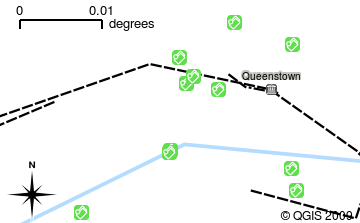
Fig. 2.17 A rivers layer added to the map view
An important function of the map view is to allow you to zoom in to magnify, zoom out to see a greater area and move around (panning) in the map. GIS software also lets you easily change symbology — the way information is displayed. Fig. 2.18 shows the map view after panning to the side and changing the symbology of the layers.
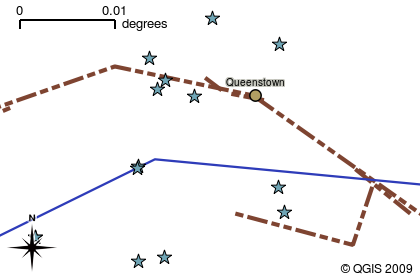
Fig. 2.18 A map view after moving around (panning) and changing the symbology
Another common feature of GIS Applications is the map legend. The map legend provides a list of layers that have been loaded in the GIS Application. Unlike a paper map legend, the map legend or “layers list” in the GIS Application provides a way to re-order, hide, show and group layers. Changing the layer order is done by clicking on a layer in the legend, holding the mouse button down and then dragging the layer to a new position. In Fig. 2.19 and Fig. 2.20, the map legend is shown as the area to the left of the GIS Application window. By changing the layer order, the way that layers are drawn can be adjusted — in this case so that rivers are drawn below the roads instead of over them.
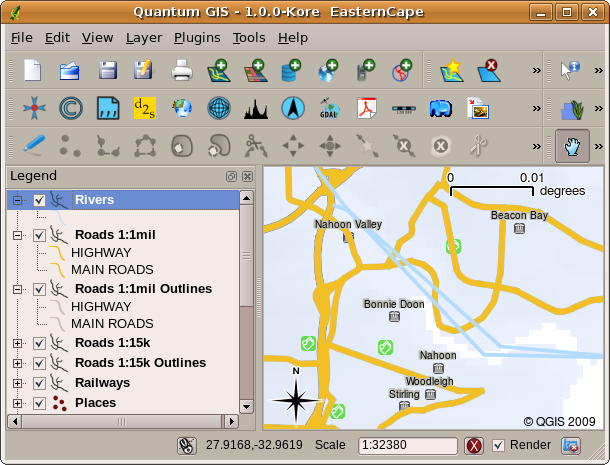
Fig. 2.19 Cambiare l’ordine dei layer permette di regolare il modo in cui i layer vengono rappresentati. Prima di cambiare l’ordine dei layer, i fiumi sono rappresentati sopra le strade
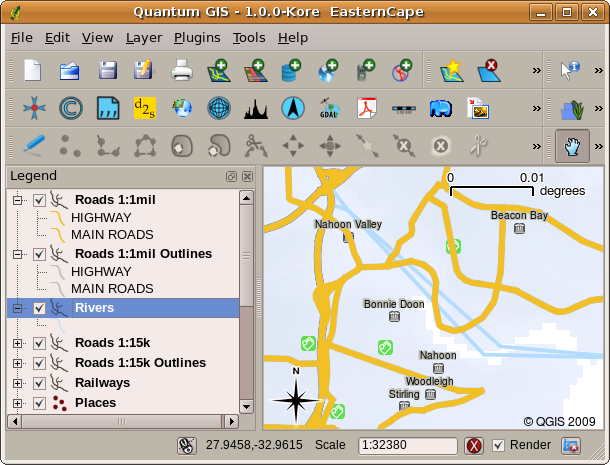
Fig. 2.20 Cambiare l’ordine dei layer permette di regolare il modo in cui i layer vengono rappresentati. Dopo aver cambiato l’ordine dei layer, i fiumi sono rappresentati sotto le strade
2.4. Ottenere un’Applicazione GIS per il proprio computer(s)
Sono disponibili molte diverse Applicazioni GIS. Alcune hanno molte funzioni sofisticate e costano molto per ogni copia. In altri casi, è possibile ottenere gratuitamente un’applicazione GIS. Decidere quale applicazione GIS usare è una questione di quanto denaro puoi permetterti e di preferenze personali. In questo tutorial, utilizzeremo l’applicazione QGIS. QGIS è completamente gratuito e puoi copiarlo e condividerlo con i tuoi amici quanto vuoi. Se hai ricevuto questo tutorial in forma stampata, dovresti aver ricevuto una copia di QGIS. In caso contrario, puoi sempre visitare https://www.qgis.org/ per scaricare la tua copia gratuita se hai accesso a Internet.
2.5. Dati GIS
Ora che sappiamo cos’è un GIS e cosa può fare un’applicazione GIS, parliamo di dati GIS. I dati sono un altro modo di chiamare le informazioni. Le informazioni che usiamo in un GIS normalmente hanno un aspetto geografico. Pensa al nostro esempio sopra, a proposito dell’operatore sanitario. Ha creato una tabella per registrare le malattie che assomigliava a questo:
Longitudine |
Latitudine |
Malattia |
Data |
|---|---|---|---|
26.870436 |
-31.909519 |
Orecchioni |
13/12/2008 |
Le colonne di longitudine e latitudine contengono i dati geografici. Le colonne relative a malattia e data contengono i dati non geografici.
A common feature of GIS is that they allow you to associate information (non-geographical data) with places (geographical data). In fact, the GIS Application can store many pieces of information which are associated with each place — something that paper maps are not very good at. For example, our health care worker could store the person’s age and gender on her table. When the GIS Application draws the layer, you can tell it to draw the layer based on gender, or based on disease type, and so on. So, with a GIS Application we have a way to easily change the appearance of the maps we created based on the non-geographical data associated with places.
GIS Systems work with many different types of data. Vector data are stored as
a series of X, Y coordinate pairs inside the computer’s memory. Vector data
are used to represent points, lines and areas. Fig. 2.21
shows different types of vector data being viewed in a GIS application. In the
tutorials that follow we will be exploring vector data in more detail.
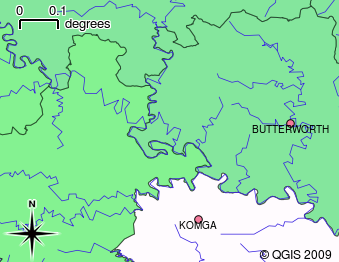
Fig. 2.21 I dati vettoriali vengono utilizzati per rappresentare punti (ad esempio città), linee (ad esempio fiumi) e poligoni (ad esempio confini comunali).
Raster data are stored as a grid of values. There are many satellites circling the earth and the photographs they take are a kind of raster data that can be viewed in a GIS. One important difference between raster and vector data is that if you zoom in too much on a raster image, it will start to appear “blocky” (see Fig. 2.22 and Fig. 2.23). In fact these blocks are the individual cells of the data grid that makes up the raster image. We will be looking at raster data in greater detail in later tutorials.
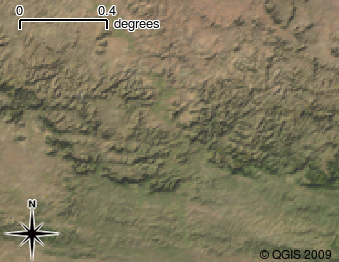
Fig. 2.22 I dati raster sono spesso immagini scattate dai satelliti. Qui possiamo vedere le montagne nell’Eastern Cape.
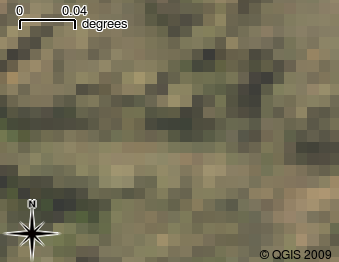
Fig. 2.23 Gli stessi dati raster, ma questa volta ingranditi. Si può vedere la natura della griglia dei dati.
2.6. Cosa abbiamo imparato?
Riassumiamo il contenuto di questi appunti:
Un GIS è un sistema di hardware, software e dati geografici.
Una Applicazione GIS ti consente di visualizzare i dati geografici ed è una parte importante del GIS.
Un’applicazione GIS normalmente consiste in una barra dei menu, barre degli strumenti, una vista mappa e una legenda.
I dati vettore e raster sono i dati geografici utilizzati in un’applicazione GIS.
i dati Geografici possono avere associati a dati non-geografici.
2.7. Adesso prova tu!
Di seguito alcune idee da provare con le vostre nuove conoscenze:
Geografia: Descrivi il concetto di GIS per i tuoi studenti come descritto in questo tutorial. Chiedi loro di provare a pensare a 3 motivi per cui potrebbe essere utile utilizzare un GIS invece di mappe cartacee. Di seguito alcuni aspetti su cui potremmo chiedere di riflettere:
Le applicazioni GIS ti consentono di creare molti diversi tipi di mappe dagli stessi dati.
Il GIS è un ottimo strumento di visualizzazione in grado di mostrarti le cose sui tuoi dati e su come sono correlati nello spazio (ad esempio, quelli epidemie che abbiamo visto prima).
Le mappe cartacee devono essere archiviate e richiedono molto tempo per essere visualizzate. Il GIS può contenere una grande quantità di dati cartografici rendere facile e veloce la ricerca di un luogo a cui sei interessato.
Geografia: Potete voi e i vostri studenti a pensare a come i dati raster dai satelliti potrebbero essere utili? Ecco alcune idee che abbiamo:
Durante i disastri naturali, i dati raster possono essere utili per mostrare dove sono le aree interessate. Ad esempio, una recente immagine satellitare scattata durante un’alluvione ci può aiutare a mostrare dove le persone potrebbero aver bisogno di essere salvate.
A volte le persone compiono azioni dannose per l’ambiente, come lo scarico di sostanze chimiche pericolose che uccidono piante e animali. L’utilizzo dei dati raster provenienti dai satelliti può aiutarci a monitorare questo tipo di problemi.
I pianificatori comunali possono utilizzare i dati raster dai satelliti per vedere dove sono gli insediamenti irregolari e per aiutare nella pianificazione territoriale.
2.8. Qualcosa su cui pensare
Se disponi di un computer, molti degli argomenti trattati in questo tutorial possono essere riprodotti utilizzando una lavagna luminosa e delle trasparenze poiché si utilizza la stessa tecnica di stratificazione delle informazioni. Tuttavia, per capire correttamente il GIS è sempre meglio impararlo usando un computer.
2.9. Altre letture
Book: Desktop GIS: Mapping the Planet with Open Source Tools. Author: Gary Sherman. ISBN: 9781934356067
La Guida per l’utente di QGIS ha anche informazioni più dettagliate su come lavorare con QGIS.
2.10. Cosa viene adesso?
Nelle sezioni che seguono andremo più in dettaglio, mostrandoti come usare un’applicazione GIS. Tutte le esercitazioni verranno eseguite utilizzando QGIS. Avanti, guardiamo i vettori!