Важно
Перевод - это работа сообщества : ссылка:Вы можете присоединиться. Эта страница в настоящее время переводится |прогресс перевода|.
2. Введение в ГИС
|
Цель: |
Понять что такое ГИС и для чего они используются. |
Основные понятия: |
ИС, компьютер, карты, данные, информационная система, пространственный, анализ |
2.1. Обзор
Так же, как мы используем текстовый процессор для создания документов и работы со словами на компьютере, мы используем ГИС-приложение для работы с пространственной информацией. ГИС это сокращение от Географическая Информационная Система.
ГИС состоит из:
Digital Data — the geographical information that you will view and analyse using computer hardware and software.
Computer Hardware — computers used for storing data, displaying graphics and processing data.
Computer Software — computer programs that run on the computer hardware and allow you to work with digital data. A software program that forms part of the GIS is called a GIS Application.
ГИС-приложения позволяют открывать электронные карты на компьютере, создавать новые пространственные объекты и добавлять их на карты, изготавливать печатные карты и выполнять пространственный анализ.
Рассмотрим небольшой пример использования ГИС. Представьте себе, что вы медицинский работник и у вас есть записи с датой посещения и местом проживания каждого пациента.
Долгота |
Широта |
Заболевание |
Дата |
|---|---|---|---|
26.870436 |
-31.909519 |
Свинка |
13/12/2008 |
26.868682 |
-31.909259 |
Свинка |
24/12/2008 |
26.867707 |
-31.910494 |
Свинка |
22/01/2009 |
26.854908 |
-31.920759 |
Корь |
11/01/2009 |
26.855817 |
-31.921929 |
Корь |
26/01/2009 |
26.852764 |
-31.921929 |
Корь |
10/02/2009 |
26.854778 |
-31.925112 |
Корь |
22/02/2009 |
26.869072 |
-31.911988 |
Свинка |
02/02/2009 |
26.863354 |
-31.916406 |
Ветряная оспа |
26/02/2009 |
По этой таблице видно, что больше всего случаев заболевания корью было в январе и феврале. Наш медицинский работник записал расположение каждого пациента, указав координаты (широту и долготу) его дома в таблице. Используя эти данные в ГИС-приложении мы можем намного больше узнать о распределении болезней:
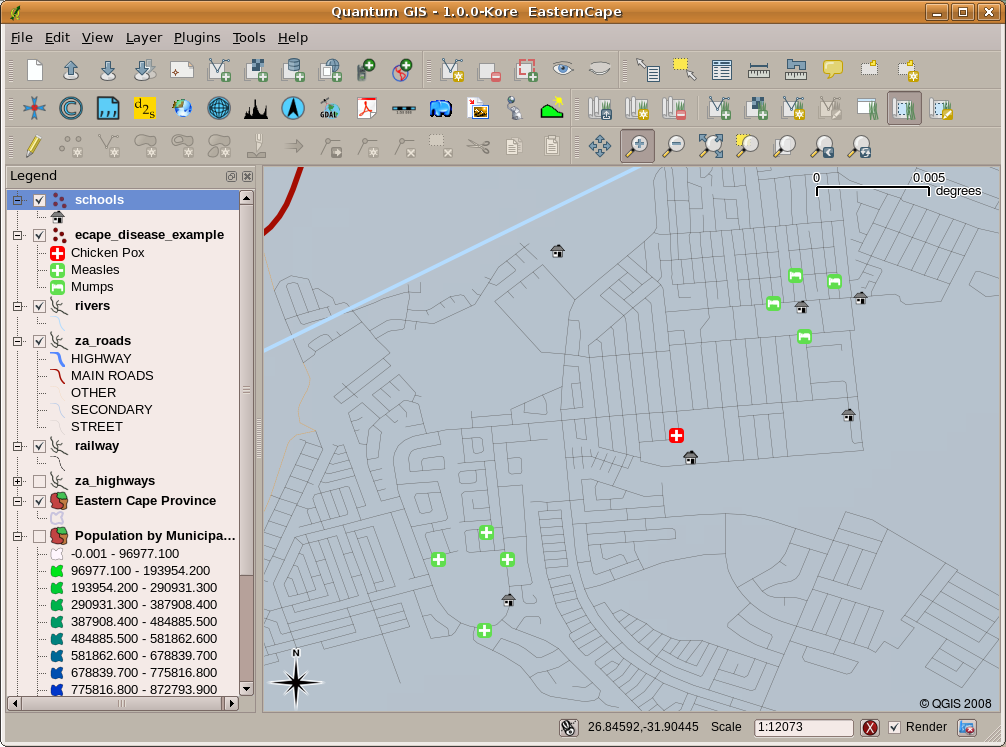
Рис. 2.11 Пример, показывающий данные о болезнях в ГИС приложении. Легко видеть, что больные свинкой живут рядом друг с другом.
2.2. Подробнее о ГИС
GIS is a relatively new field — it started in the 1970’s. It used to be that computerised GIS was only available to companies and universities that had expensive computer equipment. These days, anyone with a personal computer or laptop can use GIS software. Over time GIS Applications have also become easier to use — it used to require a lot of training to use a GIS Application, but now it is much easier to get started in GIS even for amateurs and casual users. As we described above, GIS is more than just software, it refers to all aspects of managing and using digital geographical data. In the tutorials that follow we will be focusing on GIS Software.
2.3. Что такое ПО ГИС / ГИС-приложение?
You can see an example of what a GIS Application looks like in Рис. 2.11. GIS Applications are normally programs with a graphical user interface that can be manipulated using the mouse and keyboard. The application provides menus near to the top of the window (Project, Edit, etc.) which, when clicked using the mouse, show a panel of actions. These actions provide a way for you to tell the GIS Application what you want to do. For example you may use the menus to tell the GIS Application to add a new layer to the display output, as in Рис. 2.12.
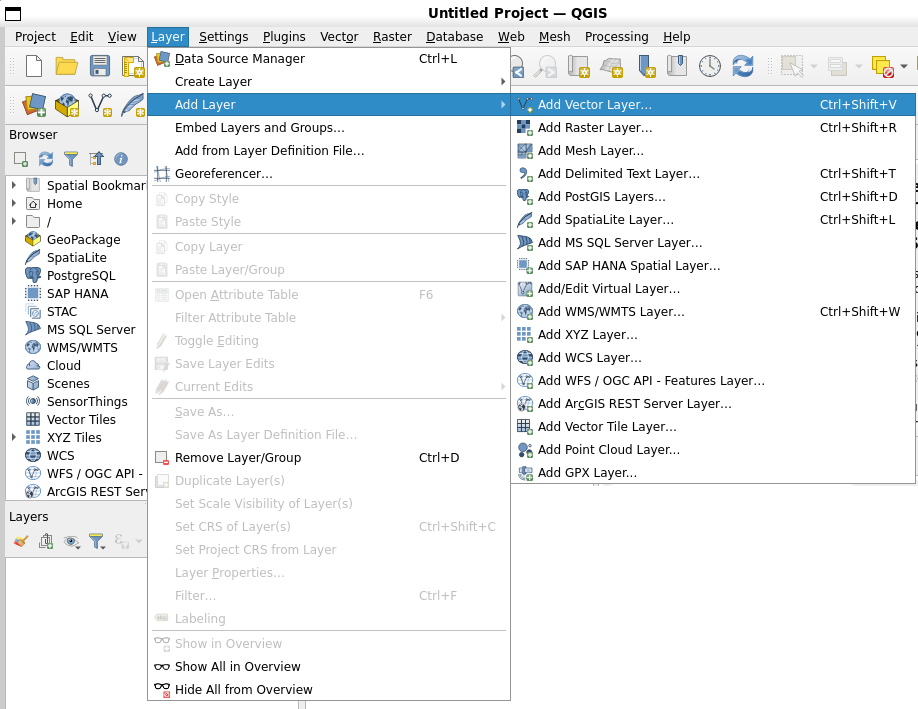
Рис. 2.12 При щелчке мышью меню приложения раскрывается и отображает список действий, которые можно выполнить.
As seen in Рис. 2.13, toolbars (rows of small pictures that can be clicked with the mouse) normally sit just below the menus and provide a quicker way to use frequently needed actions.
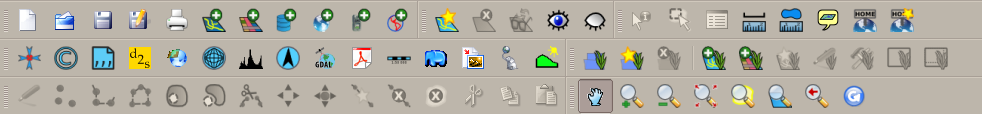
Рис. 2.13 Панели инструментов предоставляют быстрый доступ к наиболее востребованным функциям. Задержав курсор над кнопкой, как правило, можно получить краткое описание её назначения.
A common function of GIS Applications is to display map layers. Map layers are stored as files on a disk or as records in a database. Normally each map layer will represent something in the real world — a roads layer for example will have data about the street network.
When you open a layer in the GIS Application it will appear in the map view. The map view shows a graphic representing your layer. When you add more than one layer to a map view, the layers are overlaid on top of each other. Look at figures Рис. 2.14, Рис. 2.15, Рис. 2.16 and Рис. 2.17 to see a map view that has several layers being added to it.

Рис. 2.14 A towns layer added to the map view
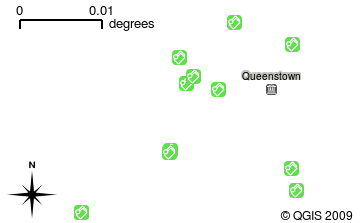
Рис. 2.15 A schools layer added to the map view
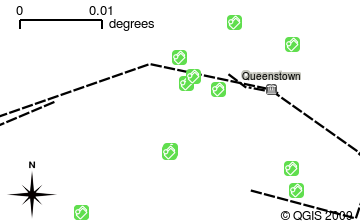
Рис. 2.16 A railways layer added to the map view
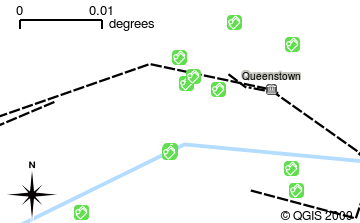
Рис. 2.17 A rivers layer added to the map view
An important function of the map view is to allow you to zoom in to magnify, zoom out to see a greater area and move around (panning) in the map. GIS software also lets you easily change symbology — the way information is displayed. Рис. 2.18 shows the map view after panning to the side and changing the symbology of the layers.
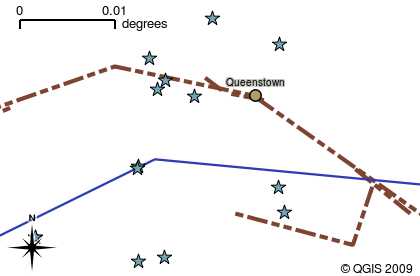
Рис. 2.18 A map view after moving around (panning) and changing the symbology
Another common feature of GIS Applications is the map legend. The map legend provides a list of layers that have been loaded in the GIS Application. Unlike a paper map legend, the map legend or „layers list“ in the GIS Application provides a way to re-order, hide, show and group layers. Changing the layer order is done by clicking on a layer in the legend, holding the mouse button down and then dragging the layer to a new position. In Рис. 2.19 and Рис. 2.20, the map legend is shown as the area to the left of the GIS Application window. By changing the layer order, the way that layers are drawn can be adjusted — in this case so that rivers are drawn below the roads instead of over them.
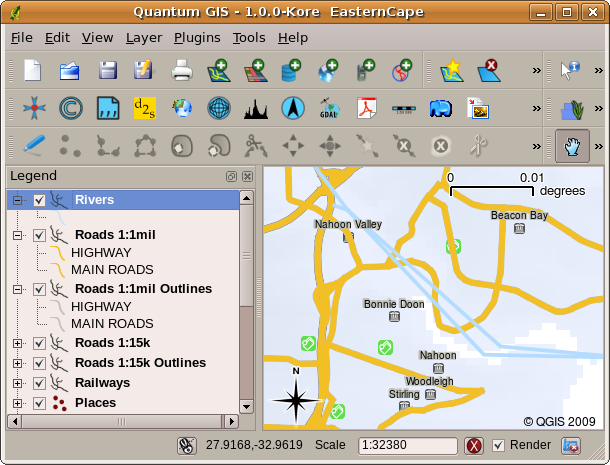
Рис. 2.19 Changing the layer order allows to adjust the way that layers are drawn. Before changing the layer order, rivers are drawn on top of roads
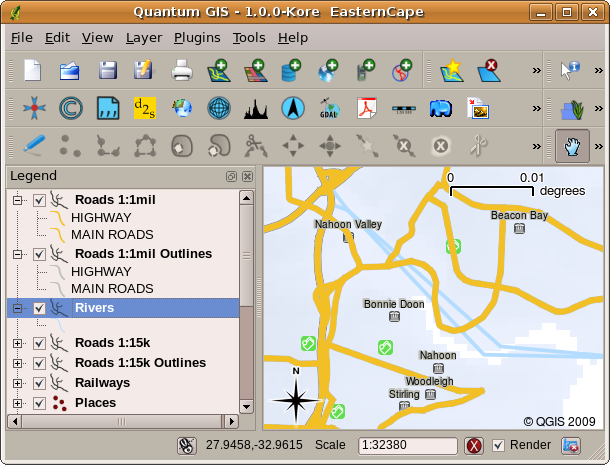
Рис. 2.20 Changing the layer order allows to adjust the way that layers are drawn. After changing the layer order, rivers are drawn underneath roads
2.4. Получение ГИС-приложения
There are many different GIS Applications available. Some have many sophisticated features and cost tens of thousands of Rands for each copy. In other cases, you can obtain a GIS Application for free. Deciding which GIS Application to use is a question of how much money you can afford and personal preference. For these tutorials, we will be using the QGIS Application. QGIS is completely free and you can copy it and share it with your friends as much as you like. If you received this tutorial in printed form, you should have received a copy of QGIS with it. If not, you can always visit https://www.qgis.org/ to download your free copy if you have access to the internet.
2.5. ГИС данные
Теперь, когда мы знаем что такое ГИС и что такое ГИС-приложение, поговорим о ГИС-данных. Данные это синоним слова информация. Информация, используемая в ГИС, как правило имеет географическую составляющую. Вспомните приводившийся пример о медицинском работнике. Он создал таблицу с заболеваниями, которая выглядит так:
Долгота |
Широта |
Заболевание |
Дата |
|---|---|---|---|
26.870436 |
-31.909519 |
Свинка |
13/12/2008 |
Столбцы с широтой и долготой содержат географические данные. Столбцы с названием болезни и датой содержат не географические данные.
A common feature of GIS is that they allow you to associate information (non-geographical data) with places (geographical data). In fact, the GIS Application can store many pieces of information which are associated with each place — something that paper maps are not very good at. For example, our health care worker could store the person’s age and gender on her table. When the GIS Application draws the layer, you can tell it to draw the layer based on gender, or based on disease type, and so on. So, with a GIS Application we have a way to easily change the appearance of the maps we created based on the non-geographical data associated with places.
GIS Systems work with many different types of data. Vector data are stored as
a series of X, Y coordinate pairs inside the computer’s memory. Vector data
are used to represent points, lines and areas. Рис. 2.21
shows different types of vector data being viewed in a GIS application. In the
tutorials that follow we will be exploring vector data in more detail.
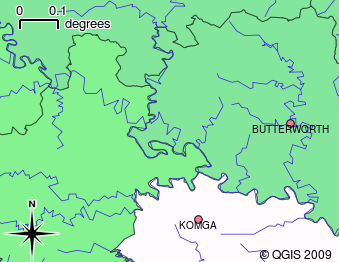
Рис. 2.21 Vector data are used to represent points (e.g., towns), lines (e.g., rivers) and polygons (e.g., municipal boundaries).
Raster data are stored as a grid of values. There are many satellites circling the earth and the photographs they take are a kind of raster data that can be viewed in a GIS. One important difference between raster and vector data is that if you zoom in too much on a raster image, it will start to appear „blocky“ (see Рис. 2.22 and Рис. 2.23). In fact these blocks are the individual cells of the data grid that makes up the raster image. We will be looking at raster data in greater detail in later tutorials.
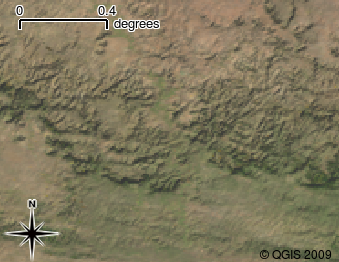
Рис. 2.22 Растровые данные это чаще всего спутниковые изображения. Здесь показаны горы Восточно-Капской провинции.
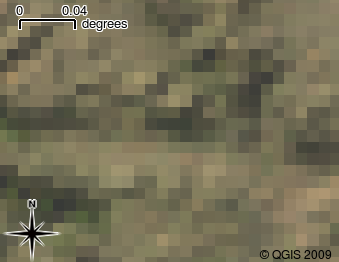
Рис. 2.23 Те же растровые данные, но увеличенные. Можно увидеть пиксельную сетку.
2.6. Что мы узнали?
Подведём итоги:
ГИС это система, состоящая из аппаратного обеспечения, программ и пространственных данных.
ГИС-приложение позволяют просматривать пространственные данные и являются важной частью ГИС.
ГИС-приложение как правило имеет меню, панели инструментов, область карты и легенду.
В ГИС-приложениях используются векторные и растровые данные.
Пространственные данные могут быть связаны с непространственными данными.
2.7. Попробуйте сами!
Вот некоторые идеи для заданий:
География: Опишите учащимся концепцию ГИС, как это сделано в этом разделе. Попросите их найти 3 причины по которым использование ГИС лучше обычных бумажных карт. Вот несколько подсказок:
ГИС-приложения позволяют создавать разные виды карт из одного и того же набора данных.
ГИС — отличный инструмент визуализации, который может показать различные аспекты данных и то как они связанны в пространстве (выше приводился пример со вспышками заболеваний).
Бумажные карты должны быть созданы, а для их просмотра требуется много времени. ГИС могут обрабатывать огромные объемы картографических данных и позволяют легко и быстро найти необходимый участок.
География: Попросите учащихся придумать примеры использования растровых данных со спутников. Наши подсказки:
В случае природных катаклизмов растровые данные могут быть полезны для поиска пострадавших областей. Например, снимок полученный во время наводнения позволит выявить районы, где люди нуждаются в спасении.
Sometimes people do bad things to the environment, like dumping dangerous chemicals that kill plants and animals. Using raster data from satellites can help us to monitor for these types of problems.
Спутниковые снимки могут использоваться при планировании городской застройки (рациональное использование инфраструктуры).
2.8. Стоит учесть
Если у вас нет компьютера, для объяснения большинства разделов можно использовать доску и прозрачную пленку, так как подход в наложении слоёв одинаков. Однако, для более полного понимания ГИС лучше все таки иметь компьютер.
2.9. Дополнительная литература
Книга: Desktop GIS: Mapping the Planet with Open Source Tools. Автор: Gary Sherman. ISBN: 9781934356067
Подробную информацию об использовании QGIS можно найти в Руководстве пользователя QGIS.
2.10. Что дальше?
В следующих разделах мы будем углублять полученные знания и учиться использовать ГИС-приложения. Все задания будут выполняться в QGIS. Давайте познакомимся с векторными данными!