중요
번역은 여러분이 참여할 수 있는 커뮤니티 활동입니다. 이 페이지는 현재 91.04% 번역되었습니다.
17.33. 공간 처리에 R 스크립트 사용하기
이 수업은 Scuola Superiore Sant’Anna 의 후원으로 마테오 게타(Matteo Ghetta)가 기고했습니다.
Processing (with the Processing R Provider plugin) makes it possible to write and run R scripts inside QGIS.
경고
여러분의 컴퓨터에 R가 설치되어 있어야 하고, PATH도 정확하게 설정되어 있어야 합니다. 게다가 공간 처리 프레임워크는 단지 외부 R 패키지들을 호출만 할 뿐이기 때문에, 공간 처리 프레임워크가 이 패키지들을 설치할 수는 없습니다. 따라서 R에 이 외부 패키지들을 직접 설치해줘야 합니다. 사용자 지침서에 있는 R 스크립트 생성하기 를 참조하세요.
참고
패키지 관련 문제가 발생하는 경우, 공간 처리 프레임워크가 요구하는, 예를 들어 sp, rgdal 및 raster 같은 필수 패키지들이 누락되었기 때문일 수도 있습니다.
17.33.1. 스크립트 추가하기
Adding a script is simple.
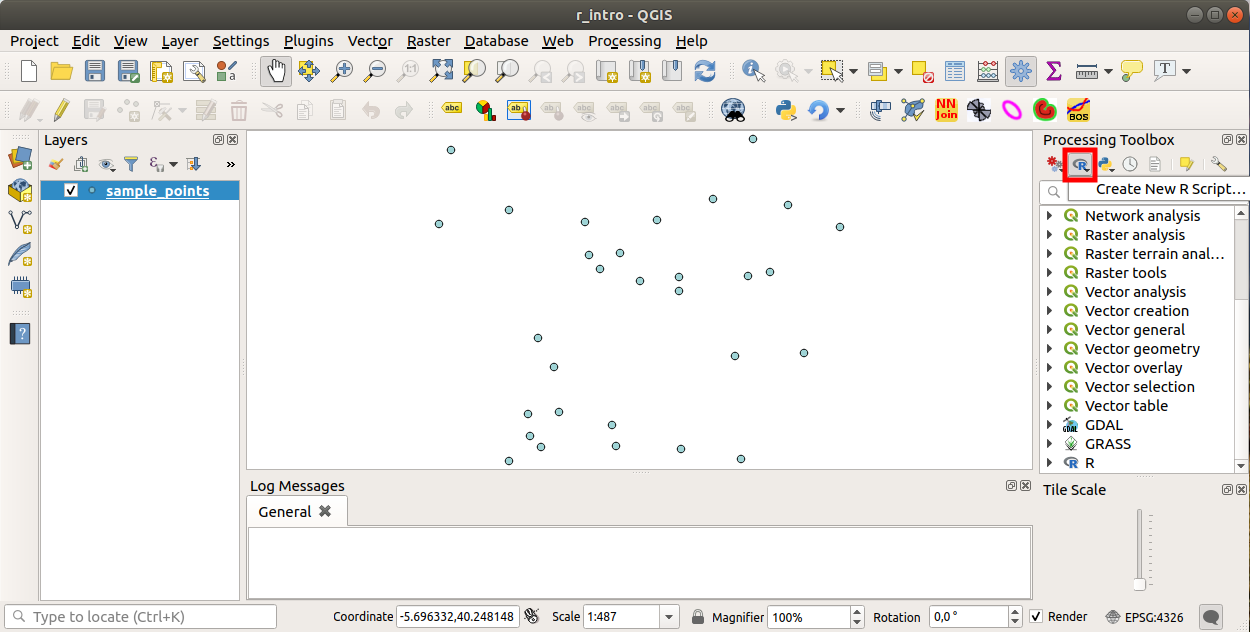
The easiest way is to open the Processing toolbox and choose
Create new R script… from the R menu (labelled with an
R icon) at the top of the Processing Toolbox.
You can also create the script in for instance a text editor and save it in
your R scripts folder (processing/rscripts).
When it has been saved there, it will be available for editing by
right-clicking on the script name in the processing toolbox and then choose
Edit Script…).
참고
공간 처리에서 R가 안 보일 경우, 메뉴에서 활성화시켜야 합니다.
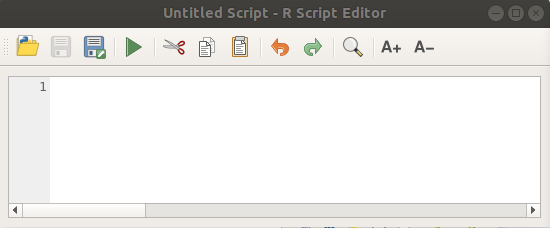
It opens a R Script Editor in which you have to specify some parameters before you can add the script body.
17.33.2. 그래프 생성하기
이번 예제에서 벡터 레이어 필드의 상자 수염 그림(boxplot) 을 생성할 것입니다.
exercise_data/processing/r_intro/ 폴더에 있는 r_intro.qgs QGIS 프로젝트를 여십시오.
스크립트 파라미터
편집기를 실행해서 스크립트 처음부터 입력하십시오.
스크립트 자체를 입력하기 전에 몇몇 파라미터들을 지정 해야만 합니다:
여러분의 스크립트가 들어가야 할 그룹의 이름 (이 경우엔 ‘plots’) (해당 그룹이 존재하지 않는 경우 생성할 것입니다):
##plots=group공간 처리 툴박스에 있는 plots R 그룹에서 여러분의 스크립트를 찾을 수 있을 것입니다.
(이 예제에서는) 공간 처리 프레임워크에 그래프를 표출하고 싶다고 말해주어야 합니다:
##showplots그러면 결과물 뷰어(Result Viewer) 패널에 있는 그래프를 가리키는 링크를 찾을 수 있을 것입니다. (이 패널은 메뉴에서 그리고 메뉴로 켜고끌 수 있습니다.)
공간 처리 프레임워크에 여러분의 입력 데이터에 대해서도 말해주어야 합니다. 이 예제에서는 벡터 레이어의 필드 하나로부터 그래프를 생성하고자 합니다:
##Layer=vector공간 처리 프레임워크가 이제 입력물이 벡터라는 사실을 알았습니다. ‘Layer’라는 이름은 중요하지 않습니다. 중요한 것은 vector 파라미터입니다.
마지막으로, 벡터 레이어의 입력 필드를 (앞에서 입력한 ‘Layer’라는 이름을 사용해서) 지정해줘야 합니다:
##X=Field Layer공간 처리 프레임워크가 이제 ‘Layer’의 필드 하나가 필요하다는 사실과, 해당 필드의 이름이 X 라는 사실을 알게 되었습니다.
name파라미터를 사용해서 여러분의 스크립트의 이름을 정의할 수도 있습니다:##My box plot script=name정의하지 않는 경우, 파일 이름을 스크립트 이름으로 사용할 것입니다.
스크립트 본문
이제 스크립트의 *머리말(heading)*를 설정했으니, 함수를 추가할 수 있습니다:
boxplot(Layer[[X]])
boxplot 은 R 함수의 이름이고, Layer 파라미터는 입력 데이터셋에 대해 정의한 이름이며, X 는 해당 데이터셋의 필드에 대해 정의한 이름입니다.
경고
X 파라미터는 이중 대괄호([[]])로 감싸야 합니다.
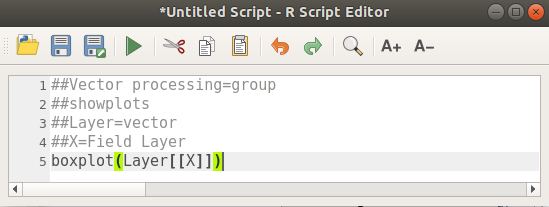
최종 스크립트는 다음과 같이 보일 것입니다:
##Vector processing=group
##showplots
##Layer=vector
##X=Field Layer
boxplot(Layer[[X]])
공간 처리 프레임워크가 제안하는 기본 경로(processing/rscripts)에 스크립트를 저장하십시오. 스크립트 머리말에 name 을 정의하지 않았다면, 공간 처리 툴박스에 여러분이 선택한 파일 이름이 스크립트 이름으로 나타날 것입니다.
참고
원하는 위치 어디에라도 스크립트를 저장할 수 있지만, 그러면 공간 처리 프레임워크가 공간 처리 툴박스에 해당 스크립트를 자동으로 포함시키지 못 할 것입니다. 즉 여러분이 직접 업로드해줘야 합니다.
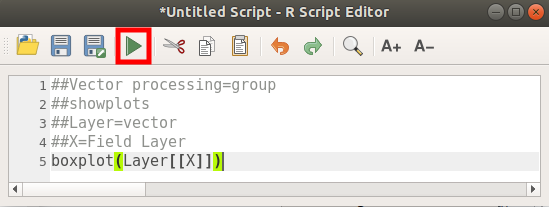
이제 편집기 창 최상단에 있는 버튼을 클릭해서 스크립트를 실행해보십시오:
편집기 창이 닫히고나면, 공간 처리 프레임워크의 텍스트란을 사용해서 여러분의 스크립트를 찾아보십시오:
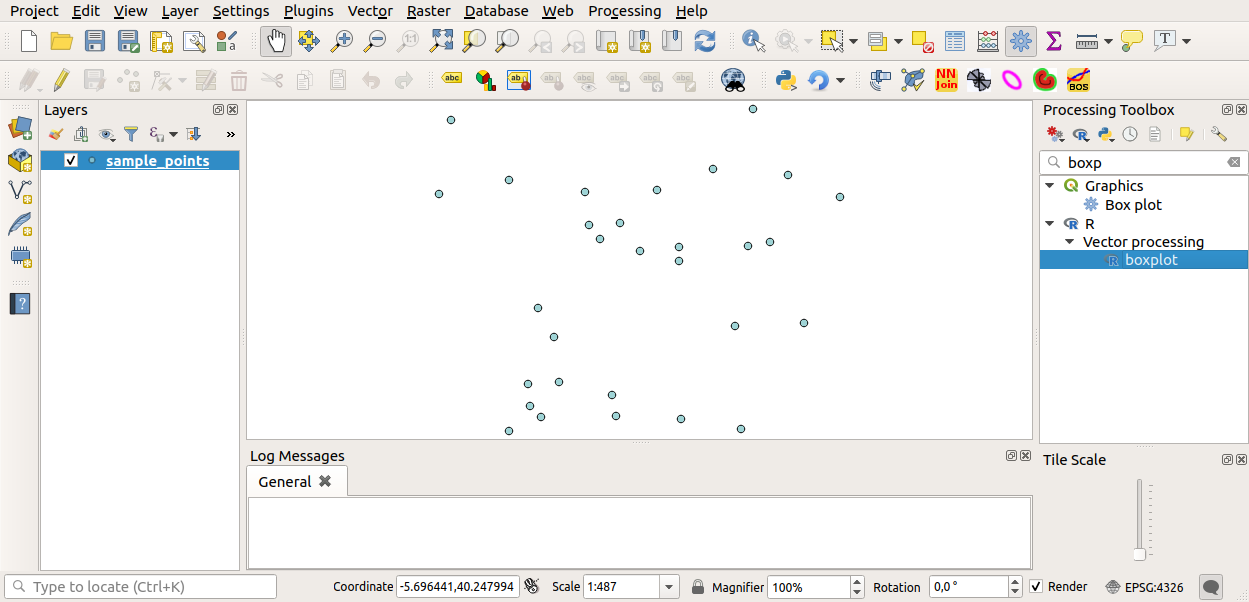
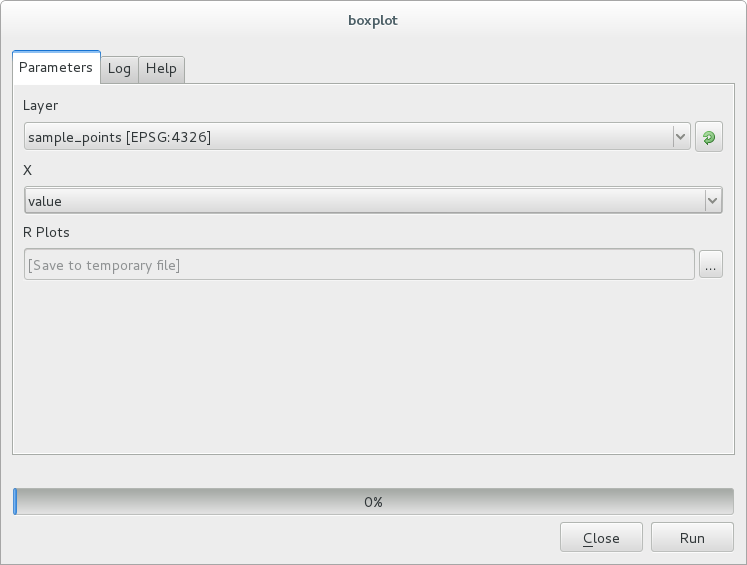
이제 공간 처리 알고리즘 창에서 요구하는 파라미터들을 채울 수 있습니다:
for Layer choose
sample_pointsfor the X field choose
value
Click on Run.
결과물 뷰어 가 자동으로 열릴 텐데, 열리지 않을 경우 메뉴 항목을 클릭하면 됩니다.
뷰어에 있는 링크를 클릭하면 다음을 보게 될 것입니다:
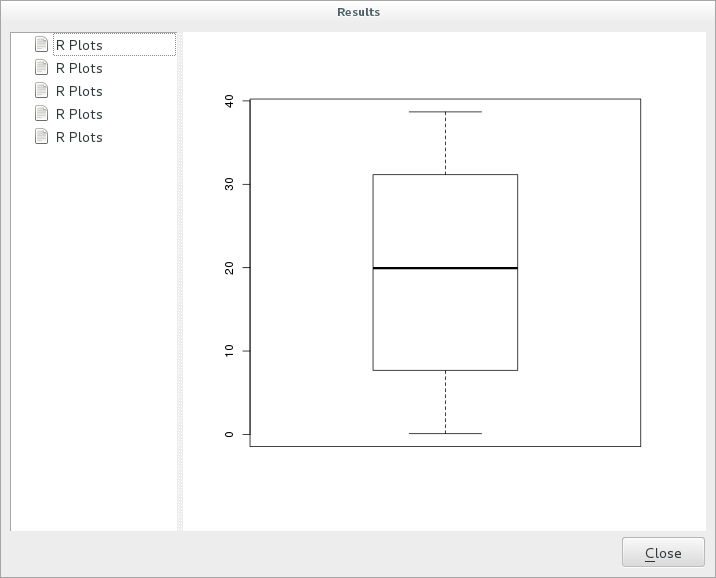
참고
그래프를 오른쪽 클릭하면 이미지를 열고, 복사하고, 저장할 수 있습니다.
17.33.3. 벡터 생성하기
벡터 레이어를 생성해서 QGIS에 자동으로 불러올 수도 있습니다.
다음 예시는 온라인 R 스크립트 모음에서 찾을 수 있는 Random sampling grid 스크립트로부터 발췌한 것입니다. (https://github.com/qgis/QGIS-Processing/tree/master/rscripts 에서 이 온라인 스크립트 모음을 찾을 수 있습니다.)
이 예시의 목적은 sp 패키지의 spsample 함수를 사용해서, 입력 벡터 레이어의 범위로 제한된 랜덤한 포인트 벡터 레이어를 생성하는 것입니다.
스크립트 파라미터
이전과 마찬가지로 스크립트 본문을 입력하기 전에 몇몇 파라미터들을 설정해줘야 합니다:
여러분의 스크립트가 들어가야 할 그룹 이름을 지정하십시오. 이 경우 ‘Point pattern analysis’입니다:
##Point pattern analysis=group랜덤한 포인트들의 배치를 제한하게 될 입력 파라미터(벡터 레이어)를 정의하십시오:
##Layer=vector생성될 포인트들의 개수에 대한 입력 파라미터를 (기본값이
10인Size를) 설정하십시오:##Size=number 10참고
기본값(
10)을 정의했기 때문에, 사용자가 이 숫자를 변경할 수도 있고, 또는 파라미터에 숫자를 지정하지 않아도 됩니다.(
Output이라는) 산출 벡터 레이어를 지정하십시오:##Output=output vector
스크립트 본문
이제 함수 본문을 추가할 수 있습니다:
spsample함수를 사용하십시오:pts=spsample(Layer, Size, type="random")
이 함수는 포인트들의 배치를 제한하기 위해 Layer 를 사용합니다. (해당 레이어가 라인 레이어인 경우, 포인트들이 레이어에 있는 라인 상에 생성되어야 하며, 폴리곤 레이어인 경우 포인트들이 폴리곤 내부에 생성되어야 합니다.) 생성될 포인트 개수는 Size 파라미터에서 가져옵니다. 샘플링 메소드는 random 입니다.
산출물을 (
Output파라미터를) 작성하십시오:Output=SpatialPointsDataFrame(pts, as.data.frame(pts))
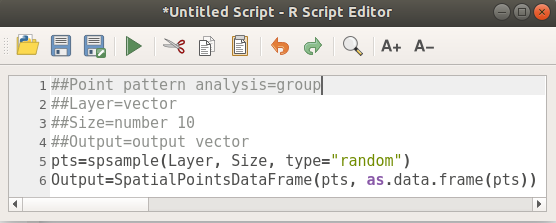
최종 스크립트는 다음과 같이 보일 것입니다:
##Point pattern analysis=group
##Layer=vector
##Size=number 10
##Output=output vector
pts=spsample(Layer, Size, type="random")
Output=SpatialPointsDataFrame(pts, as.data.frame(pts))
스크립트를 저장한 다음 실행 버튼을 눌러 실행하십시오.
새 창에서 파라미터들을 올바르게 입력하십시오:
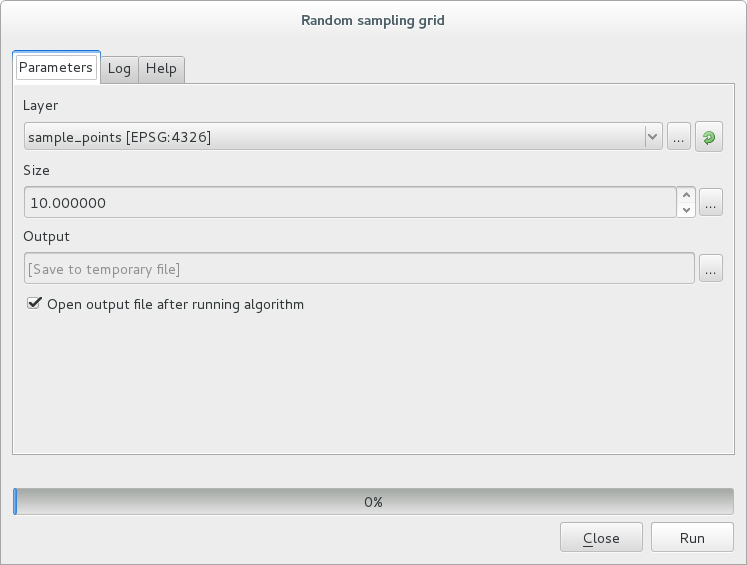
Run 버튼을 클릭합니다.
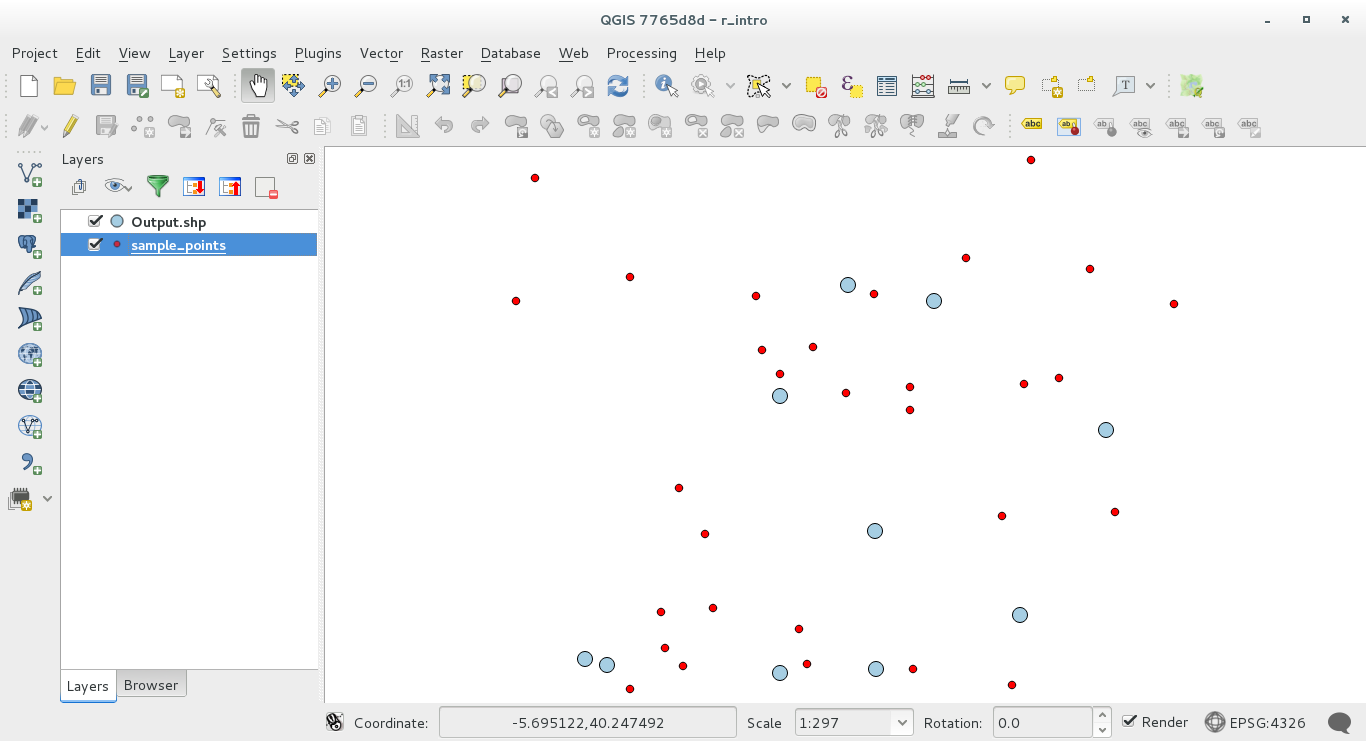
산출 레이어가 목차에 추가되고 그 포인트들이 맵 캔버스에 보일 것입니다:
17.33.4. R의 텍스트 및 그래프 산출물 - 문법
공간 처리 프레임워크는 (Processing R Provider plugin 을 통해) R로부터 결과물을 얻기 위해 특수 문법을 사용합니다:
명령어 앞에
>lillie.test(Layer[[Field]])처럼>를 삽입하는 것은 결과물을 R 산출물(결과물 뷰어)로 보내야 한다는 의미입니다.‘plot’ 뒤에
+를 삽입하면 그래프들을 중첩시킬 수 있습니다.plot(Layer[[X]], Layer[[Y]]) + abline(h=mean(Layer[[X]]))처럼 말이죠.