SensorThings API --- SensorThings API (SensorThings)
OGC services are increasingly being used to exchange geospatial data between
different GIS implementations and data stores. QGIS can deal with the above
specifications as a client, being SFS (through support of the PostgreSQL
data provider, see section PostgreSQL Database).
Maximum number of GetFeatureInfo results: specifies a default value
for the maximum number of results returned per layer by a GetFeatureInfo request
using this connection (see FEATURE_COUNT parameter).
Default value is 10.
Set to 0 to use server default value (usually 1): no FEATURE_COUNT parameter will be added to the request.
capabilitiesのGetMap/GetTile/GetLegendGraphic URI を無視: チェックした場合、上の URL フィールドからURIを使います。
The Maximum number of GetFeatureInfo results: specifies the maximum number of results
returned by a GetFeatureInfo request, for the layer(s) being loaded.
Allows to override the connection's default value for specific layers.
You can select several layers at once, but only one image style per layer.
When several layers are selected, they will be combined at the WMS server
and transmitted to QGIS in one go, as a single layer.
The default name is a slash (/) separated list of their original title.
You can however opt to Load as separate layers,
in which case each layer is added to the map canvas using its default name
from the queried service.
# in layer METADATA add which fields should be included and define geometry (example):"gml_include_items""all""ows_geometries""mygeom""ows_mygeom_type""polygon"# Then there are two possibilities/formats available, see a) and b):# a) basic (output is generated by Mapserver and does not contain XSD)# in WEB METADATA define formats (example):"wms_getfeatureinfo_formatlist""application/vnd.ogc.gml,text/html"# b) using OGR (output is generated by OGR, it is sent as multipart and contains XSD)# in MAP define OUTPUTFORMAT (example):OUTPUTFORMATNAME"OGRGML"MIMETYPE"ogr/gml"DRIVER"OGR/GML"FORMATOPTION"FORM=multipart"END# in WEB METADATA define formats (example):"wms_getfeatureinfo_formatlist""OGRGML,text/html"
Predefined date を使用して連続しない時間範囲のデータを公開しているサーバを指定するか、 Predefined range を使用して利用可能な日付範囲を公開しているサーバを指定します。後者の場合は Start date と End date が必須です。予想されるフォーマットは、プロバイダが連続した期間のデータを持っているかどうかに応じて、参照時間オプション(下記参照)から推測することができます。
Ignore GetCoverage URI reported in capabilities:
if checked, use given URI from the URL field above.
Ignore reported layer extents: because the extent
reported by raster layers may be smaller than the actual area which can
be rendered (notably for WCS servers with symbology which takes more space
than the data extent), check this option to avoid cropping raster layers
to their reported extents, resulting in truncated symbols on the borders
of these layers.
QGISでは、WFSレイヤは他のベクタレイヤとほとんど同じように振る舞います。地物を特定して選択することや、属性テーブルを表示することができます。QGISはWFS 1.0.0、1.1.0、2.0、OGC API - Features (OAPIF)をサポートしており、編集も可能です(WFS-Tを使用)。QGISは、バックグラウンド・ダウンロードとプログレッシブ・レンダリング、ダウンロードした地物のオンディスク・キャッシュ、バージョン自動検出もサポートしています。
OGC API - Features - Part 4: Create, Replace, Update and Delete <https://docs.ogc.org/DRAFTS/20-002.html>`_ を実装しているサーバーのレイヤは、編集モードにして、地物の作成、変更、削除を行うことができます。作成・変更・削除された地物はそれぞれ専用のネットワークリクエストを必要とするため、一度に数百以上の地物を同時に変更する場合、パフォーマンスが低下する可能性があることに注意してください。
In case of an OGC API - Features (OAPIF), the URL to provide should
be the landing page, i.e., the main page from which
it is possible to navigate to all the available service endpoints.
In the WFS Options group, you can:
サーバーのWFSバージョンを示します。不明な場合は 検出する ボタンを押すと自動的に取得されます。
Select the Preferred HTTP method to use for requests.
The default is GET, but you can also select POST.
Define the Maximum number of features retrieved in a single GetFetFeature request.
If empty, no limit is set.
Feature mode (simple vs complex): helps determine how to handle servers
serving data with simple or complex GML schemas. Available options are:
Default: if the server supports editing capabilities, this is the same
as using Simple Features. If not, it fallbacks to using Complex Features mode.
Simple Features: returns data as simple features only
Complex Features: uses the OGR GMLAS <https://gdal.org/en/stable/drivers/vector/gmlas.html>,
potentially returning complex features, depending on the data schema,
where nested data structures are exposed by QGIS as JSON.
Depending on the WFS version, indicate whether to:
Enable Feature paging and specify the maximum number of features
to retrieve with Page size.
If no limit is defined, then the server default is applied.
The query you build will appear after validation in the SQL column
within the WFS / OGC API - Features table, and the filtered layer will display
the icon next to it in the Layers panel.
It is thus possible to adjust the query at any moment.
Click Add to add the layer to the map,
using its default name from the queried service.
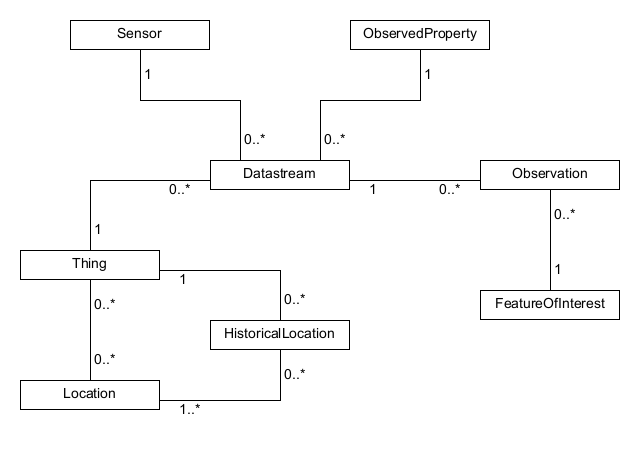
QGIS supports connections to OGC SensorThings API,
a standard providing an open and unified framework to interconnect IoT sensing devices,
data, and applications over the Web.
It is an open standard addressing the syntactic and semantic interoperability of the Internet of Things.
It is based on the Observations and Measurements data model,
a standardized model for observations, and for features involved in sampling when making observations.
To add SensorThings data to QGIS use the SensorThings
tab in the Data Source Manager dialog.
To establish a new connection, press New (or New SensorThings Connection
from the Browser panel) and provide Name and URL.
Advanced options, such as authentication and
a Referer, can also be configured.
Press OK to establish the connection.
Then you will be able to:
Configurations can be saved to an .XML file (Save)
through the SensorThings entry in Data Source Manager dialog
or its contextual menu in the Browser panel (Save Connections).
Likewise, configurations can be added from a file (Load).
Any type of entity can be loaded in QGIS, but not all are spatial data.
To load an entity, there are Layer Settings that can be configured:
Entity Type: the entity to load from the data model as layer in QGIS
Geometry Type: the geometry type of the selected entity to load.
Press Check available types to limit the list to the actually
supported geometry types.
Page Size
Feature Limit sets a maximum number of features to request from the service
Extent Limit sets a maximum extent limit for the layer, so that only features
within the extent are requested
Expansions: The data model of SensorThings provides a mechanism of expansion
of the results to related entities, similar to how tables are joined together in a relational database.
Using this approach, you can expand the selected layer to include data from other items.
This will flatten the relationship, creating as many parent features as children,
and additional properties are added as columns in the attribute table.
Use Filter to build a query to filter the data, using SensorThings filter syntax.
注釈
The above settings and filtering options are also available
for update in the layer properties dialog, Source tab, once loaded in QGIS.
Press Add to load the selected entity type as layer in QGIS.
A SensorThings layer is loaded in QGIS as a vector layer.
As such, it displays the same tabs in the layer properties
and allows same feature interactions using the selection or identify tools.
There are however some specificities you should consider while working with SensorThings data.
Because of the data model, the result property of a SensorThings Observation is a string field.
In case you want to use its numerical representation in for example a graduated style,
use an expression to convert the value to real and try() in case this fails
(e.g., try(to_real("Observation_result"),Null)).
In case you want to create a chart of the observations at one or more locations,
you can install the QGIS plugin Data Plotly.
Now select the observations at a point location in the map view.
Open the plotly panel and activate the Use only selected features checkbox.
Select on the x-column a date-time property and on the y-column the Observation_result.
This will plot the observations at that location over time.
Verify to filter by a single Observed Property.
Notice that the chart changes as soon as you select other locations on the map.
図 19.11 Use Data plotly to plot the air quality observations at a location
STAC (SpatioTemporal Asset Catalog) is a specification for describing geospatial
data in a consistent and accessible way. It defines a standard structure for organizing
and indexing spatial-temporal assets such as satellite imagery, drone photos, or sensor data
so that you can search, preview, and use these datasets across different platforms and tools.
STAC enables QGIS users to connect to and browse geospatial datasets, either from static catalogs
or dynamic APIs, and download or stream assets such as imagery or other spatial data.
STAC Items: The basic unit of a STAC catalog. Each item represents one geospatial
asset or a group of related assets (e.g. image bands) at a specific time and location.
It includes metadata such as geometry, datetime, links to assets (e.g., TIFFs, JSON, COG), and properties.
STAC Collections: A grouping of items that share common characteristics and metadata (e.g. satellite mission).
Collections may define spatial and temporal extents, licensing, and keywords.
STAC Catalogs: A hierarchical container that organizes items and/or collections.
Catalogs allow navigation of STAC datasets but do not necessarily include search capabilities.
STAC API: An implementation of the STAC specification that allows querying and filtering of STAC items using spatial
and temporal based filters, as well as searching within specific collections.
STAC APIs follow the OGC API - Features pattern and support dynamic access to datasets.
There is an important distinction between static STAC catalogs and STAC API endpoints:
Static STAC Catalogs: are collections of JSON files without search capabilities.
They can be browsed via the Browser panel.
STAC API: provide search capabilities and can be accessed in QGIS through both
the Browser panel and the Data Source Manager.
STAC connections can be added in QGIS using either the Browser panel or the Data Source Manager:
Browser Panel:
In the Browser panel, right-click on the STAC entry and select New STAC Connection....
In the dialog that appears, enter a Name for the connection, the URL of the STAC catalog
and optionally fill in Authentication credentials and a Referer.
Then click OK.
Use this method for browsing static STAC catalogs that do not support search or filtering.
Data Source Manager:
For STAC APIs you can use Data Source Manager dialog.
Open the Data Source Manager, choose the STAC tab
and click the New button.
Fill in the Name and URL fields, and (optional)
the Authentication credentials and a Referer.
Press OK and then
Connect to establish the connection, after that you will be able to:
Static STAC catalogs are displayed as hierarchical structures within the Browser panel.
Once connected, the STAC catalog appears under STAC in the Browser panel.
You can expand the catalog node to see its Collections.
Expanding a collection reveals the individual Items it contains.
図 19.13 STAC connection expanded in the Browser, showing Collections and Items
Right-click any STAC Item and choose Details... to view its metadata.
The details panel shows the item’s JSON content and a map of its coverage.
If an item’s asset is a cloud-optimized format (e.g. a .COG),
you can add it directly to the map canvas.
Otherwise, Download Assets... to save it locally before use.
Downloaded assets include the main dataset and any auxiliary files such as thumbnails or style files.
After download, use standard QGIS tools (e.g., Add Raster Layer...) to load and display the data.
An ArcGIS REST Server can host many different types of web services
(feature service, map service, image service, ...).
Read ArcGIS REST Serversを利用する for instructions to connect to an ArcGIS REST server.
When loading layers from an ArcGIS Feature Service,
symbols are automatically converted to QGIS-native symbology,
allowing QGIS to visually reproduce the same appearance as ArcGIS web maps.
Layers from an ArcGIS Feature Service can be editable in QGIS if:
The ArcGIS service has editing enabled
Your credentials grant write access
And the remote layer supports editing operations (Create, Update, or Delete capabilities).
If these options are disabled on the server, the layer will be read-only in QGIS.
Editing these layers follow the same procedure
as for other vector layers.
To update your map with the latest changes, use View ► Refresh or press F5.
If multiple users edit the same layer concurrently, it is recommended to refresh your data
before performing edits to avoid conflicts.
 WMS/WMTS タブに移動します:
 データソースマネージャを開く ボタンをクリック(または Ctrl+L を押)し、タブを有効化する
 WMSレイヤを追加する ボタンをクリックする
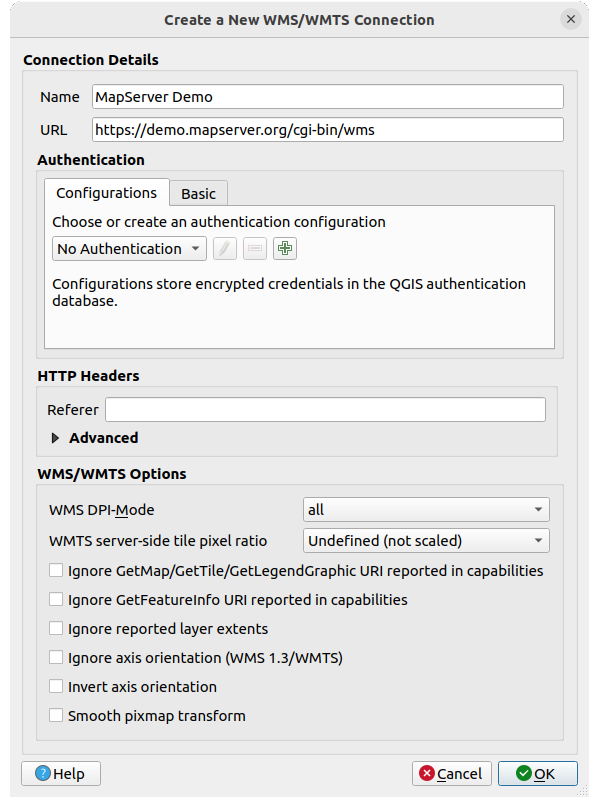
 capabilitiesのGetMap/GetTile/GetLegendGraphic URI を無視: チェックした場合、上の URL フィールドからURIを使います。
 ウェブアクセスにプロキシを使用 設定することで、プロキシ設定を追加しそれらを有効にできます。 プロキシタイプ
  ドロップダウンメニューから正しいプロキシタイプを選択していることを確認してください。
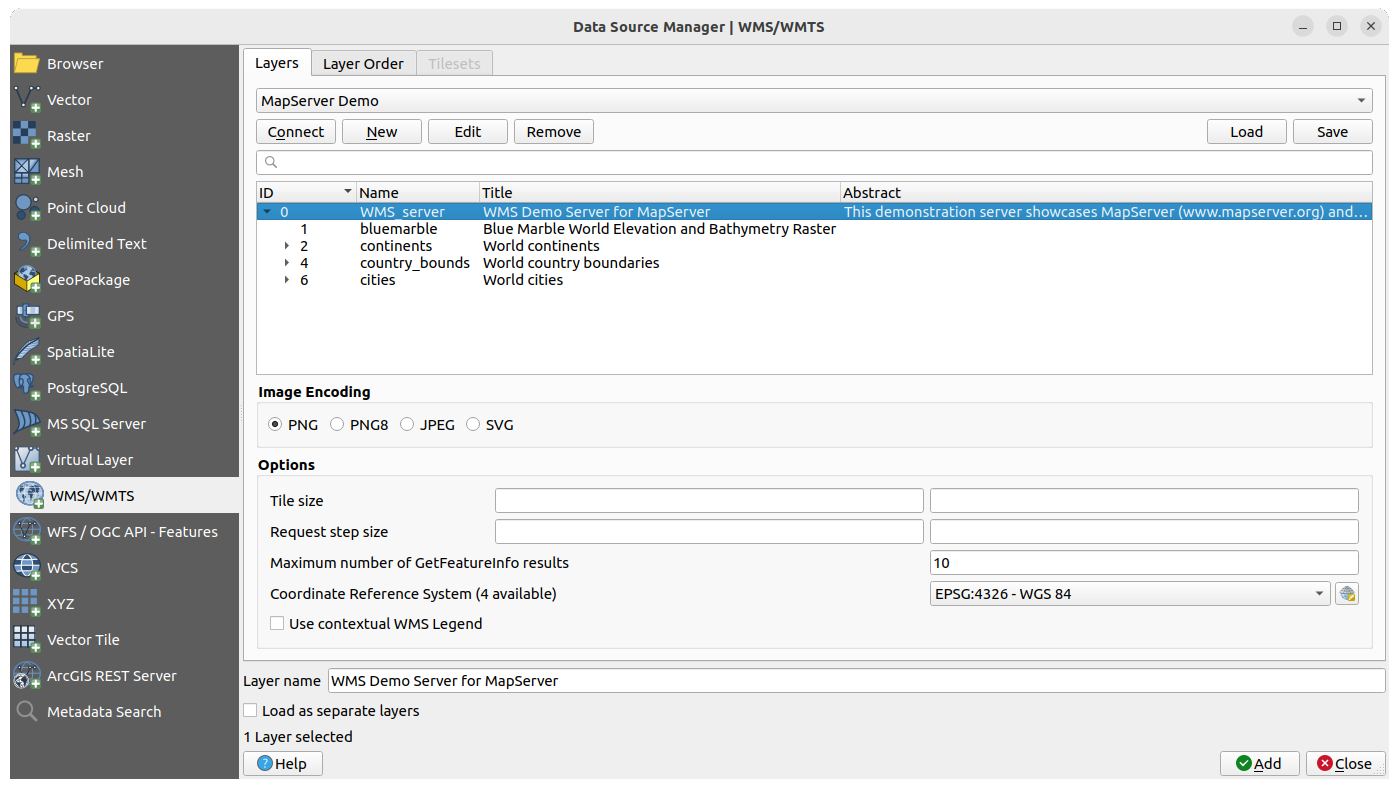
 ウィジェットを使ってフィルタできます。
 Select CRSを選択 ウィジェットを押して、WMSのデフォルトの投影法をWMSサーバーでサポートされている別のCRSに置き換えます。
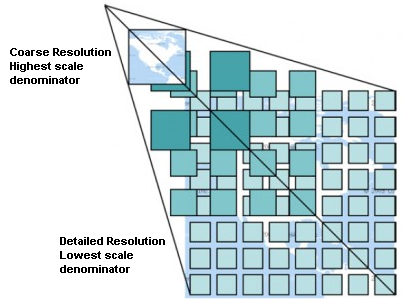
 )を選択し、 タイルスケールパネル を選びます。これにより、タイルサーバーから利用可能なスケールが、素敵なスライダーとともにドッキングして表示されます。
 識別 ツールを使ってマップキャンバス上のピクセルを選択できます。選択するたびにクエリがWMSサーバーに行われます。クエリの結果はテキスト形式で返されます。このテキストの書式は、使用される特定のWMSサーバーに依存します。
 Temporal Layer というアイコンが横に表示されます。その Temporal プロパティのデフォルトは 自動 時系列モードで、これはレイヤがデフォルトで 時系列コントローラー の現在の時間範囲に従うことを意味しています。
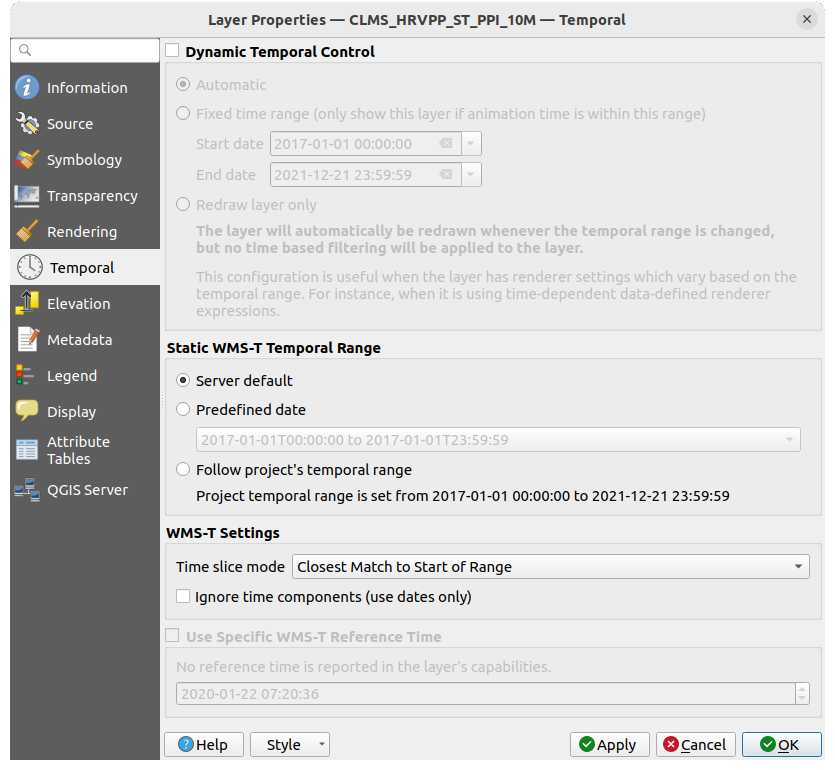
 ウェブカバレッジサービス(WCS)は、科学的モデルへの入力として、および他のクライアントのために、クライアント側のレンダリングに役立つ形でラスタデータへのアクセスを提供します。WCSはWFSとWMSと比較できます。WMSとWFSサービスインスタンスとして、WCSは、クライアントが、空間的な制約や他のクエリー基準に基づいて、サーバーの情報保有の部分を選択できます。
 WCS tab
 WFS / OGC API - 地物 タブを有効にします
 icon next to it in the Layers panel.
It is thus possible to adjust the query at any moment.
icon next to it in the Layers panel.
It is thus possible to adjust the query at any moment.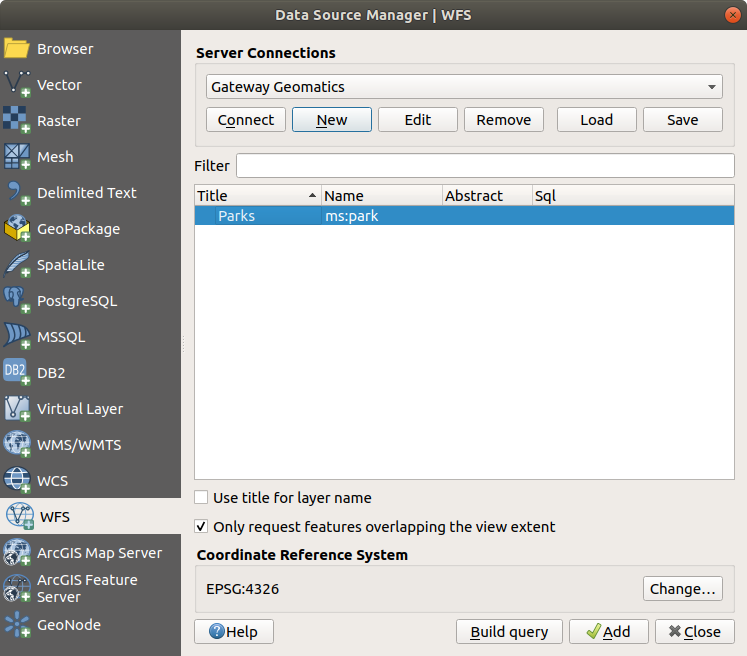
 SensorThings
tab in the Data Source Manager dialog.
SensorThings
tab in the Data Source Manager dialog.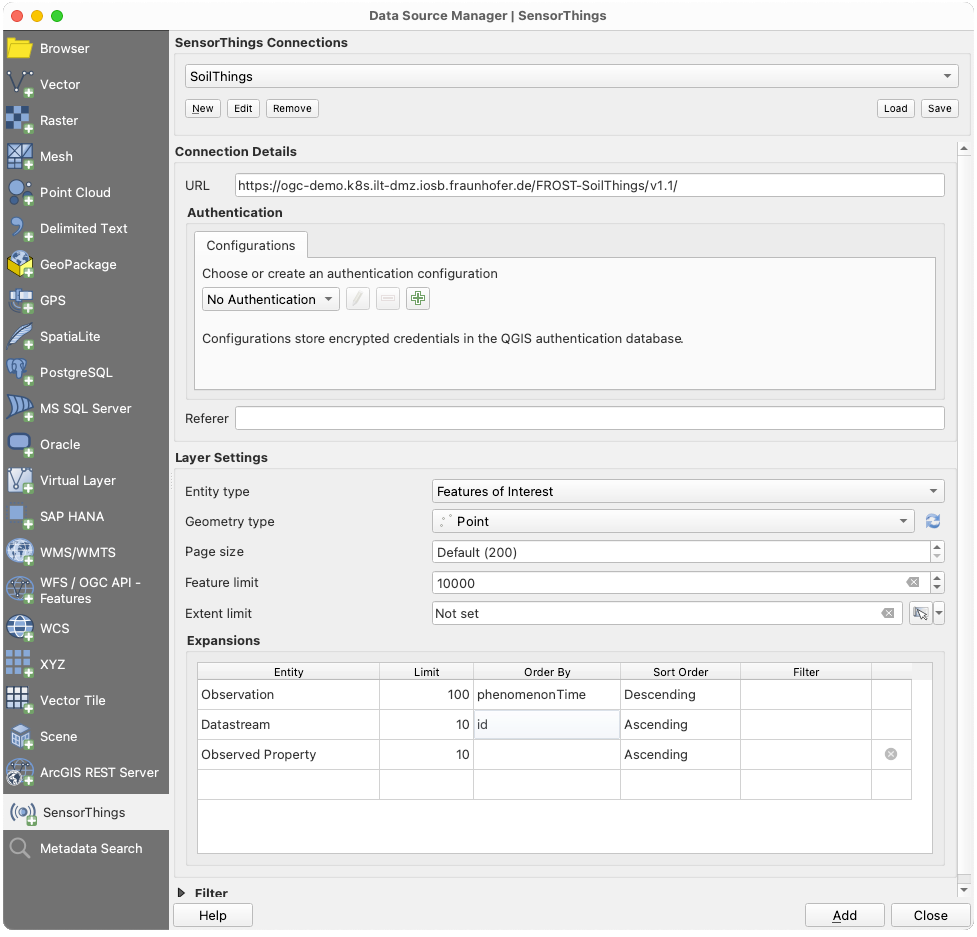
 Check available types to limit the list to the actually
supported geometry types.
Check available types to limit the list to the actually
supported geometry types.
 STAC entry and select New STAC Connection....
In the dialog that appears, enter a Name for the connection, the URL of the STAC catalog
and optionally fill in Authentication credentials and a Referer.
Then click OK.
STAC entry and select New STAC Connection....
In the dialog that appears, enter a Name for the connection, the URL of the STAC catalog
and optionally fill in Authentication credentials and a Referer.
Then click OK.


 Add Raster Layer...) to load and display the data.