Importante
Translation is a community effort you can join. This page is currently translated at 31.82%.
21. Working with 3D Tiles
21.1. What are 3D Tiles?
3D tiles are specification for streaming and rendering large-scale 3D geospatial datasets. They use a hierarchical structure to efficiently manage and display 3D content, optimising performance by dynamically loading appropriate levels of detail. This technology is widely used in urban planning, architecture, simulation, gaming, and virtual reality, providing a standardised and interoperable solution for visualising complex geographical data. Read Using 3D tiles services for more details.
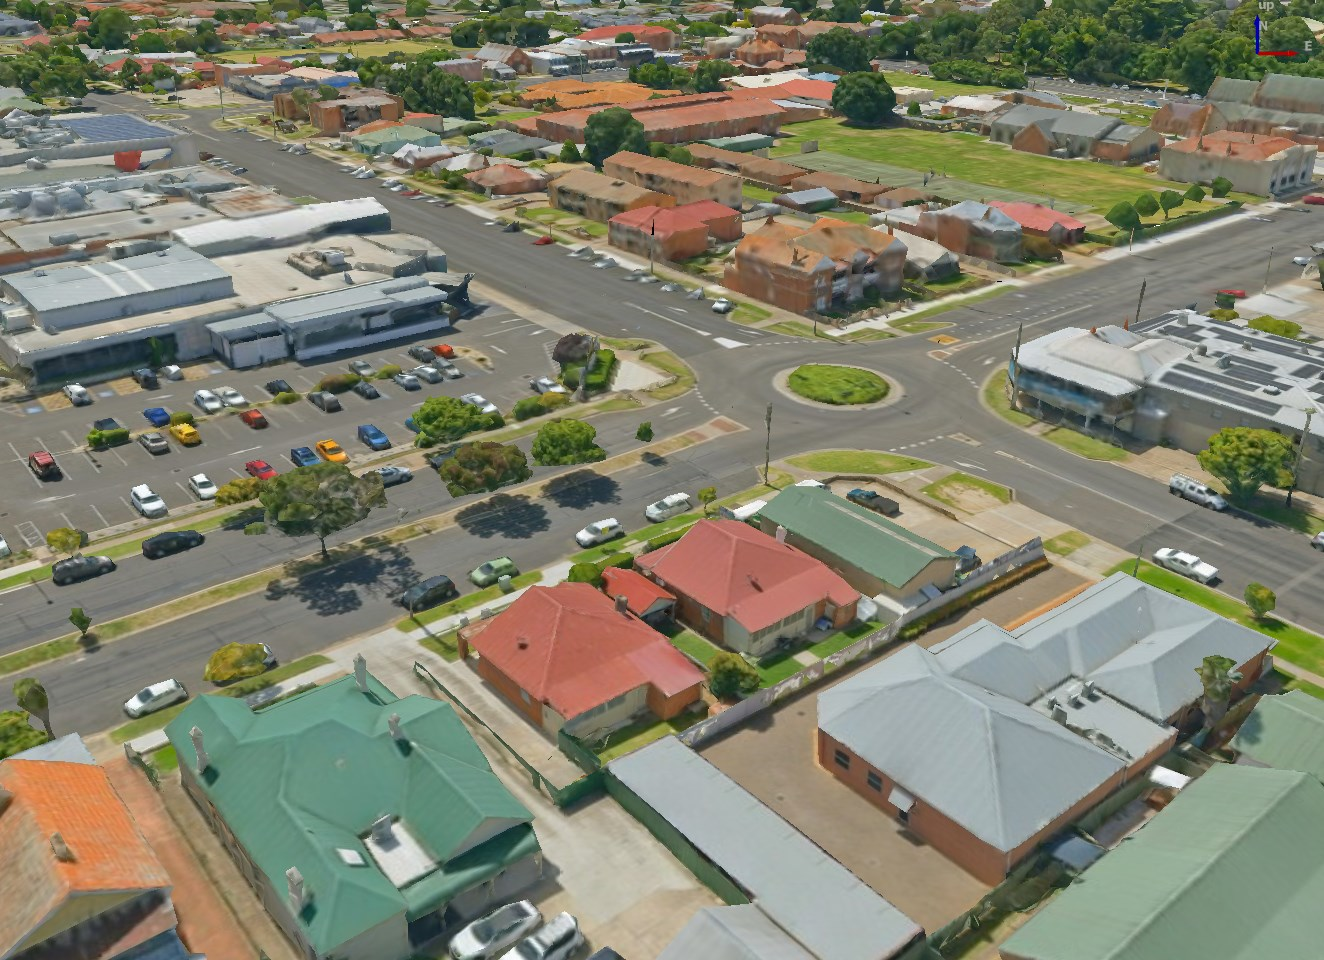
Fig. 21.1 Example of 3D tiles
21.2. Data Sources
Support for 3D tiles:
Remote source -
http://example.com/tileset.jsonLocal files -
file:///path/to/tiles/tileset.json
21.2.1. Using data from Cesium ion
Cesium ion is a cloud-based platform for managing and streaming 3D geospatial data. It simplifies data management, visualisation and sharing. To add 3D tiles from Cesium ion, you need to first sign up to their service here: https://ion.cesium.com.
You can also use Cesium ion plugin from the QGIS repository to add the data to QGIS.
21.2.2. Using Google 3D data
To use Google Photorealistic 3D tiles in QGIS, get an API key for 3D tiles. Once you have the key, simply add Google tiles using the same connection process.
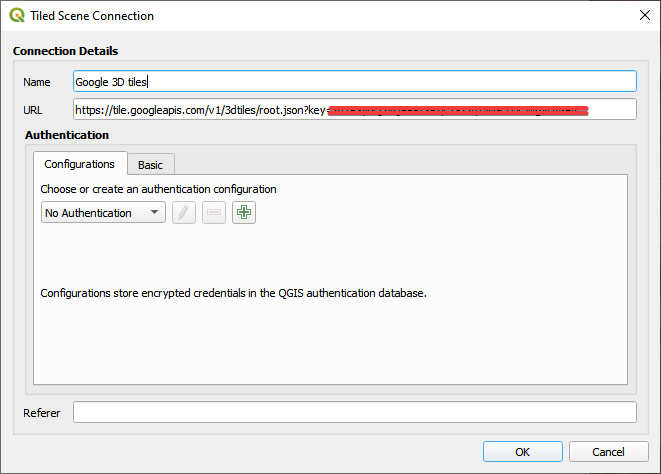
Fig. 21.2 Google 3D Tiles connection
21.3. 3D Tiles Properties
The 3D tiles Layer Properties dialog provides the following sections:
|
||
|
|
|


[1] Also available in the Layer styling panel
21.3.1. Propriedades da informação
The Information tab is read-only and represents an interesting place to quickly grab summarized information and metadata on the current layer. Provided information are:
based on the provider of the layer: name, URL, source type and path, number of zoom levels
o Sistema de Referência de Coordenadas: nome, unidades, método, precisão, referência (ou seja, se é estático ou dinâmico)
picked from the filled metadata: access, extents, links, contacts, history…
21.3.2. Propriedades de origem
The  Source tab displays basic information about
the selected 3D tile, including:
Source tab displays basic information about
the selected 3D tile, including:
o Nome da Camada para ser mostrado no Painel de Camadas;
the Coordinate Reference System: Displays the layer’s Coordinate Reference System (CRS). You can change the layer’s CRS, by selecting a recently used one in the drop-down list or clicking on the
 Select CRS button (see Seletor do Sistemas de Referência de Coordenadas).
Use this process only if the layer CRS is wrong or not specified.
Select CRS button (see Seletor do Sistemas de Referência de Coordenadas).
Use this process only if the layer CRS is wrong or not specified.
21.3.3. Propriedades da simbologia
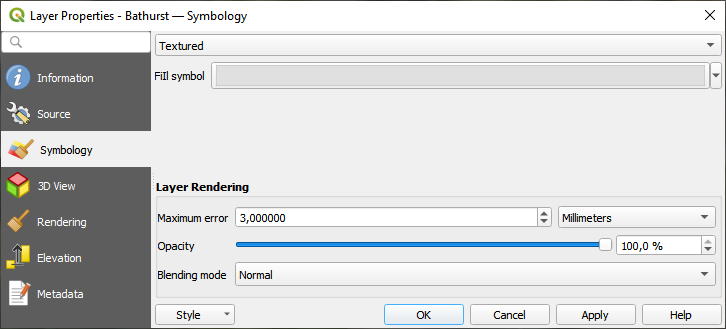
Fig. 21.3 3D Tile Layer Symbology
By default, the layer is styled using texture, but you can change it
to see the wireframe mesh behind the scene by choosing Wireframe
in the drop-down menu. You can also, change the mesh fill and line symbols
similar to the vector polygons.
Checking  Use texture colors will render each mesh element
with the average value of the full texture.
This is a good option to try when dealing with a large dataset and
want to get a quick overview of the data.
Use texture colors will render each mesh element
with the average value of the full texture.
This is a good option to try when dealing with a large dataset and
want to get a quick overview of the data.
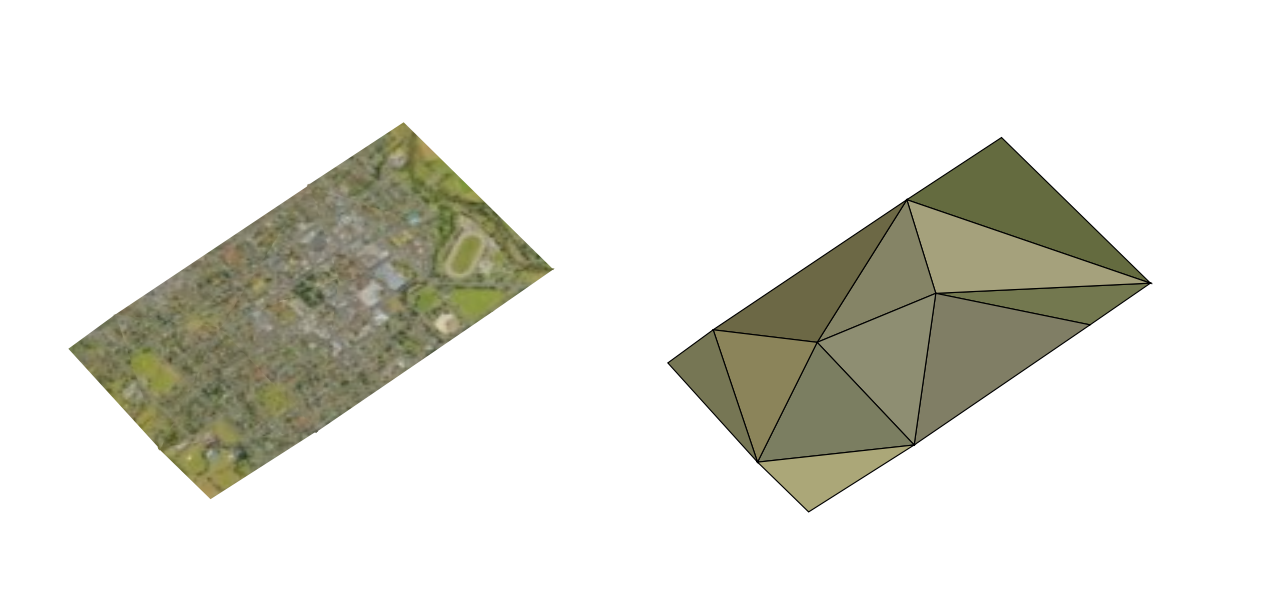
Fig. 21.4 3D Tiles - textured and wireframe
To view the data you can open  New 3D map view.
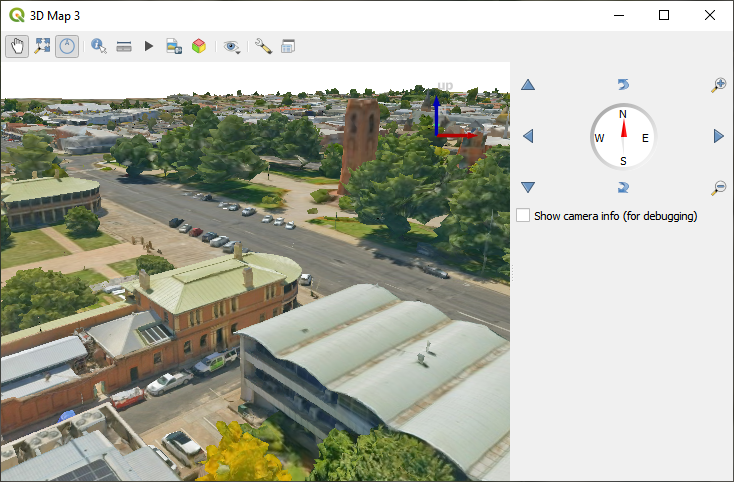
Fig. 21.5 Visualização de Mapa 3D
From the Symbology tab, you can also set some options that invariably act on all features of the layer:
Maximum error: This parameter determines the level of detail displayed in the 3D model. Similar to point clouds, 3D tiles often contain more information than necessary for visual representation. By adjusting this setting, you control the balance between display density and rendering speed. A larger value (e.g., 5 mm) may introduce noticeable gaps between elements, while a smaller value (e.g., 0.1 mm) could lead to the rendering of an excessive number of details, potentially slowing down the rendering process. Different units can be selected to tailor the setting to your specific needs.
Opacity: Adjust the visibility of the underlying layer on the map canvas using this tool. Use slider to tailor the visibility of your scene layer according to your preferences. Alternatively, specify the exact percentage of visibility through the menu next to the slider.
Blending mode: You can achieve special rendering effects with these tools that you may previously only know from graphics programs. The pixels of your overlaying and underlaying layers are mixed through the settings described in Modos de Mistura.
21.3.4. Propriedades da vista 3D
Maximum screen space error determines the threshold for swapping terrain tiles with more detailed ones (and vice versa) - i.e. how soon the 3D view will use higher quality tiles. Lower numbers mean more details in the scene at the expenses of increased rendering complexity.
 Show bounding boxes Show 3D bounding boxes of the
terrain tiles (useful for troubleshooting terrain issues).
Show bounding boxes Show 3D bounding boxes of the
terrain tiles (useful for troubleshooting terrain issues).
21.3.5. Propriedades de Renderização
Under Scale dependent visibility,
you can set the Maximum (inclusive)
and Minimum (exclusive) scales,
defining a range of scales in which features will be visible.
Out of this range, they are hidden.
The  Set to current canvas scale button helps you
use the current map canvas scale as boundary of the range visibility.
See Visibility Scale Selector for more information.
Set to current canvas scale button helps you
use the current map canvas scale as boundary of the range visibility.
See Visibility Scale Selector for more information.
21.3.6. Elevation Properties
The  Elevation tab provides options to control
the layer elevation properties within a 3D map view.
Specifically, you can set:
Elevation tab provides options to control
the layer elevation properties within a 3D map view.
Specifically, you can set:
Elevation Surface: how the 3D layer vertices Z values should be interpreted as terrain elevation. You can apply a Scale factor and an Offset.
21.3.7. Propriedades dos Metadados
The  Metadata tab provides you with options
to create and edit a metadata report on your layer.
See Metadados for more information.
Metadata tab provides you with options
to create and edit a metadata report on your layer.
See Metadados for more information.