Importante
A tradução é um esforço comunitário você pode contribuir. Esta página está atualmente traduzida em 16.44%.
10.2. O Seletor de Símbolos
The Symbol selector is the main dialog to design a symbol. You can create or edit Marker, Line or Fill Symbols.
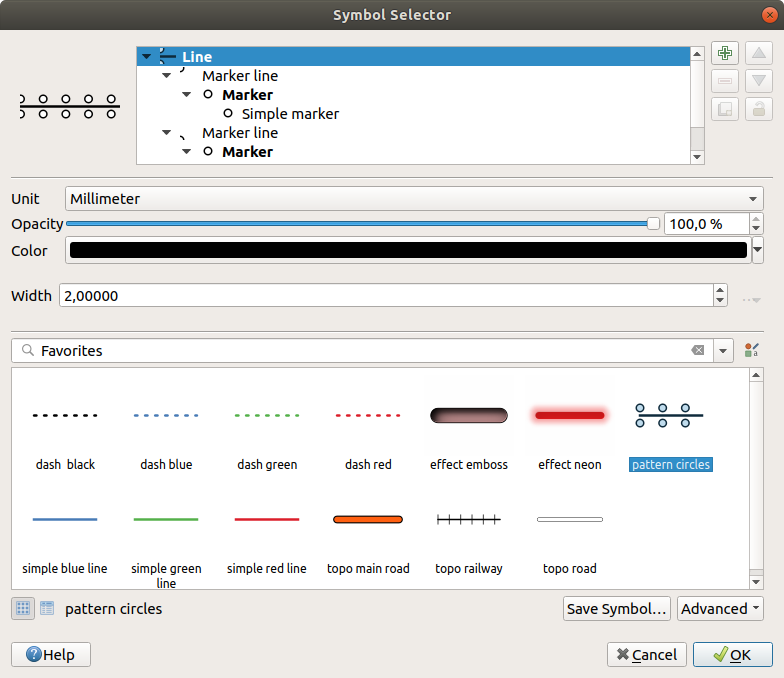
Fig. 10.10 Designing a Line symbol
Two main components structure the symbol selector dialog:
the symbol tree, showing symbol layers that are combined afterwards to shape a new global symbol
and settings to configure the selected symbol layer in the tree.
10.2.1. The symbol layer tree
A symbol can consist of several Symbol layers. The symbol tree shows the overlay of these symbol layers that are combined afterwards to shape a new global symbol. Besides, a dynamic symbol representation is updated as soon as symbol properties change.
Depending on the level selected in the symbol tree items, various tools are made available to help you manage the tree:
 add new symbol layer: you can stack as many symbols as you want
 remove the selected symbol layer
lock colors of symbol layer: a
 locked color stays unchanged when
user changes the color at the global (or upper) symbol level
locked color stays unchanged when
user changes the color at the global (or upper) symbol level duplicate a (group of) symbol layer(s)
move up or down the symbol layer
10.2.2. Configurando um símbolo
In QGIS, configuring a symbol is done in two steps: the symbol and then the symbol layer.
10.2.2.1. O símbolo
At the top level of the tree, it depends on the layer geometry and can be of Marker, Line or Fill type. Each symbol can embed one or more symbols (including, of any other type) or symbol layers.
You can setup some parameters that apply to the global symbol:
Unit: it can be Millimeters, Points, Pixels, Meters at Scale, Map units or Inches (see Seletor de Unidade for more details)
Opacidade
Color: when this parameter is changed by the user, its value is echoed to all unlocked sub-symbols color
Size and Rotation for marker symbols
Largura para símbolos de linha
Dica
Use the Size (for marker symbols) or the Width (for line symbols) properties at the symbol level to proportionally resize all of its embedded symbol layers dimensions.
Nota
The Data-defined override button next to the width, size or rotation parameters is inactive when setting the symbol from the Style manager dialog. When the symbol is connected to a map layer, this button helps you create proportional or multivariate analysis rendering.
A preview of the symbols library: Symbols of the same type are shown and, through the editable drop-down list just above, can be filtered by free-form text or by categories. You can also update the list of symbols using the
 Style Manager button and open the eponym dialog. There,
you can use any capabilities as exposed in Gerenciador de Estilo section.
Style Manager button and open the eponym dialog. There,
you can use any capabilities as exposed in Gerenciador de Estilo section.Os símbolos são exibidos:
in an icon list (with thumbnail, name and associated tags) using the
 List View button below the frame;
or as icon preview using the
 Icon View button.
Press the Save Symbol button to open the Save New Symbol dialog. Here, you can choose the Destination where you want to add the symbol being edited, give it a Name and add Tag(s). You also have the option to
 Add to favorites your new symbol.
With the Advanced
 option, you can:
for line and fill symbols, Clip features to canvas extent.
for fill symbols, Force right-hand rule orientation: allows forcing rendered fill symbols to follow the standard “right hand rule” for ring orientation (i.e, polygons where the exterior ring is clockwise, and the interior rings are all counter-clockwise).
The orientation fix is applied while rendering only, and the original feature geometry is unchanged. This allows for creation of fill symbols with consistent appearance, regardless of the dataset being rendered and the ring orientation of individual features.
for marker symbols, the Buffer settings… enables addition of a halo effect around the marker symbol in order to make it more readable against different backgrounds. The buffer is calculated and drawn using the shape of ALL the symbol layers in the marker. You can adjust the Size, Join style and Symbol of display.
for all symbol types, enable and configure a distance for the map canvas Extent buffer, or the Animation settings.
Depending on the symbology of the layer the symbol is being applied to, additional settings are available in the Advanced menu:
Symbol levels… to define the order of symbols rendering
Match to Saved Symbols… and Match to Symbols from File… to automatically assign symbols to classes
10.2.2.2. A camada de símbolo
At a lower level of the tree, you can customize the symbol layers. The available
symbol layer types depend on the upper symbol type. You can apply on the symbol
layer  paint effects to enhance its rendering.
Because describing all the options of all the symbol layer types would not be possible, only particular and significant ones are mentioned below.
Parâmetros comuns
Some common options and widgets are available to build a symbol layer, regardless it’s of marker, line or fill sub-type:
the color selector widget to ease color manipulation
Units: it can be Millimeters, Points, Pixels, Meters at Scale, Map units or Inches (see Seletor de Unidade for more details)
the
 Data-defined override widget near almost all options,
extending capabilities of customizing each symbol (see Data defined override setup for
more information)
Data-defined override widget near almost all options,
extending capabilities of customizing each symbol (see Data defined override setup for
more information)the
Enable symbol layer option controls the symbol layer’s
visibility. Disabled symbol layers are not drawn when rendering the symbol but
are saved in the symbol. Being able to hide symbol layers is convenient when
looking for the best design of your symbol as you don’t need to remove any for
the testing. The data-defined override then makes it possible to hide or
display different symbol layers based on expressions (using, for instance, feature attributes).the
Draw effects button for effects rendering.
Nota
While the description below assumes that the symbol layer type is bound to the feature geometry, keep in mind that you can embed symbol layers in each others. In that case, the lower level symbol layer parameter (placement, offset…) might be bound to the upper-level symbol, and not to the feature geometry itself.
Marker Symbols
Appropriate for point geometry features, marker symbols have several Symbol layer types:
Simple marker (default)
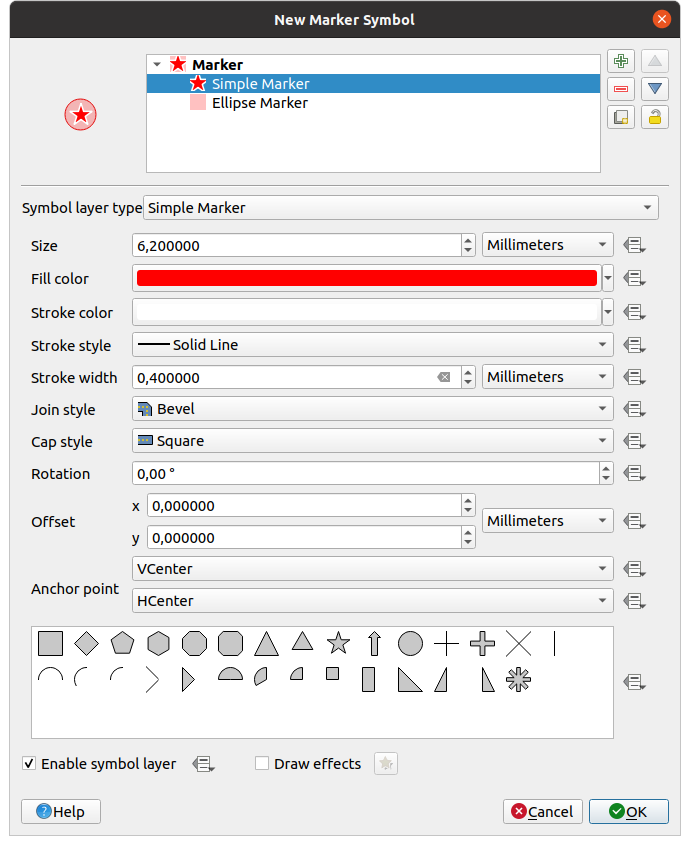
Fig. 10.11 Designing a Simple Marker Symbol
The simple marker symbol layer type has the following properties:
Tamanho em várias unidades suportadas
Fill color
Stroke color, Stroke style from a predefined list and Stroke size
Join style: it can be Bevel, Miter or Round
Cap style: it can be Square, Flat or Round
Rotação
Offset in X and Y directions from the feature
Anchor point: defining the quadrant point on the symbol to settle as placement origin. This is the point the Offset is applied on.
Animated marker (see Animated marker)
Ellipse marker: a simple marker symbol layer, with customizable width and height
Filled marker: similar to the simple marker symbol layer, except that it uses a fill sub symbol to render the marker. This allows use of all the existing QGIS fill (and stroke) styles for rendering markers, e.g. gradient or shapeburst fills.
Font marker: similar to the simple marker symbol layer, except that it uses installed fonts to render the marker. Its additional properties are:
Font family
Estilo de fonte
Character(s), representing the text to display as symbol. They can be typed in or selected from the font characters collection widget and you can live Preview them with the selected settings.
Geometry generator (see O Gerador de Geometria)
Mask: its sub-symbol defines a mask shape whose color property will be ignored and only the opacity will be used. This is convenient when the marker symbol overlaps with labels or other symbols whose colors are close, making it hard to decipher. More details at Propriedades das Máscaras.
Raster image marker: use an image (
PNG,JPG,BMP…) as marker symbol. The image can be a file on the disk, a remote URL, embedded in the style database (more details) or it can be encoded as a base64 string. Width and height of the image can be set independently or using the Lock aspect ratio. The size can be set using any of the
common units or as a percentage of the image’s original
size (scaled by the width).
Lock aspect ratio. The size can be set using any of the
common units or as a percentage of the image’s original
size (scaled by the width).Vector Field marker (see The Vector Field Marker)
SVG marker: provides you with images from your SVG paths (set in menu) to render as marker symbol. Width and height of the symbol can be set independently or using the
Lock aspect ratio. Each SVG file colors and stroke can
also be adapted. The image can be a file on the disk, a remote URL, embedded
in the style database (more details) or it can
be encoded as a base64 string.The symbol can also be set with Dynamic SVG parameters. See SVG parametrizável section to parametrize an SVG symbol.
Nota
SVG version requirements
QGIS renders SVG files that follow the SVG Tiny 1.2 profile, intended for implementation on a range of devices, from cellphones and PDAs to laptop and desktop computers, and thus includes a subset of the features included in SVG 1.1 Full, along with new features to extend the capabilities of SVG.
Some features not included in these specifications might not be rendered correctly in QGIS.
Símbolos de Linha
Appropriate for line geometry features, line symbols have the following symbol layer types:
Linha simples (padrão)
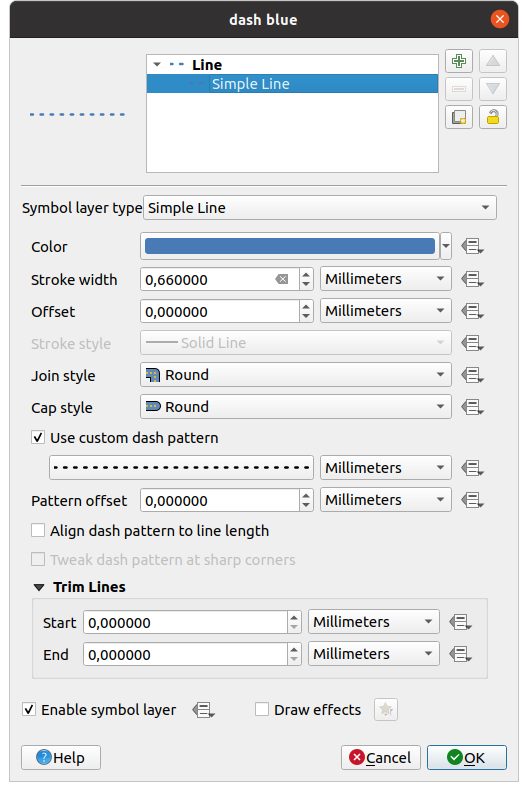
Fig. 10.12 Projetando um símbolo de linha simples
The simple line symbol layer type has many of the same properties as the simple marker symbol, and in addition:
- Use custom dash pattern: overrides the
Stroke style setting with a custom dash. You would need to
define length of consecutive dashes and spaces shaping the model,
in the chosen unit.
The total length of the pattern is displayed at the bottom of the dialog.
Pattern offset: the positioning of the dashes/spaces in the line can be tweaked, so that they can be placed at nicer positions to account for corners in the line (also can be used potentially to “align” adjacent dash pattern borders)
- Align dash pattern to line length: the dash pattern
length will be adjusted so that the line will end with a complete dash
element, instead of a gap.
- Tweak dash pattern at sharp corners: dynamically
adjusts the dash pattern placement so that sharp corners are represented
by a full dash element coming into and out of the sharp corner.
Dependent on Align dash pattern to line length.
Trim lines from Start and/or End: allows for the line rendering to trim off the first x mm and last y mm from the actual line string when drawing the line. It supports a range of units, including percentage of the overall line length, and can be data defined for extra control. The start/end trim distance can be used e.g. when creating complex symbols where a line layer should not overlap marker symbol layers placed at the start and end of the line.
Arrow: draws lines as curved (or not) arrows with a single or a double head with configurable (and data-defined):
Head type
Arrow type
Arrow width
Arrow width at start
Head length
Head thickness
Offset
It is possible to create
Curved arrows
(the line feature must have at least three vertices) and
Repeat arrow on each segment.
It also uses a fill symbol such as gradients or
shapeburst to render the arrow body. Combined with the geometry generator,
this type of layer symbol helps you representing flow maps.Geometry generator (see O Gerador de Geometria)
Interpolated line: allows to render a line whose Stroke width and/or Color may be constant (given a Fixed width and Single color parameters) or vary along the geometry. When varying, necessary inputs are:
guilabel:valor inicial e valor final: Valores que serão utilizados para interpolação nas extremidades da geometria das características. Eles podem ser valores fixos, atributos da característica ou baseados em uma expressão.
guilabel:Valor mínimo e Valor máximo: Valores entre os quais a interpolação é feita. Pressione o botão |recarregar| Carregar para preenchê-los automaticamente com base nos valores mínimos e máximos de início/fim aplicados à camada.
Only available for the stroke option:
Min. width and Max. width: define the range of the varying width. Min. width is assigned to the Min. value and Max. width to the Max. value. A unit can be associated.
- Use absolute value: only consider absolute value
for interpolation (negative values are used as positive).
- Ignore out of range: by default, when
the
[start value - end value]range of a feature is not included in the[min. value - max. value]range, the out-of-bounds parts of the feature’s geometry are rendered with the min or max width. Check this option to not render them at all.
For varying color, you can use any of the interpolation methods of color ramp classification
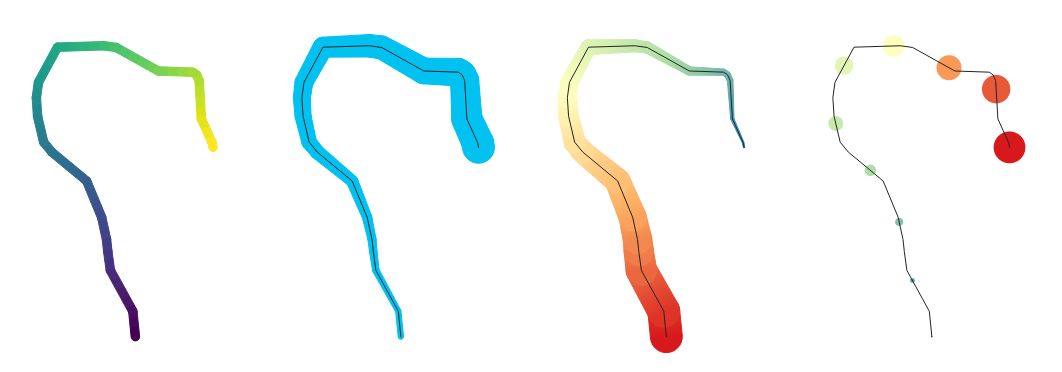
Fig. 10.13 Exemplos de linhas interpoladas
Marker line: repeats a marker symbol over the length of a line.
The Marker placement can be set using a regular interval setting (starting from the first vertex) and/or the line geometry property (on first or last vertex, inner vertices, the central point of the line or of each segment, or on every curve point).
When first or last vertex placement is enabled, the
Place on every part extremity option will make the markers
render also at the first or last vertex for every part of multipart geometries.Offset along line: the markers placement can also be given an offset along the line, in the ref:unit <unit_selector> of your choice (millimeters, points, map unit, meters at scale, percentage, …):
A positive value offsets the markers symbols in the line direction (with On first vertex and With interval placements) and backwards (with On last vertex placement).
A negative value on a not closed line will result in no offset (for On first vertex and On last vertex placements) or backwards offset of the symbols (from the last vertex).
With a closed ring, QGIS treats the offset as continuing to loop around the ring (forward or backward). E.g. setting the offset to 150% (resp. -10% or -110%) results in the offset being treated as 50% (resp. 90%) of the length of the closed ring.
The
Rotate marker to follow line direction option
sets whether each marker symbol should be oriented relative to the line
direction or not.Because a line is often a succession of segments of different directions, the rotation of the marker is calculated by averaging over a specified distance along the line. For example, setting the Average angle over property to
4mmmeans that the two points along the line that are2mmbefore and after the symbol placement are used to calculate the line angle for that marker symbol. This has the effect of smoothing (or removing) any tiny local deviations from the overall line direction, resulting in much nicer visual orientations of the marker line symbols.Line offset: the marker symbols can also be offset from the line feature.
Hashed line: repeats a line segment (a hash) over the length of a line symbol, with a line sub-symbol used to render each individual segment. In other words, a hashed line is like a marker line in which marker symbols are replaced with segments. As such, the hashed lines have the same properties as marker line symbols, along with:
Hash length
Hash rotation
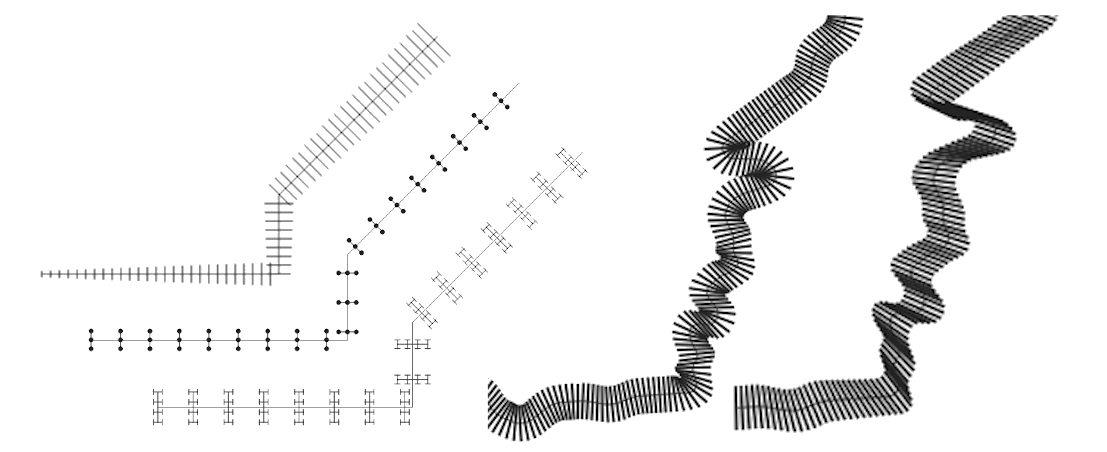
Fig. 10.14 Examples of hashed lines
Raster line: renders and repeats a raster image following the length of a line feature shape. The Stroke width, Offset, Join style, Cap style and Opacity can be adjusted.
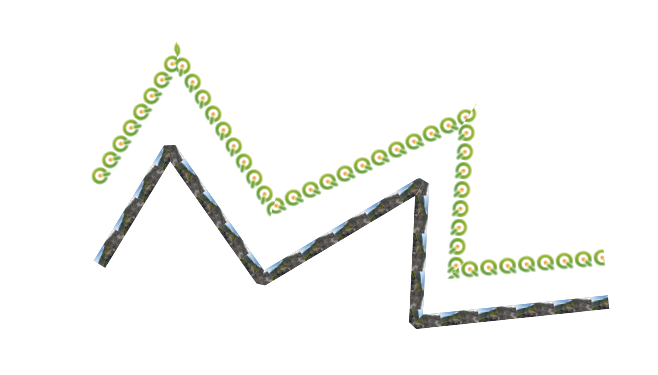
Fig. 10.15 Examples of raster lines
Linear referencing: allows placing text labels at regular intervals along a line, or at positions corresponding to existing vertices. Positions can be calculated using Cartesian distances, or interpolated from z/m values. Parameters include:
Measure placement: Labels can be placed at regular cartesian 2d distances, at regular linearly interpolated spacing calculated using the Z or M values in geometries, or at existing vertices. A fixed or data-defined Interval is given.
Quantity: Label displayed at each position represent the running distance along the line, or the linearly interpolated Z or M value. Labels are rendered using the full range of text and number formatting functionalities available in QGIS.
Nota
When using the distance-based placement or labels, the distances are calculated using 2D only. Cartesian calculations are based on the original layer CRS.
Skip multiples of: If set, labels which are a multiple of this value will be skipped over. This allows construction of complex referencing labels, e.g. where a symbol has two linear referencing symbol layers, one set to label every 100m in a small font, skipping multiples of 1000, and a second set to label every 1000m in a big bold font.
Average angle over: Labels are rendered using an angle calculated by averaging the linestring, so sharp tiny jaggies don’t result in unslightly label rotation.
Show marker symbols, at referenced points in the line feature, using a full QGIS marker symbol. This allows e.g. showing a cross-hatch at the labeled point, for a “ruler” style line.
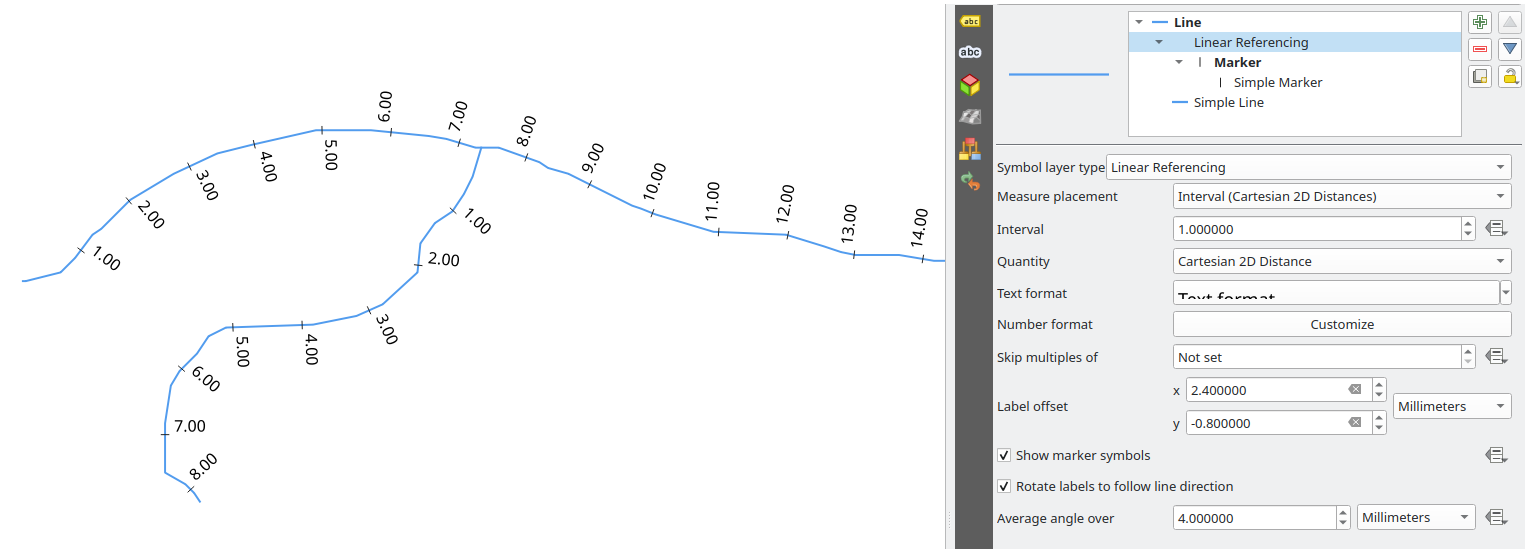
Fig. 10.16 Drawing linear labels along line feature
Lineburst: renders a gradient along the width of a line. You can choose between Two color or Color ramp and the Stroke width, Offset, Join style, Cap style can be adjusted.
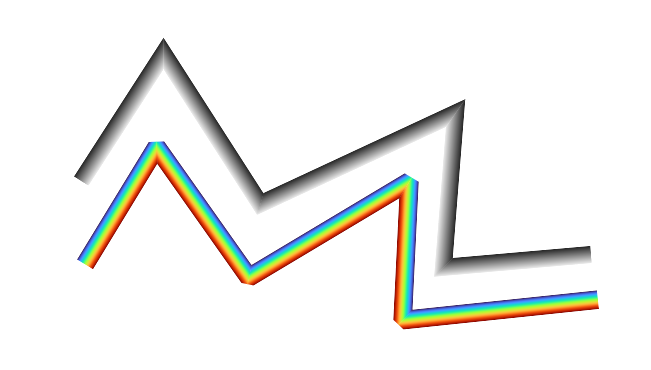
Fig. 10.17 Examples of lineburst lines
Filled line: renders the interior of the lines using a fill symbol allowing for lines filled with gradients, line hatches, etc. The Stroke width, Offset, Join style, Cap style can be adjusted.
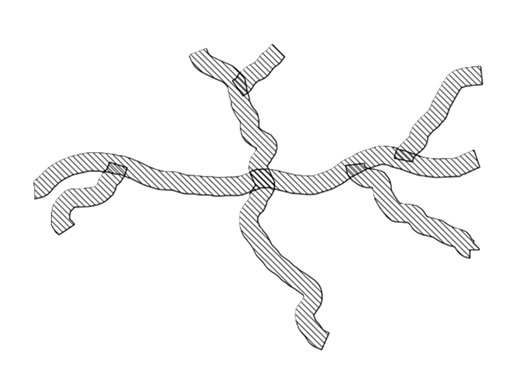
Fig. 10.18 Examples of filled lines
Símbolos de Preenchimento
Appropriate for polygon geometry features, fill symbols have also several symbol layer types:
For polygon interior |
For polygon ring |
|---|---|
Simple fill (default): fills a polygon with a uniform color
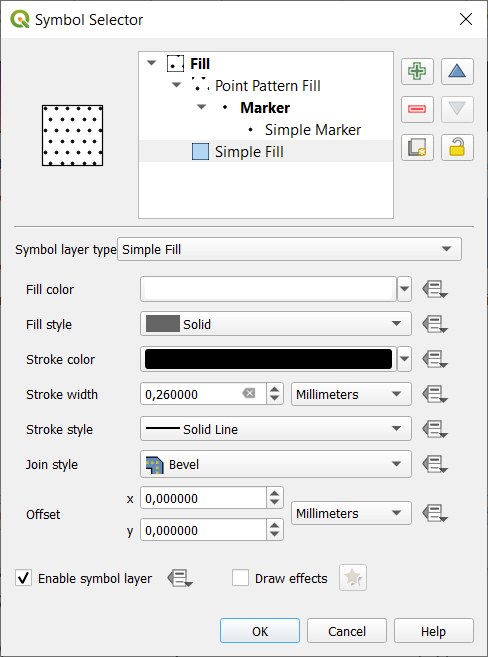
Fig. 10.19 Designing a Simple Fill Symbol
Centroid fill: places a marker symbol at the centroid of the visible feature. The position of the marker may not be the real centroid of the feature, because calculation takes into account the polygon(s) clipped to area visible in map canvas for rendering and ignores holes. Use the geometry generator symbol if you want the exact centroid.
Você pode:
guilabel: ‘Força o posicionamento de marcadores dentro de polígonos’.
Draw markers on every part of multi-part features or place the point only on its biggest part
display the marker symbol(s) in whole or in part, keeping parts overlapping the current feature geometry (Clip markers to polygon boundary) or the geometry part the symbol belongs to (Clip markers to current part boundary only)
Geometry generator (see O Gerador de Geometria)
Gradient fill: uses a radial, linear or conical gradient, based on either simple two color gradients or a predefined gradient color ramp to fill polygons. The gradient can be rotated and applied on a single feature basis or across the whole map extent. Also start and end points can be set via coordinates or using the centroid (of feature or map). A data-defined offset can be defined.
** Preenchimento padrão de linha**: preenche o polígono com um padrão de preenchimento camada de símbolo de linha. Você pode definir:
Alignment: defines how the pattern is positioned relative to the feature(s):
Align pattern to feature: lines are rendered within each feature
Align pattern to map extent: a pattern is rendered over the whole map extent, allowing lines to align nicely across features
Rotação das linhas, no sentido anti-horário
Espaçamento: distância entre linhas consecutivas
Offset distance of the lines from the feature boundary
Clipping: allows to control how lines in the fill should be clipped to the polygon shape. Options are:
Clip During Render Only: lines are created covering the whole bounding box of the feature and then clipped while drawing. Line extremities (beginning and end) will not be visible.
Clip Lines Before Render: lines are clipped to the exact shape of the polygon prior to rendering. Line extremities (including cap styles, start/end marker line objects, …) will be visible, and may sometimes extend outside of the polygon (depending on the line symbol settings).
No Clipping: no clipping at all is done - lines will cover the whole bounding box of the feature
Nota
When exporting maps to vector formats such as PDF or SVG, or when the line symbol in the pattern has data-defined properties, QGIS renders the line pattern fill using a line-by-line vector-based approach. This results in smaller output file sizes, higher quality exports, and improved editability of the pattern lines in external vector graphics applications.
Point pattern fill: fills the polygon with a grid pattern of marker symbol. You can set:
Alignment: defines how the pattern is positioned relative to the feature(s):
Align pattern to feature: marker lines are rendered within each feature
Align pattern to map extent: a pattern is rendered over the whole map extent, allowing markers to align nicely across features
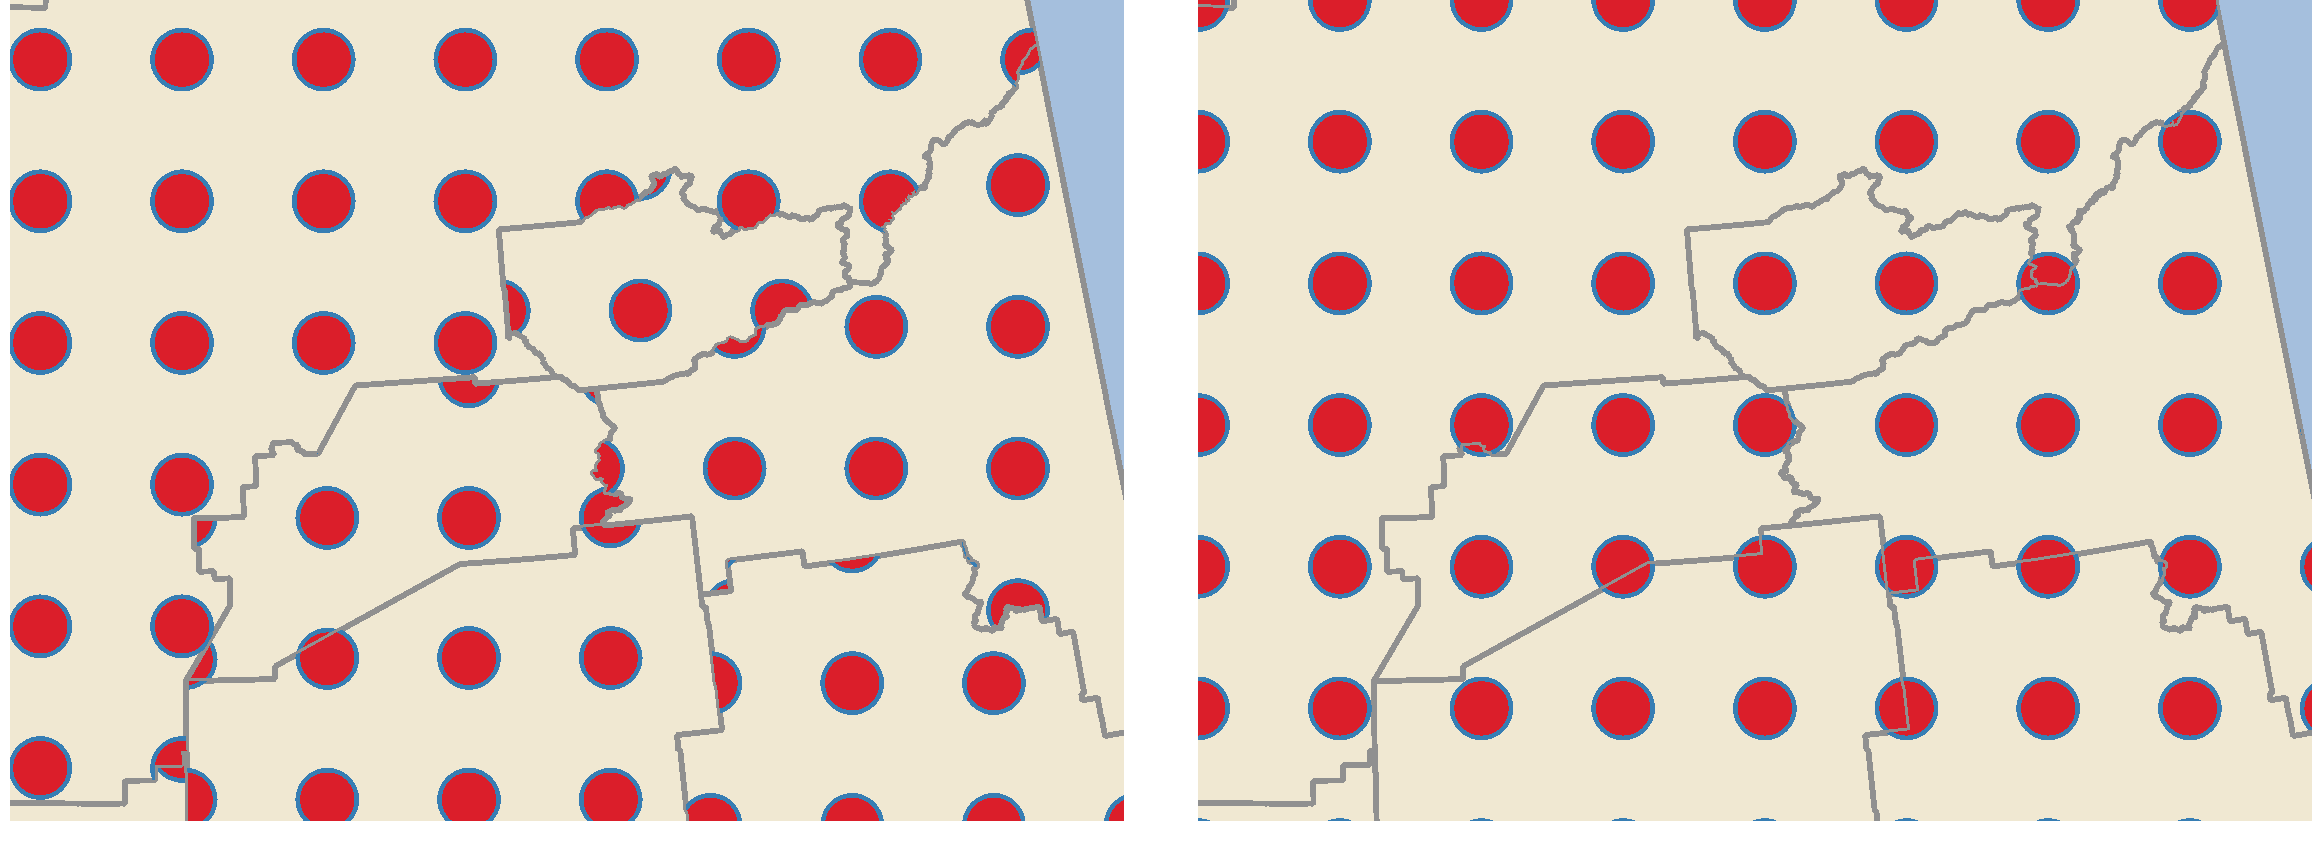
Fig. 10.20 Aligning point pattern to feature (left) and to map extent (right)
Distância: Horizontal e Vertical distâncias entre marcadores consecutivos
Displacement: a Horizontal (resp. Vertical) offset of alignment between consecutive markers in a column (resp. in a row)
Offset: Horizontal and Vertical distances from the feature boundary
Clipping: allows to control how markers in the fill should be clipped to the polygon shape. Options are:
Clip to shape: markers are clipped so that only the portions inside the polygon are visible
Marker centroid within shape: only markers where the center of the marker falls inside the polygon are drawn, but these markers won’t be clipped to the outside of the polygon
Marker completely within shape: only markers which fall completely within the polygon are shown
No clipping: any marker which intersects at all with the polygon will be completely rendered (strictly speaking its the “intersects with the bounding box of the marker”)
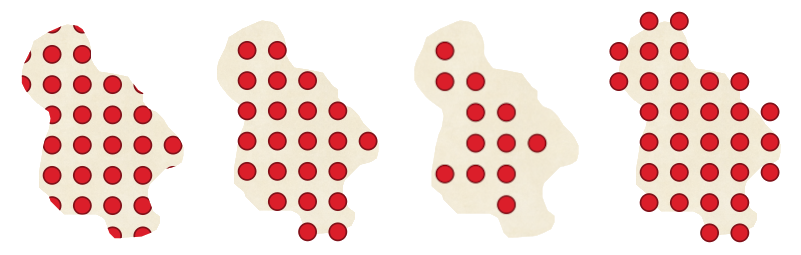
Fig. 10.21 Clipping markers in fill - From left to right: Clip to shape, Marker centroid within shape, Marker completely within shape, No clipping
Rotation of the whole pattern, clockwise
The Randomize pattern group setting allows each point in a point pattern fill to be randomly shifted up to the specified maximum distance Horizontally or Vertically. You can specify the maximum offset in any supported units, such as millimeters, points, map units, or even “percentage” (where percentage is relative to the pattern width or height).
You can set an optional random number seed to avoid the symbol patterns “jumping” around between map refreshes. Data defined overrides are also supported.
Nota
The main difference between the Randomize pattern and the random marker fill symbol type is that the random offset with a point pattern allows for quasi-“regular” placement of markers – because the points in the pattern are effectively constrained to a grid, this allows creation of semi-random fills which don’t have empty areas or overlapping markers. (As opposed to the random marker fill, which will always place points completely randomly… sometimes resulting in visual clusters of points or unwanted empty areas).
Random marker fill: fills the polygon with a marker symbol placed at random locations within the polygon boundary. You can set:
Count method: whether the number of marker symbols to render is considered as an absolute count or density-based
Point count: the number of marker symbols to render,
an optional random number seed, to give consistent placement
Área de densidade: no caso do método de contagem baseado em densidade, garante que a densidade de preenchimento dos marcadores permaneça a mesma em diferentes níveis de escala/zoom dos marcadores sempre que os mapas são atualizados (também permite a colocação aleatória para jogar bem com servidor QGIS e renderização baseada em mosaico)
Clip markers to polygon boundary: whether markers rendered near the edges of polygons should be clipped to the polygon boundary or not
Raster image fill: fills the polygon with tiles from a raster image (
PNGJPG,BMP…). The image can be a file on the disk, a remote URL or an embedded file encoded as a string (more details). Options include (data defined) opacity, size, coordinate mode (object or viewport), rotation and offset. Under the option Size you can independently adjust the width and height of the fill pattern, enabling stretched raster fills in either the horizontal or vertical directions. The image width and height can be set using any of the common units or as a percentage of the original size.
SVG fill: fills the polygon using SVG markers of a given size (Texture width).
Shapeburst fill: buffers a gradient fill, where a gradient is drawn from the boundary of a polygon towards the polygon’s centre. Configurable parameters include distance from the boundary to shade, use of color ramps or simple two color gradients, optional blurring of the fill and offsets.
Outline: Arrow: uses a line arrow symbol layer to represent the polygon boundary (Rings) which can be the interior rings only, the exterior ring only or all the rings. The settings for the outline arrow are the same as for arrow line symbols.
Outline: Filled line: uses a filled line symbol layer to represent the polygon boundary (Rings) which can be the interior rings only, the exterior ring only or all the rings. The settings are the same as for filled line symbols.
Outline: Hashed line: uses a hash line symbol layer to represent the polygon boundary (Rings) which can be the interior rings only, the exterior ring only or all the rings. The other settings are the same as for hashed line symbols.
Outline: Interpolated line: uses an interpolated line symbol layer to represent the polygon boundary (Rings) which can be the interior rings only, the exterior ring only or all the rings. The other settings are the same as for interpolated line symbols.
Outline: Linear referencing: uses a linear referencing symbol layer to represent the polygon boundary (Rings) which can be the interior rings only, the exterior ring only or all the rings. The other settings are the same as for linear referencing symbols.
Outline: Lineburst: uses a lineburst symbol layer to represent the polygon boundary (Rings) which can be the interior rings only, the exterior ring only or all the rings. The other settings are the same as for lineburst symbols.
Outline: Marker line: uses a marker line symbol layer to represent the polygon boundary (Rings) which can be the interior rings only, the exterior ring only or all the rings. The other settings for the outline marker line are the same as for marker line symbols.
Outline: Raster line: uses a raster line symbol layer to represent the polygon boundary (Rings) which can be the interior rings only, the exterior ring only or all the rings. The other settings for the outline hashed line are the same as for hashed line symbols.
Outline: Simple line: uses a simple line symbol layer to represent the polygon boundary (Rings) which can be the interior rings only, the exterior ring only or all the rings. The Draw line only inside polygon option displays the polygon borders inside the polygon and can be useful to clearly represent adjacent polygon boundaries. The other settings for the outline simple line are the same as for simple line symbols.
Nota
When geometry type is polygon, you can choose to disable the automatic clipping of lines/polygons to the canvas extent. In some cases this clipping results in unfavourable symbology (e.g. centroid fills where the centroid must always be the actual feature’s centroid).
SVG parametrizável
You have the possibility to change the colors of a SVG marker.
You have to add the placeholders param(fill) for fill color, param(fill-opacity) for
fill opacity, param(outline) and param(outline-opacity) for stroke color and opacity respectively,
and param(outline-width) for stroke width. These placeholders can optionally
be followed by a default value, e.g.:
<svg width="100%" height="100%">
<rect fill="param(fill) #ff0000" fill-opacity="param(fill-opacity) 1" stroke="param(outline) #00ff00" stroke-opacity="param(outline-opacity) 1" stroke-width="param(outline-width) 10" width="100" height="100">
</rect>
</svg>
More generally, SVG can be freely parametrized using param(param_name).
This param can either be used as an attribute value or a node text:
<g stroke-width=".265" text-anchor="middle" alignment-baseline="param(align)">
  <text x="98" y="147.5" font-size="6px">param(text1)</text>
  <text x="98" y="156.3" font-size="4.5px">param(text2)</text>
</g>
The parameters can then be defined as expressions in the Dynamic SVG parameters table.
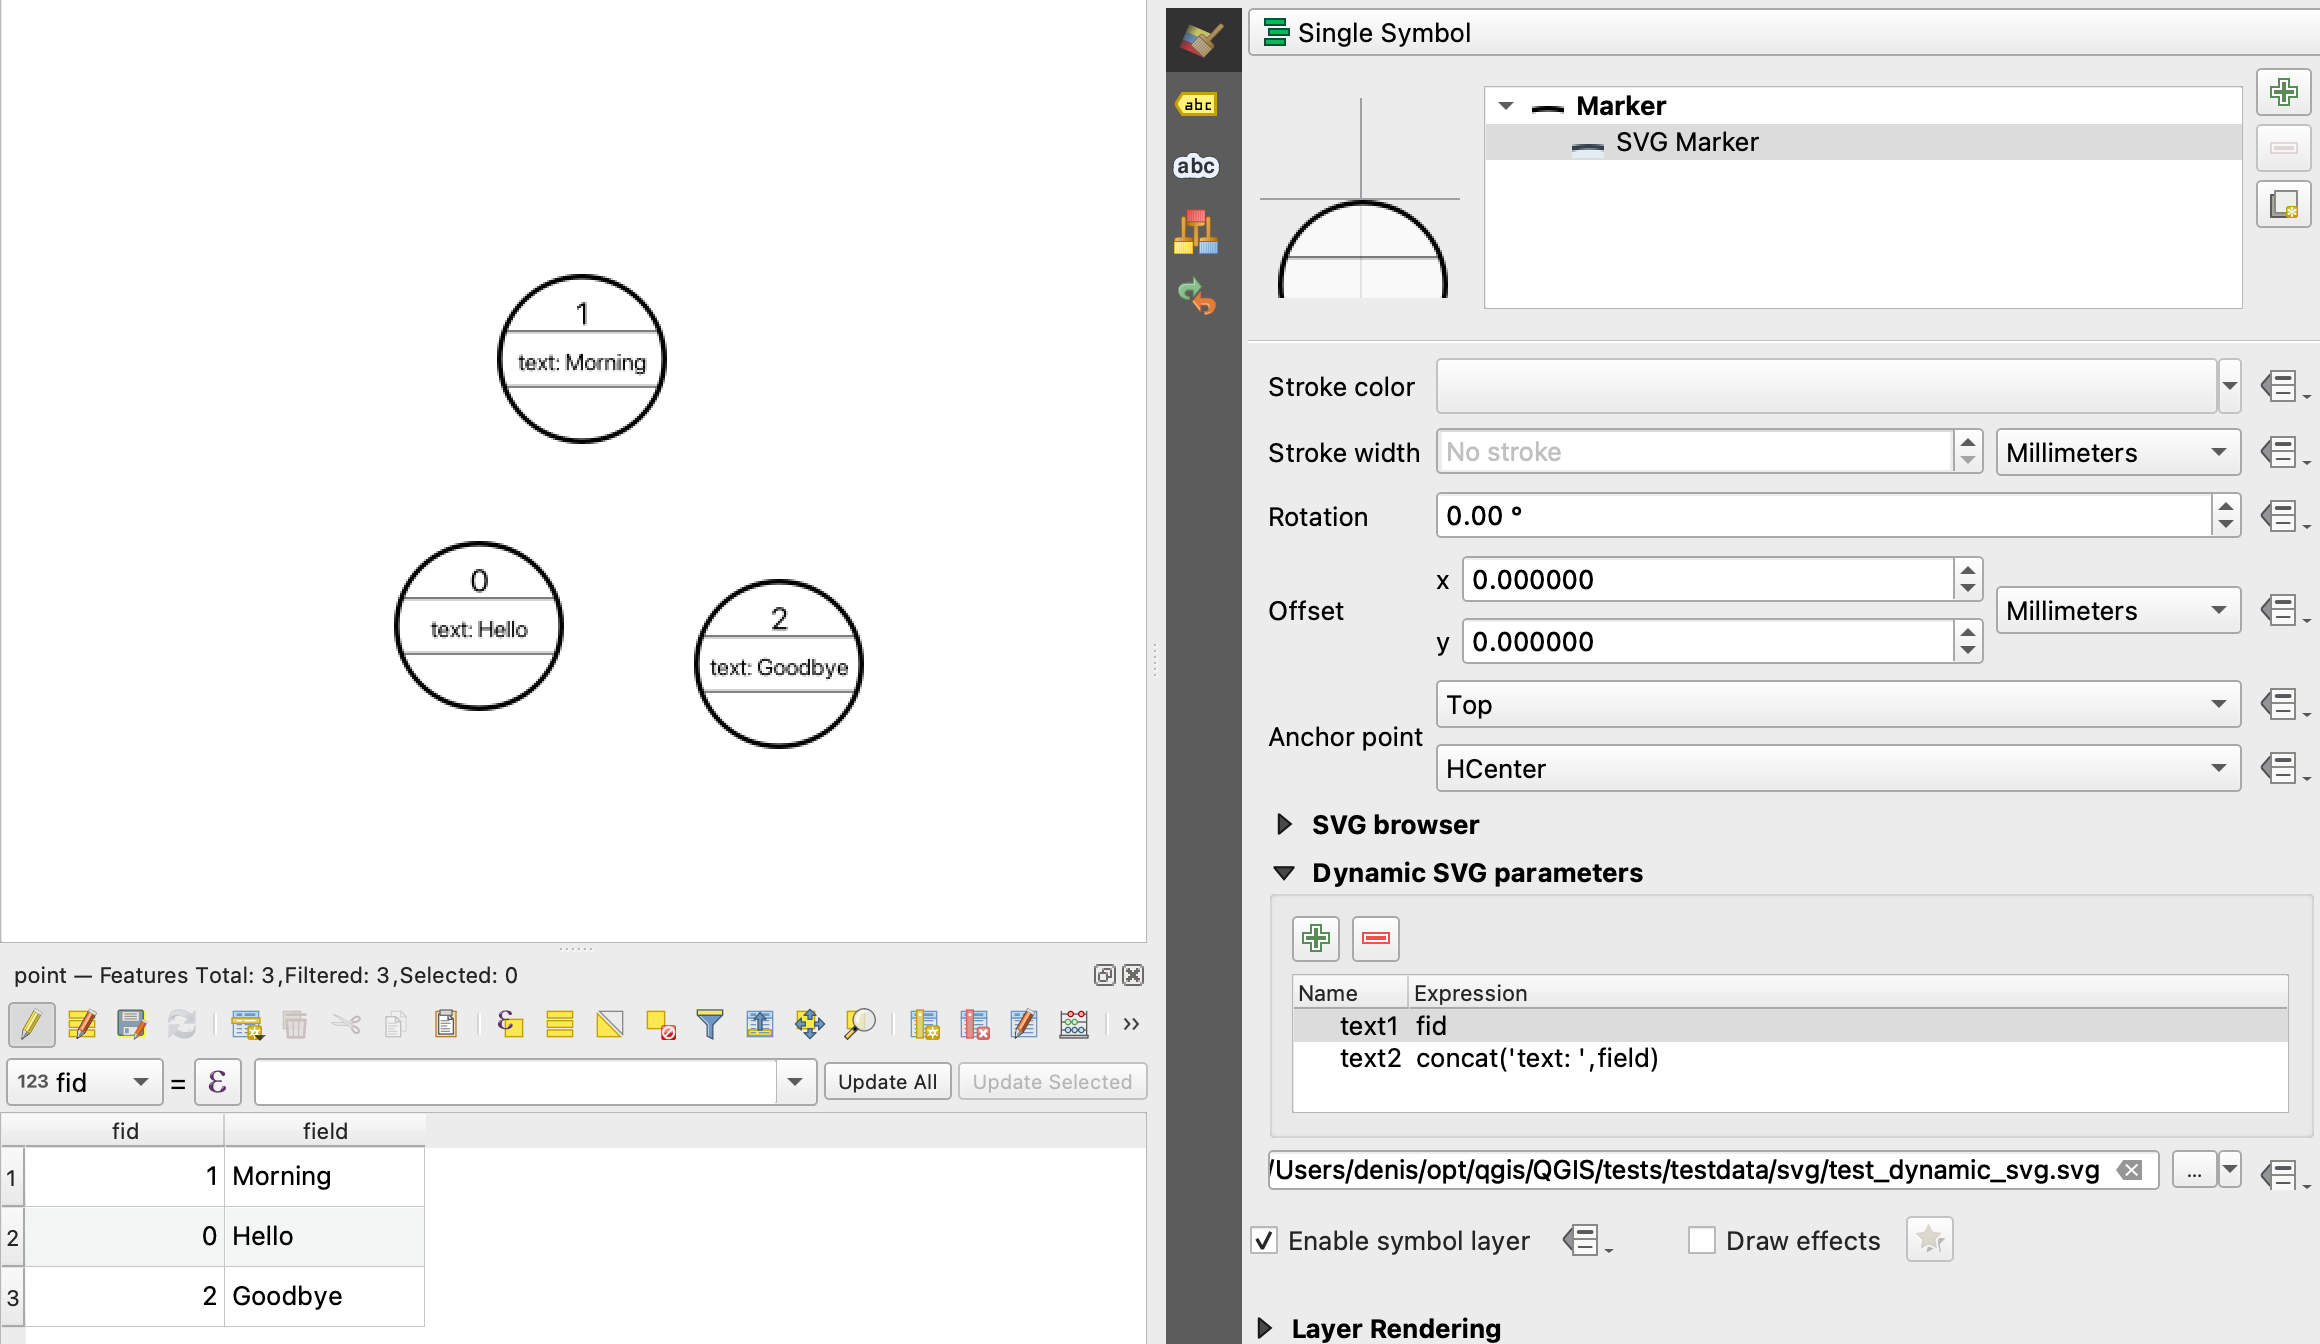
Fig. 10.22 Tabela de parâmetros dinâmicos SVG
Nota
QGIS is looking for a complete SVG node. So if your parameter is within a more complex node,
you need to inject the complete node with the expression.
For instance, transform="rotate(param(angle)" will not work.
Instead, you need to do transform="param(rotation)" and rotation parameter will be defined
with the expression 'rotate(' || coalesce(my_field, 0) || ')'.
O Gerador de Geometria
Available with all types of symbols, the geometry generator symbol layer allows to use expression syntax to generate a geometry on the fly during the rendering process. The resulting geometry does not have to match with the original Geometry type and you can add several differently modified symbol layers on top of each other.
A Units property can be set: when the geometry generator symbol is not applied to a layer (e.g., it is used on a layout item), this allows more control over the generated output.
Alguns exemplos:
Render symbol as the centroid of a feature
centroid( $geometry )
Visually overlap features within a 100 map units distance from a point feature, i.e generate a 100m buffer around the point
buffer( $geometry, 100 )
Create a radial effect of points surrounding the central feature point when used as a MultiPoint geometry generator
collect_geometries(
  array_foreach(
    generate_series( 0, 330, 30 ),
    project( $geometry, 3, radians( @element ) )
  )
)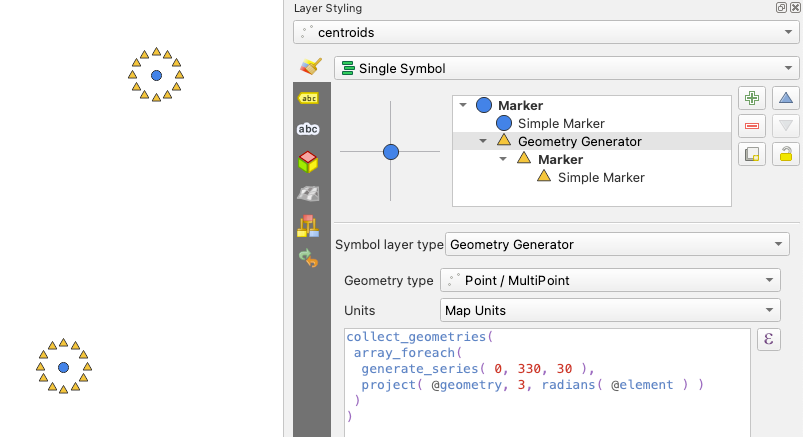
Create a radial effect of points surrounding the central feature point. The number of points varies based on a field.
with_variable(
  'symbol_numbers',
  ceil(fid/10),
  collect_geometries(
    array_foreach(
      generate_series( 0, 360, 360/@symbol_numbers ),
      project( $geometry, 2, radians( @element ) )
    )
  )
)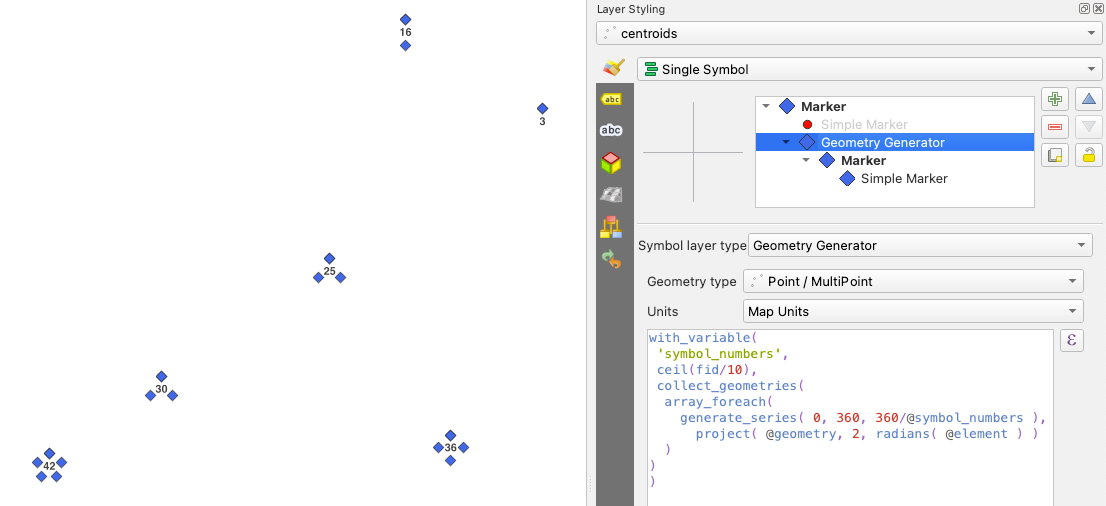
Create a curved arrow line connecting features of two layers based on their relation
collect_geometries(
  with_variable(
    'destination_points',
    relation_aggregate( 'the_relation_id', 'array_agg', centroid( $geometry ) ),
    array_foreach(
      @destination_points,
      make_line(
        centroid( @geometry ),
        project(
          centroid( make_line( centroid( @geometry ), @element ) ),
          10,
          50
        ),
        @element
      )
    )
  )
)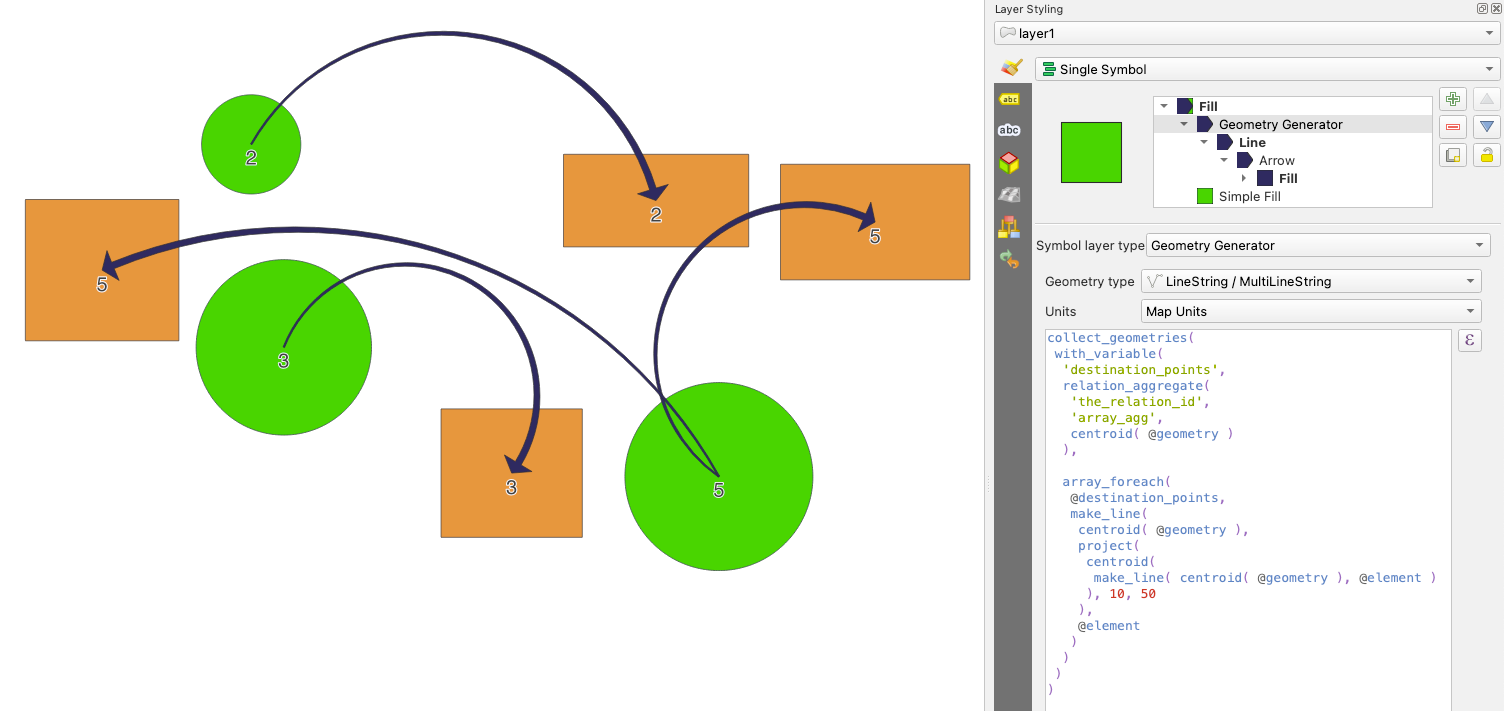
The Vector Field Marker
The vector field marker is used to display vector field data such as earth deformation, tidal flows, and the like. It displays the vectors as lines (preferably arrows) that are scaled and oriented according to selected attributes of data points. It can only be used to render point data; line and polygon layers are not drawn by this symbology.
O campo vetorial é definido por atributos nos dados, que podem representar o campo ou por:
componentes cartesianos (componentes
xeydo campo)ou coordenadas polares: neste caso, os atributos definem
ComprimentoeÂngulo. O ângulo pode ser medido no sentido horário a partir do norte ou no sentido anti-horário a partir do leste, e pode ser em graus ou radianos.or as height only data, which displays a vertical arrow scaled using an attribute of the data. This is appropriate for displaying the vertical component of deformation, for example.
A magnitude do campo pode ser aumentada ou diminuída para um tamanho apropriado para visualização do campo.
Animated marker
Animated marker symbol type allows you to use a .GIF, .WebP,
.MNG, etc. animation file to represent points on your map.
You can specify:
File path,
Frame rate: number of steps that are shown per second, indicating how fast the animation is played,
Size in any supported unit,
Opacity,
Rotation,
Offset in x and y directions from the marker position,
Anchor point
There are two ways to handle animated symbols:
When your map is not configured as an animation (i.e. it’s a standard QGIS project without animations), the frame for the animated markers will be determined solely by the current timestamp.
Fig. 10.23 Animated marker when map is not configured as animation
When your map is configured as an animation, the animated markers will sync with the animation’s timeline. This means that animated markers will pause when the animation is paused, progress with the animation, and so forth. The map will also be redrawn according to the frame rate established for temporal animation. This mode is also applied when exporting an animation using the temporal controller.
Fig. 10.24 Animated marker when map is configured as animation