Importante
A tradução é um esforço comunitário você pode contribuir. Esta página está atualmente traduzida em 28.24%.
7.1. 2D Map View
The 2D map view (also called Map canvas) is the central place where maps are displayed.
QGIS opens by default with a single map view (called main map),
showing layers in 2D, and tightly bound to the Layers panel.
That window reflects the rendering (symbology, labeling, visibilities…)
you applied to the loaded layers.
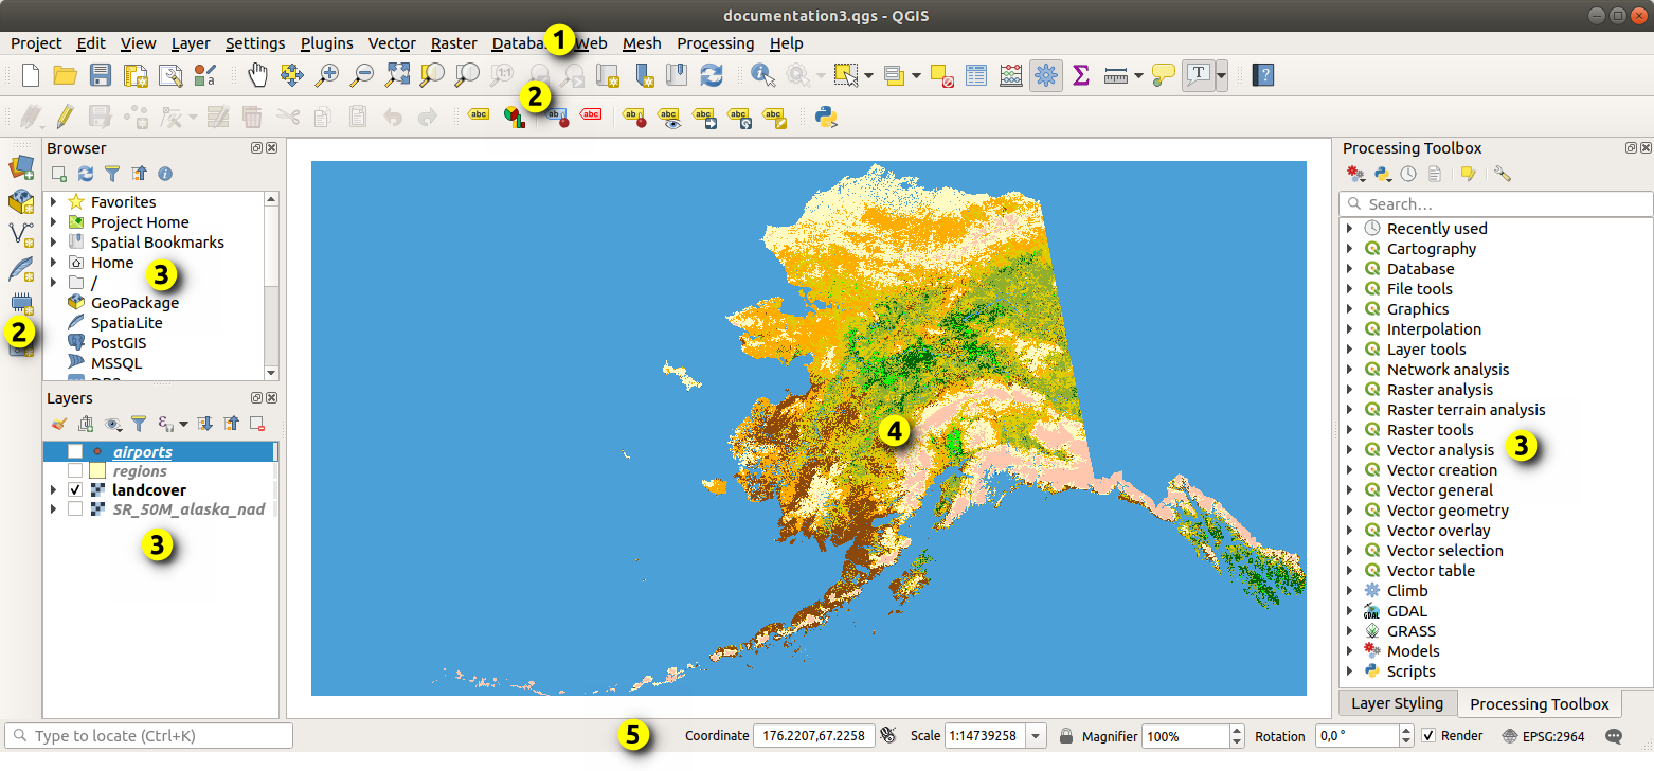
Fig. 7.1 Interface do QGIS
7.1.1. Explorando a visualização do mapa
When you add a layer (see e.g. Abrir Dados), QGIS automatically looks for its CRS. If a different CRS is set by default for the project (see Sistemas referência de coordenadas projetadas) then the layer extent is “on-the-fly” translated to that CRS, and the map view is zoomed to that extent if you start with a blank QGIS project. If there are already layers in the project, no map canvas resize is performed, so only features falling within the current map canvas extent will be visible.
Click on the map view and you should be able to interact with it, panning or zooming to different areas of the map. Dedicated tools are provided in the Navigation Toolbar and in the menu, with handful shortcuts from the keyboard or the mouse buttons.
Ferramenta |
Utilização |
|---|---|
|
|
|
|
|
|
|
Pan the map to the selected features of all the selected layers in the Layers panel. |
|
Zoom to the selected features of all the selected layers in the Layers panel. Also available in the layer contextual menu |
|
Zoom to the extent of all the selected layers in the Layers panel. Also available in the layer contextual menu |
|
Zoom to the extent of all the layers in the project or to the project full extent. |
|
Zoom the map to the previous extent in history. |
|
Zoom the map to the next extent in history. |
|
Zoom the map to a level where one pixel of the active raster layer covers one screen pixel. Also available in the layer contextual menu |
Mouse wheel |
|
Keyboard |
|


Right-click over the map and you should be able to  Copy coordinates of the clicked point in the map CRS, in WGS84
or in a custom CRS. The copied information can then be pasted in an expression,
a script, text editor or spreadsheet…
Copy coordinates of the clicked point in the map CRS, in WGS84
or in a custom CRS. The copied information can then be pasted in an expression,
a script, text editor or spreadsheet…
7.1.2. Controlling map rendering
By default, QGIS renders all visible layers whenever the map canvas is refreshed. The events that trigger a refresh of the map canvas include:
changing the visibility of a layer
modifying symbology of a visible layer
adicionando uma camada
panning or zooming
redimensionando a janela QGIS
QGIS permite controlar o processo de renderização de várias formas.
at the global level
per layer, using e.g. the scale dependent rendering
or with dedicated tools in the GUI.
To stop the map drawing, press the Esc key. This will halt the refresh of the map canvas and leave the map partially drawn. It may however take a bit of time after pressing Esc for the map drawing to halt.
To suspend rendering, click the  Render checkbox in the
bottom-right corner of the status bar. When Render
is unchecked, QGIS does not redraw the canvas in response to any of
the usual triggers mentioned earlier. Examples of when you
might want to suspend rendering include:
Render checkbox in the
bottom-right corner of the status bar. When Render
is unchecked, QGIS does not redraw the canvas in response to any of
the usual triggers mentioned earlier. Examples of when you
might want to suspend rendering include:
adding many layers and symbolizing them prior to drawing
adding one or more large layers and setting scale dependency before drawing
adding one or more large layers and zooming to a specific view before drawing
qualquer combinação dos itens acima
Caixa de seleção :guilabel: caixa de seleção Renderizar permite renderização e causa uma atualização imediata na tela do mapa.
7.1.3. Controle baseado no tempo na tela do mapa
O QGIS pode manipular o controle temporal em camadas carregadas, ou seja, modificar a renderização da tela de mapa com base em uma variação de tempo. Para conseguir isso, você precisa:
Camadas que têm propriedades temporais dinâmicas definidas. O QGIS suporta controle temporal para diferentes provedores de dados, com configurações personalizadas. Trata-se principalmente de definir o intervalo de tempo no qual a camada seria exibida:
raster layers: controls whether to display or not the layer.
WMTS layers: controls whether the data should be rendered based on a static time range or following a dynamic temporal range
vector layers: features are filtered based on time values associated to their attributes
mesh layers: displays dynamically the active dataset groups values
When dynamic temporal options are enabled for a layer, an
 icon is displayed next to the layer in the Layers panel to remind
you that the layer is temporally controlled.
Click the icon to update the temporal settings.
icon is displayed next to the layer in the Layers panel to remind
you that the layer is temporally controlled.
Click the icon to update the temporal settings.Enable the temporal navigation of the map canvas using the Temporal controller panel. The panel is activated:
using the
 Temporal controller panel icon located in the
Map Navigation toolbar
Temporal controller panel icon located in the
Map Navigation toolbaror from the menu
or from the menu
7.1.3.1. O painel de controle temporal
The Temporal controller panel has the following modes:
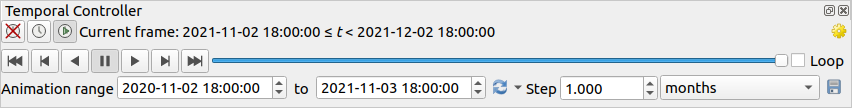
Fig. 7.2 Painel Controlador Temporal no modo de navegação
 Desligar a navegação temporal: todas as configurações temporais são desativadas e as camadas visíveis são renderizadas como de costume
 Fixed range temporal navigation:
a time range is set and only layers (or features) whose temporal range
overlaps with this range are displayed on the map.
Fixed range temporal navigation:
a time range is set and only layers (or features) whose temporal range
overlaps with this range are displayed on the map. Animated temporal navigation:
a time range is set, split into steps, and only layers (or features)
whose temporal range overlaps with each frame are displayed on the map
Animated temporal navigation:
a time range is set, split into steps, and only layers (or features)
whose temporal range overlaps with each frame are displayed on the map Animated movie:
a total number of frames is set for the animation, with the map settings
advancing at each step, displaying the progression frame by frame without
any time-based filtering of data.
Animated movie:
a total number of frames is set for the animation, with the map settings
advancing at each step, displaying the progression frame by frame without
any time-based filtering of data. Definições para controle geral da animação
Frames rate: number of steps that are shown per second
 Cumulative range: all animation frames will
have the same start date-time but different end dates and times.
This is useful if you wish to accumulate data in your temporal
visualization instead of showing a ‘moving time window’ across your data.
Cumulative range: all animation frames will
have the same start date-time but different end dates and times.
This is useful if you wish to accumulate data in your temporal
visualization instead of showing a ‘moving time window’ across your data.
7.1.3.2. Animando uma navegação temporal
Uma animação é baseada em um conjunto variável de camadas visíveis em momentos específicos dentro de um intervalo de tempo. Para criar uma animação temporal:
Toggle on the
Animated temporal
navigation, displaying the animation player widgetDigite o Faixa de tempo a considerar. Usando o botão
 , isto pode ser definido como:
Set to full range of all the time enabled layers
Set to preset project range as defined in the project properties
Set to single layer’s range taken from a time-enabled layer
Fill in the time Step to split the time range. Different units are supported, from
secondstocenturies. Asource timestampsoption is also available as step: when selected, this causes the temporal navigation to step between all available time ranges from layers in the project. It’s useful when a project contains layers with non-contiguous available times, such as a WMS-T service which provides images that are available at irregular dates. This option will allow you to only step between time ranges where the next available image is shown.Clique no botão
 para visualizar a animação. QGIS irá gerar cenas usando as camadas de renderização nos horários definidos. A exibição das camadas depende de se elas se sobrepõem a qualquer período de tempo individual.
Fig. 7.3 Navegação temporal através de uma camada
The animation can also be previewed by moving the time slider. Checking the
Loop checkbox will repeatedly run the
animation while clicking stops a running animation.
A full set of video player buttons is available.Horizontal scrolling using the mouse wheel (where supported) with the cursor on the map canvas will also allow you to navigate, or “scrub”, the temporal navigation slider backwards and forwards.
Click the
 Export animation button if you want to generate
a series of images representing the scene. They can be later combined in a
video editor software:
Export animation button if you want to generate
a series of images representing the scene. They can be later combined in a
video editor software: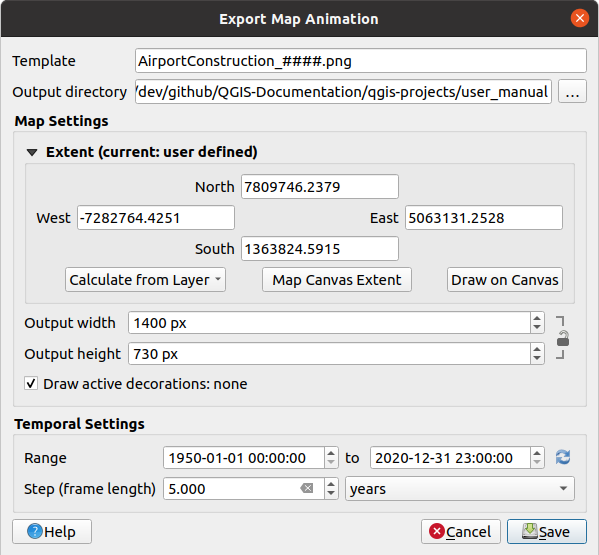
Fig. 7.4 Exporting map canvas animation scenes to images
O nome do arquivo Modelo: o
####é substituído pelo número da seqüência de quadrosO Diretório de saída
Sob :guilabel:`Configurações do mapa’, você pode:
redefinir a :ref:`extensão espacial <extent_selector>`a ser utilizada
control the Resolution of the image (Output width and Output height)
Draw active decorations: whether active decorations should be kept in the output
Sob :guilabel:`Configurações temporais’, você pode redefinir:
the time Range for the animation
the Step (frame length) in the unit of your choice
7.1.4. The Elevation Controller panel
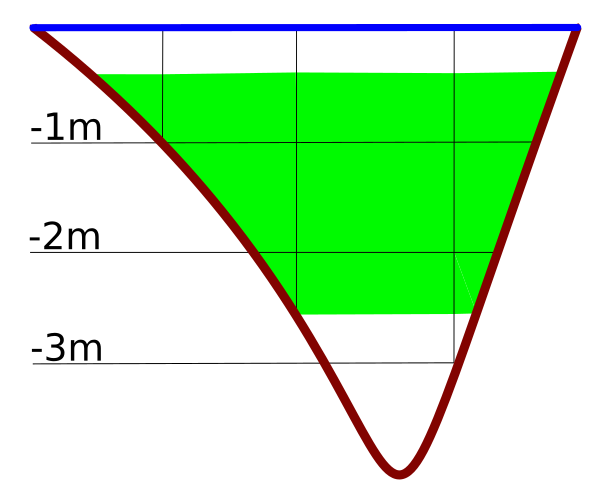 Elevation Controller allows you to handle elevation z-range data in 2D maps.
This option currently supports point cloud layers and raster DEMs.
Use the panel to visualize and interact with elevation data in the map canvas.
Elevation Controller allows you to handle elevation z-range data in 2D maps.
This option currently supports point cloud layers and raster DEMs.
Use the panel to visualize and interact with elevation data in the map canvas.
Activate the Elevation Controller panel in the map canvas by
clicking on the Data Filtering in the View menu. The
Elevation Controller appears as a range slider on the left
side of the map canvas. At the top of the slider, there is a Settings menu
where you can:
Set the Fixed Range Size value to lock the elevation range to a specific size. This setting is saved within the project and retained across sessions, ensuring consistency for your elevation filter. Use the
Invert Direction option to reverse
the elevation filter slider, so that it moves from high values at the bottom to low values at the top.Set Elevation Range to open the project elevation tab, where you can set dedicated lower and upper bounds for the elevation range
Disable Elevation Filter to remove the elevation filter from the map canvas
7.1.5. Bookmarking extents on the map
Spatial Bookmarks allow you to “bookmark” a geographic location and return to it later. By default, bookmarks are saved in the user’s profile (as User Bookmarks), meaning that they are available from any project the user opens. They can also be saved for a single project (named Project Bookmarks) and stored within the project file, which can be helpful if the project is to be shared with other users.
7.1.5.1. Novo Favorito
Para criar um novo favorito:
Zoom and pan to the area of interest.
Select the menu option
 ,
press Ctrl+B or right-click the
,
press Ctrl+B or right-click the  Spatial
Bookmarks entry in
the Browser panel and select New Spatial Bookmark.
The Bookmark Editor dialog opens.
Spatial
Bookmarks entry in
the Browser panel and select New Spatial Bookmark.
The Bookmark Editor dialog opens.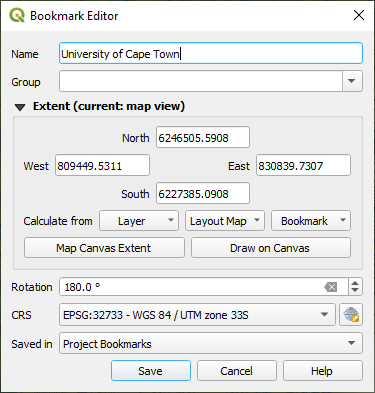
Fig. 7.5 The Bookmark Editor Dialog
Enter a descriptive name for the bookmark
Enter or select a group name in which to store related bookmarks
Select the extent of the area you wish to save, using the extent selector widget
Change the map Rotation
Indicate the CRS to use for the extent
Select whether the bookmark will be Saved in User Bookmarks or Project Bookmarks (by default, this drop-down list is set to User Bookmarks)
Press Save to add the bookmark to the list
Note que você pode ter vários favoritos com o mesmo nome.
7.1.5.2. Trabalhando com favoritos
To use and manage bookmarks, you can either use the Spatial Bookmarks panel or Browser.
Select or press Ctrl+7
to open the Spatial Bookmarks Manager panel.
Select
or Ctrl+Shift+B to show
the Spatial Bookmarks entry in the
Browser panel.
Você pode executar as seguintes tarefas:
Tarefa |
Spatial Bookmark Manager |
Navegador |
|---|---|---|
Zoom to a Bookmark |
Double-click on it, or select the bookmark and press the
|
Double-click on it, drag and drop it to the map canvas, or right-click the bookmark and select Zoom to Bookmark. |
Delete a bookmark |
Select the bookmark and click the |
Right-click the bookmark and select Delete Spatial Bookmark. Confirm your choice. |
Export bookmarks to XML |
Click the |
Select one or more folders (user or project) or subfolders (groups),
then right-click and select |
Import bookmarks from XML |
Click the |
Right-click the Spatial Bookmarks entry or one of its folders (user or
project) or subfolders (groups) to determine where to import the
bookmarks, then select |
Edit bookmark |
You can change a bookmark by changing the values in the table. You can edit the name, the group, the extent and if it is stored in the project or not. |
Right-click the desired bookmark and select Edit Spatial Bookmark…. The Bookmark Editor will open, allowing you to redefine every aspect of the bookmark as if you were creating it for the first time. You can also drag and drop the bookmark between folders (user and project) and subfolders (groups). |


You can manage bookmark actions by right-click on the desired bookmark in the Spatial Bookmarks Manager. You can also zoom to bookmarks by typing the bookmark name in the locator.
7.1.6. Decorating the map
Decorations include Grid, Title Label, Copyright Label, Image, North Arrow, Scale Bar and Layout Extents. They are used to ‘decorate’ the map by adding cartographic elements.
7.1.6.1. Malha
 Grid allows you to add a coordinate grid and coordinate
annotations to the map canvas.
Grid allows you to add a coordinate grid and coordinate
annotations to the map canvas.
Select menu option to open the dialog.
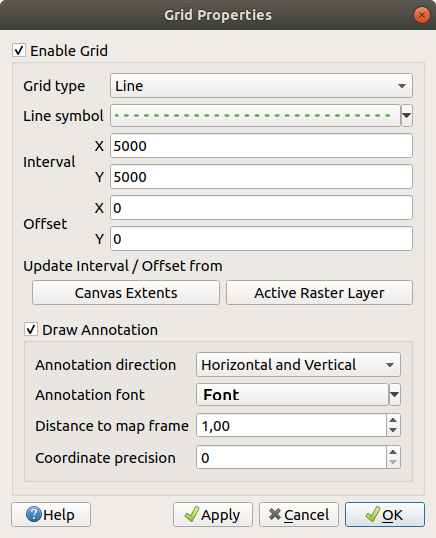
Fig. 7.6 The Grid Dialog
Tick
Enable grid and set grid
definitions according to the layers loaded in the map canvas:The Grid type: it can be Line or Marker
The associated Line symbol or marker symbol used to represent the grid marks
The Interval X and Interval Y between the grid marks, in map units
An Offset X and Offset Y distance of the grid marks from the bottom left corner of the map canvas, in map units
The interval and offset parameters can be set based on the:
Canvas Extents: generates a grid with an interval that is approximatively 1/5 of the canvas width
Active Raster Layer resolution
Tick
Draw annotations to display the coordinates of
the grid marks and set:The Annotation direction, ie how the labels would be placed relative to their grid line. It can be:
Horizontal or Vertical for all the labels
Horizontal and Vertical, ie each label is parallel to the grid mark it refers to
Boundary direction, ie each label follows the canvas boundary, and is perpendicular to the grid mark it refers to
The Annotation font (text formatting, buffer, shadow…) using the font selector widget
The Distance to map frame, margin between annotations and map canvas limits. Convenient when exporting the map canvas eg to an image format or PDF, and avoid annotations to be on the “paper” limits.
The Coordinate precision
Click Apply to verify that it looks as expected or OK if you’re satisfied.
7.1.6.2. Title Label
 Title Label allows you to decorate your map with a Title.
To add a Title Label decoration:
Select menu option to open the dialog.
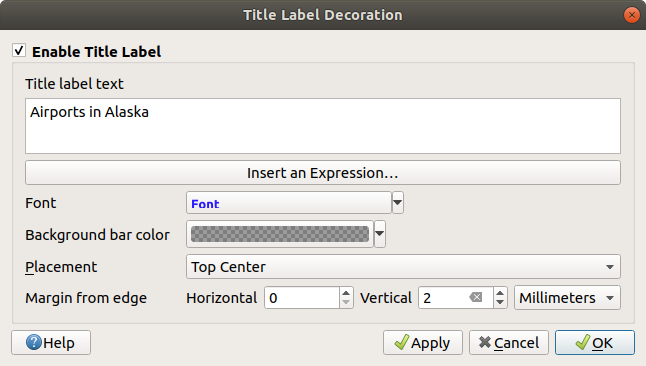
Fig. 7.7 The Title Decoration Dialog
Make sure
Enable Title Label is checkedEnter the title text you want to place on the map. You can make it dynamic using the Insert or Edit an Expression… button.
Choose the Font for the label using the font selector widget with full access to QGIS text formatting options. Quickly set the font color and opacity by clicking the black arrow to the right of the font combo box.
Select the color to apply to the title’s Background bar color.
Choose the Placement of the label in the canvas: options are Top left, Top Center (default), Top Right, Bottom left, Bottom Center and Bottom Right.
Refine the placement of the item by setting a horizontal and/or vertical Margin from Edge. These values can be in Millimeters or Pixels or set as a Percentage of the width or height of the map canvas.
Click Apply to verify that it looks as expected or OK if you’re satisfied.
7.1.6.3. Copyright Label
 Copyright Label can be used to decorate your
map with a Copyright label.
Copyright Label can be used to decorate your
map with a Copyright label.
Para adicionar esta decoração:
Select menu option to open the dialog.
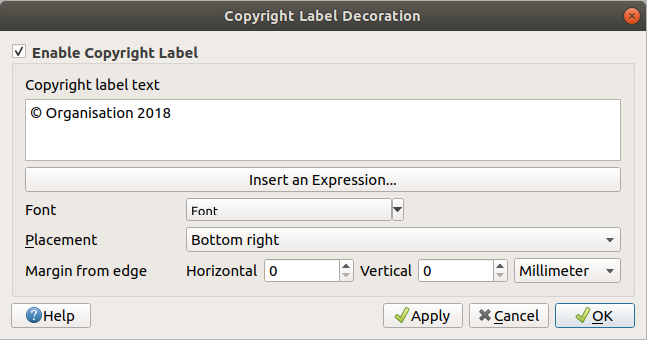
Fig. 7.8 The Copyright Decoration Dialog
Make sure
Enable Copyright Label is checkedEnter the copyright text you want to place on the map. You can make it dynamic using the Insert or Edit an Expression… button.
Choose the Font for the label using the font selector widget with full access to QGIS text formatting options. Quickly set the font color and opacity by clicking the black arrow to the right of the font combo box.
Choose the Placement of the label in the canvas: options are Top left, Top Center, Top Right, Bottom left, Bottom Center, and Bottom Right (default for Copyright decoration)
Refine the placement of the item by setting a horizontal and/or vertical Margin from Edge. These values can be in Millimeters or Pixels or set as a Percentage of the width or height of the map canvas.
Click Apply to verify that it looks as expected or OK if you’re satisfied.
7.1.6.4. Image Decoration
 Image allows you to add an image (logo, legend, ..) on the map canvas.
Para adicionar uma imagem:
Select menu option to open the dialog.
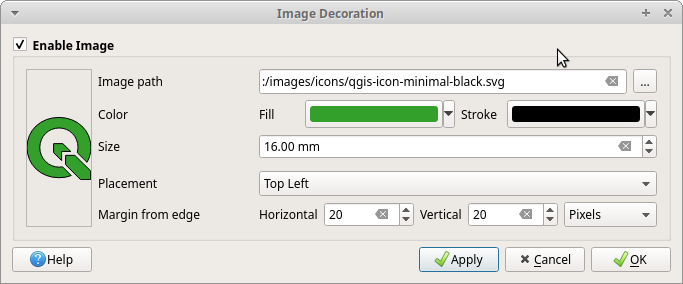
Fig. 7.9 The Image Decoration Dialog
Make sure
Enable Image is checkedSelect a bitmap (e.g. png or jpg) or SVG image using the … Browse button
If you have chosen a parameter enabled SVG then you can also set a Fill or Stroke (outline) color. For bitmap images, the color settings are disabled.
Set a Size of the image in mm. The width of selected image is used to resize it to given Size.
Choose where you want to place the image on the map canvas with the Placement combo box. The default position is Top Left.
Set the Horizontal and Vertical Margin from (Canvas) Edge. These values can be set in Millimeters, Pixels or as a Percentage of the width or height of the map canvas.
Click Apply to verify that it looks as expected and OK if you’re satisfied.
7.1.6.5. Seta Norte
![]() North Arrow allows you to add a north arrow on the map canvas.
North Arrow allows you to add a north arrow on the map canvas.
Para adicionar uma seta norte:
Select menu option to open the dialog.
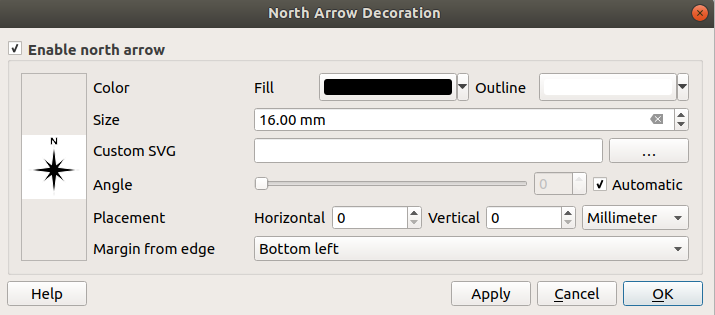
Fig. 7.10 The North Arrow Dialog
Make sure
Enable north arrow is checkedOptionally change the color and size, or choose a custom SVG
Opcionalmente, altere o ângulo ou escolha Automático para permitir que o QGIS determine a direção
Optionally choose the placement from the Placement combo box
Optionally refine the placement of the arrow by setting a horizontal and/or vertical Margin from (Canvas) Edge. These values can be in Millimeters or Pixels or set as a Percentage of the width or height of the map canvas.
Click Apply to verify that it looks as expected and OK if you’re satisfied.
7.1.6.6. Barra de Escala
 Scale Bar adds a simple scale bar to the map canvas.
You can control the style and placement, as well as the labelling of the bar.
The scale bar respects the active project’s distance unit
as defined in .
Scale Bar adds a simple scale bar to the map canvas.
You can control the style and placement, as well as the labelling of the bar.
The scale bar respects the active project’s distance unit
as defined in .
Para adicionar uma barra de escala:
Select menu option to open the dialog
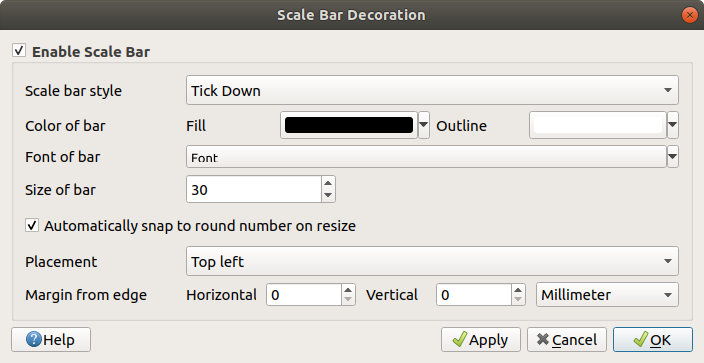
Fig. 7.11 The Scale Bar Dialog
Make sure
Enable scale bar is checkedChoose a style from the Scale bar style
 combo box
Select the Color of bar
 by choosing
a fill color (default: black) and an outline color (default: white). The scale
bar fill and outline can be made opaque by clicking on the down arrow to the right
of the color input.
by choosing
a fill color (default: black) and an outline color (default: white). The scale
bar fill and outline can be made opaque by clicking on the down arrow to the right
of the color input.Selecione a fonte para a barra de escala na caixa Fonte da barra
Set the Size of bar in the active unit
Optionally check
Automatically snap to round number on resize
to display easy-to-read valuesChoose the placement from the Placement
combo boxYou can refine the placement of the item by setting a horizontal and/or vertical Margin from (Canvas) Edge. These values can be in Millimeters or Pixels or set as a Percentage of the width or height of the map canvas.
Click Apply to verify that it looks as expected or OK if you’re satisfied.
7.1.6.7. Extensões de Layout
 Layout Extents adds the extents of map item(s) in print
layout(s) to the canvas. When enabled, the extents of all map items within all print layouts are
shown using a lightly dotted border labeled with the name of the print layout and map item.
You can control the style and labeling of the displayed layout extents.
This decoration is useful when you are tweaking the positioning of map elements such as labels,
and need to know the actual visible region of print layouts.
Layout Extents adds the extents of map item(s) in print
layout(s) to the canvas. When enabled, the extents of all map items within all print layouts are
shown using a lightly dotted border labeled with the name of the print layout and map item.
You can control the style and labeling of the displayed layout extents.
This decoration is useful when you are tweaking the positioning of map elements such as labels,
and need to know the actual visible region of print layouts.
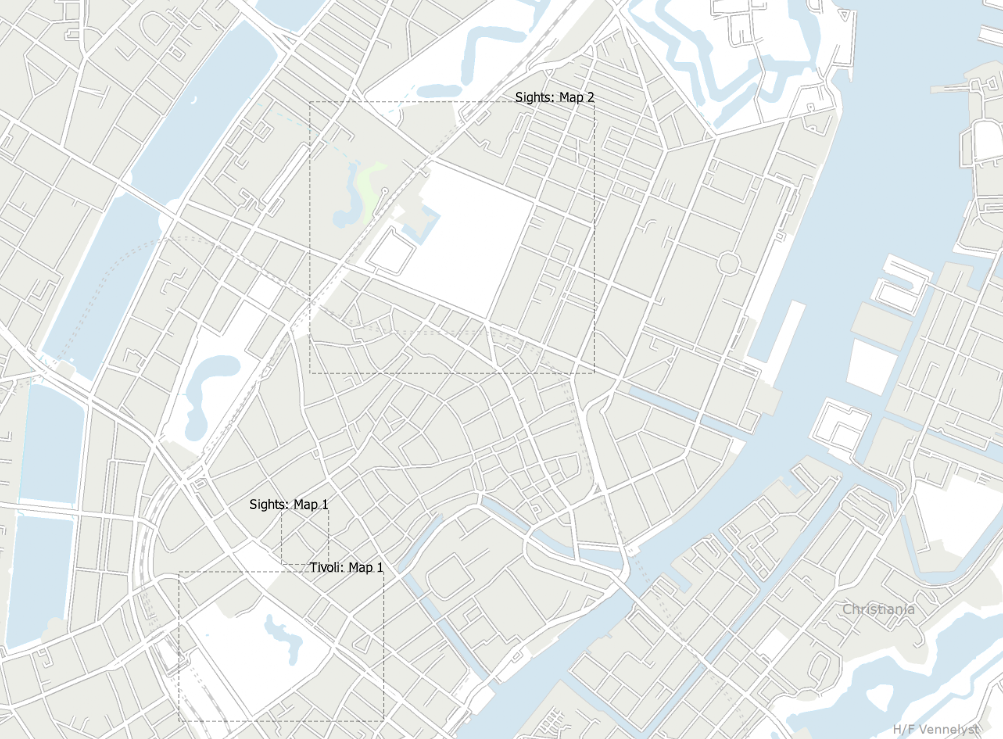
Fig. 7.12 Example of layout extents displayed in a QGIS project with two print layouts. The print layout named ‘Sights’ contains two map items, while the other print layout contains one map item.
Para adicionar extensão(ões) de layout:
Select to open the dialog
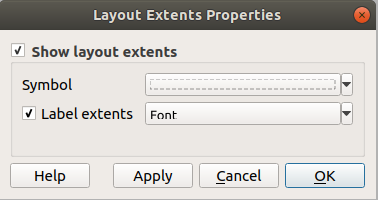
Fig. 7.13 The Layout Extents Dialog
Make sure
Show layout extents is checked.Opcionalmente, altere o símbolo e a rotulagem das extensões.
Click Apply to verify that it looks as expected and OK if you’re satisfied.
Dica
Decorations Settings
When you save a QGIS project file, any changes you have made to Grid, North Arrow, Scale Bar, Copyright and Layout Extents will be saved in the project and restored the next time you load the project.
7.1.7. Ferramentas de anotação
Annotations are another type of elements added onto the map canvas to provide additional information that can not be depicted by the rendered layers. Unlike labels that rely on attribute values stored in vector layers, annotations are independent details, stored within the project file itself.
Two families of annotations are available in QGIS:
Feature annotations: they are actual georeferenced features of text, marker, line or polygon type stored within a special layer type called “annotation layer”. They are tied to a particular geographic location, meaning that moving your map, changing the scale or changing projection won’t cause your annotations to jump around the map. Rather, they’ll be locked in place to the location you’ve drawn them.
Balloon annotations: these are individual HTML or form annotations inside a bubble. They can be associated to any layer for their visibility and drawn on top of the map canvas. The size is dependent from the map canvas scale, and its position can be anchored.
Dica
Layout the map with annotations
You can print or export annotations with your map to various formats using:
map canvas export tools available in the menu
print layout, in which case you need to check Draw map canvas items in the corresponding map item properties
The Annotations Toolbar provides a set of tools to create and interact with both families of annotations.
Ferramenta |
Utilização |
Scope |
|
Create a new layer to store annotations |
Feature annotations |
Main Annotation Layer Properties |
Control settings of the Main Annotation Layer |
|
|
Select, move, resize and modify symbology properties of annotations |
|
|
Create an annotation as a polygon feature |
|
|
Create an annotation as a polyline feature |
|
|
Create an annotation as a point feature |
|
|
Create an annotation as a text label |
|
|
Create an annotation as a curved text along a line feature |
|
|
Create a text formatted annotation bound within a rectangle |
|
|
Create an annotation showing an |
|
|
Select and create annotation with an |
Balloon annotations |
|
Select and create annotation showing attributes of a vector layer in a custom form file |


Nota
Starting with QGIS 3.40, it is no longer possible to create balloon annotations of SVG or text type. When loading old projects, any of these annotations will automatically be converted to the newer picture and rectangular text annotation item types.
7.1.7.1. Feature Annotations
Feature annotations are stored in annotation layers. Unlike conventional layers, an annotation layer is available only in the current project and can contain features of different types (text, marker, line, polygon, picture). The layer has no attributes and no symbology associated, but instead each feature can be symbolized on an item-by-item basis, through Layer Styling panel.
Two types of annotation layer are available in QGIS:
A common Annotation Layer: you can create one using the
 New Annotation Layer tool. It is listed
in the Layers panel, allowing you to control its features’ visibility,
move it to show above or below particular layers in your map, like any common layer.
Double-click the layer and you can access its properties.
New Annotation Layer tool. It is listed
in the Layers panel, allowing you to control its features’ visibility,
move it to show above or below particular layers in your map, like any common layer.
Double-click the layer and you can access its properties.The Main Annotation Layer: By default, this is where annotations are stored when no annotation layer is available in the project or is selected at creation time. This layer is always drawn on the very top of your map and you won’t see it listed in the Layers panel alongside the other layers in your project, meaning that its features are always visible. The Main Annotation Layer Properties entry on the Annotations toolbar helps you open its properties dialog.
Propriedades da Camada
The properties dialog of an annotation layer provides the following tabs:
Information: a read-only dialog representing an interesting place to quickly grab summarized information and metadata on the current layer. This may include the layer extent, count of items per annotation type and total count, CRS details, …
Source: defines general settings for the annotation layer. You can:
Set a Layer name that will be used to identify the layer in the project (in the Layers Panel, with expressions, …)
Display the layer’s Assigned Coordinate Reference System (CRS): you can change the layer’s CRS, selecting a recently used one in the drop-down list or clicking on
 Select CRS button
(see Seletor do Sistemas de Referência de Coordenadas). Use this process only if the CRS applied to the
layer is a wrong one or if none was applied.
Select CRS button
(see Seletor do Sistemas de Referência de Coordenadas). Use this process only if the CRS applied to the
layer is a wrong one or if none was applied.
Rendering:
You can set the Maximum (inclusive) and Minimum (exclusive) scale, defining a range of scale in which features will be visible. Out of this range, they are hidden. The
 Set to current canvas scale button helps you use the current map
canvas scale as boundary of the range visibility.
See Visibility Scale Selector for more information.
Set to current canvas scale button helps you use the current map
canvas scale as boundary of the range visibility.
See Visibility Scale Selector for more information.Linked layer: allows you to optionally set a linked visibility layer for the annotation layer. If set, then the annotations will only be drawn when the linked layer is visible in the map.
Opacity: You can make the underlying layer in the map canvas visible with this tool. Use the slider to adapt the visibility of your vector layer to your needs. You can also make a precise definition of the percentage of visibility in the menu beside the slider.
Blending mode at the Layer level: You can achieve special rendering effects with these tools that you may previously only know from graphics programs. The pixels of your overlaying and underlying layers are mixed through the settings described in Modos de Mistura.
Aplique: ref: efeitos de pintura<draw_effects> em todos os recursos da camada com o botão: guilabel: Efeitos de desenho.
Some of these options are accessible from the feature annotation Symbology properties.
Interagindo com feições
The Feature annotations have dedicated tools for creation depending on their type.
Family / based on |
Annotation tool |
Procedimento |
|---|---|---|
Geometry |
|
This is like digitizing a point, line or polygon vector feature. All the usual shortcuts for creating features apply when creating annotation items. A line or polygon annotation is drawn by left-clicking once for each vertex, with a final right mouse click to complete the shape. Snapping can be enabled while you draw, you can use the Advanced Digitizing Tools to precisely place vertices, and even switch the drawing tools to for example the streaming mode for completely free-form shapes. |
|
||
|
||
Text |
|
Left-click on the map canvas. |
|
Left-click to add vertices to the text basement line geometry, and right-click to end. As above, digitizing features capabilities are also available. |
|
|
Draw the rectangle box of the text, by left-clicking to add a first corner and left-clicking again to add the opposite one. |
|
Picture |
|
Draw the rectangle box of the picture, by left-clicking to add a first corner and left-clicking again to add the opposite one. Then pick an image or SVG file from the file explorer. |
Unlike common layers, an annotation layer does not need to be active before you
select its features. Simply grab the  Modify Annotations tool and
you will be able to interact with any feature annotation:
Modify Annotations tool and
you will be able to interact with any feature annotation:
Selection: left-click on the annotation. By default, annotations are rendered in the order of creation, meaning that recent annotations will be placed on top of older. You may need to play with the Z-index property of features in order to select ones they would sit above.
Moving: Left click on a selected annotation item to start moving it. A right-click or pressing Esc key cancels the move, while a second left click will confirm the move. The displacement can also be controlled pressing the cursor keys:
Shift+key for big movement
Alt+key for
1 pxmovement
Geometry modification: move over an annotation and purple squares are displayed on nodes of its underlying geometry. Left-click on the square, move and click again. For linear or polygonal annotations, double-clicking a segment will add a new vertex.
Delete: Pressing the Del or Backspace key while an annotation is selected will delete that annotation
Feature symbology
A selected annotation will display its Symbology properties in the Layer styling panel.
For polygon, polyline and marker annotations, you can modify the appearance using full capabilities of the symbol properties
For text-based annotations, an area with text editing tools helps you construct the string to display. It can be multiline, use HTML formatting and rely on QGIS expression functions. You can moreover modify the appearance using full capabilities of the text format properties.
Depending on the type of annotation, additional options are available.
For text annotation at point, it is also possible to:
set the text Alignment (left, center or right of the anchor point)
configure whether the text should Ignore map rotation or Rotate with map. In both cases, a custom Angle can be set for the feature orientation.
For text annotation along a line, configure an Offset from line in the unit of your choice
For text annotation in rectangle, it is also possible to:
set the text Horizontal alignment (left, center, right or justify) and Vertical alignment (top, vertical center or bottom) in the rectangle box
configure for the rectangle, the Margins distance in the units of your choice, the Frame and Background colors.
Picture annotations allow you to display a Raster image or an SVG image, using the Seletor de arquivos remoto ou incorporado. The placement and size of the picture can be set as Scale dependent size, Fixed size or Relative to map.
Moreover, you can enable display of the Frame and Background of the rectangle box, and configure them using fill symbols.
For text at point, text inside rectangle and picture annotations, you can Show callout when the picture or text anchor point is offset from its default placement. To create a callout for an annotation:
Select the annotation item
Move the anchor point, i.e., click the central and green X node and click at the new placement
In the annotation properties, press the … button to configure the callout properties.
Dica
Applying a balloon callout to a text or picture annotation will make you get their old-style balloon annotation display.
Configure a
Reference scale: indicates the map scale
at which symbol or text sizes which use paper-based units (such as millimeters or points) relate to.
The sizes will be scaled accordingly whenever the map is viewed at a different scale.
For instance, a line feature wide of 2mm at 1:2000 Reference scale
will be rendered using 4mm when the map is viewed at 1:1000.Set a Z-index: a feature with a higher index is placed on top of features with lower index. A convenient setting for both feature display and selection.
Modify some of the Layer rendering settings
7.1.7.2. Balloon annotations
You can add balloon annotations through menu or from the Annotations Toolbar:
 HTML Annotation to place the content of an
 htmlfile Form Annotation: useful to display attributes
of a vector layer in a customized
Form Annotation: useful to display attributes
of a vector layer in a customized uifile (see Fig. 7.14). This is similar to the custom attribute forms, but displayed in an annotation item. Also watch this video <https://www.youtube.com/watch?v=0pDBuSbQ02o&feature=youtu.be&t=2m25s> from Tim Sutton for more information.
Fig. 7.14 Examples of balloon annotations
To add a balloon annotation, select the corresponding tool and click on the map canvas. An empty balloon is added. Double-click on it and a dialog opens with various options. This dialog is almost the same for all the annotation types:
At the top, a file selector to fill with the path to an
htmloruifile depending on the type of annotation.- Fixed map position: when unchecked, the balloon placement
is based on a screen position (instead of the map), meaning that it’s always shown
regardless the map canvas extent.
Linked layer: associates the annotation with a map layer, making it visible only when that layer is visible.
Map marker: using QGIS symbols, sets the symbol to display at the balloon anchor position (shown only when Fixed map position is checked).
Frame style: sets the frame background color, transparency, stroke color or width of the balloon using QGIS symbols.
Contents margins: sets interior margins of the annotation frame.
- Live update allows you to live preview your changes.
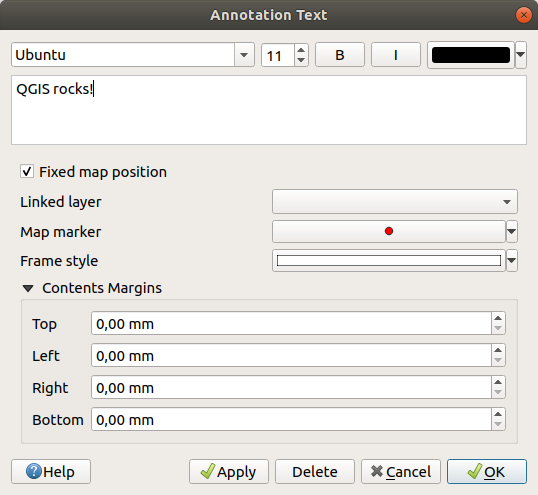
Fig. 7.15 A ballon annotation text dialog
When a balloon annotation tool is active, you can also:
Select an annotation
Resize an annotation
Move an annotation by map position (by dragging the map marker) or by moving only the balloon.
Delete an annotation: select it and either press the Del or Backspace button, or double-click it and press the Delete button in the properties dialog.
Right-click and in the contextual menu:
- Copy coordinate of the annotation’s map marker in various CRS
 Edit properties of the annotation. Same as double-clicking the annotation.
 Delete the annotation
7.1.8. Medição
7.1.8.1. Informação Geral
O QGIS fornece quatro meios de medição de geometrias:
interactive measurement tools

measuring in the
 Field Calculator
derived measurements in the Identificando Feições tool
the vector analysis tool:
Measuring works within projected coordinate systems (e.g., UTM) and unprojected data. The first three measuring tools behave equally to global project settings:
Diferentemente da maioria dos outros GIS, a métrica de medição padrão é elipsoidal, usando o elipsóide definido em . Isso ocorre quando os sistemas de coordenadas geográficas e projetadas são definidos para o projeto.
If you want to calculate the projected/planimetric area or distance using cartesian maths, the measurement ellipsoid has to be set to “None/Planimetric” (). However, with a geographic (ie unprojected) CRS defined for the data and project, area and distance measurement will be ellipsoidal.
However, neither the identify tool nor the field calculator will transform your data to the project CRS before measuring. If you want to achieve this, you have to use the vector analysis tool: . Here, measurement is planimetric, unless you choose the ellipsoidal measurement.
7.1.8.2. Measure length, areas, bearings and angles interactively
Click the icon in the Attribute toolbar to begin measurements.
The down arrow near the icon switches between
length,  area,
area,  bearing or
  angle.
The default unit used in the dialog is the one set in menu.
angle.
The default unit used in the dialog is the one set in menu.
For the Measure Line and the Measure Area the
measurements can be done in  Cartesian or
Ellipsoidal measure.
Cartesian or
Ellipsoidal measure.
Nota
Configurando a ferramenta de medição
While measuring length or area, clicking the Configuration button at the bottom of the widget opens the menu, where you can select the rubberband color, the precision of the measurements and the unit behavior. You can also choose your preferred measurement or angle units, but keep in mind that those values are overridden in the current project by the selection made in the menu, and by the selection made in the measurement widget.
All measuring modules use the snapping settings from the digitizing module (see section Setting the snapping tolerance and search radius). So, if you want to measure exactly along a line feature, or around a polygon feature, first set its layer snapping tolerance. Now, when using the measuring tools, each mouse click (within the tolerance setting) will snap to that layer.
The Measure Line measures distances between given points.
The tool then allows you to click points on the map.
Each segment length, as well as the total, shows up in the measure window.
In the measure window, you will see coordinates for all your points and distances.
Keep in mind that the first row will contain only coordinates, as it represents your starting point.
Now it is possible to copy all your line measurements at once to the clipboard
using the Copy button. Clicking the Configuration button
you will access to Measure Tool Copy Settings where you can set up
copy options. To stop measuring, click the right
mouse button.
Note that you can use the drop-down list near the total to change the measurement units interactively while working with the measure tool. This unit is retained for the widget until a new project is created or another project is opened.
The Info section in the dialog explains how calculations are made according to the CRS settings available.
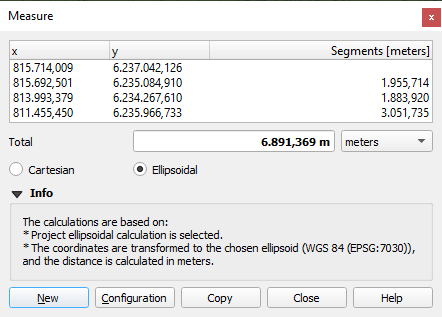
Fig. 7.16 Medir distância
Measure Area: Areas can also be measured. In the
measure window, the accumulated area size appears. Right-click to stop drawing.
The Info section is also available as well as the ability to switch between
different area units.
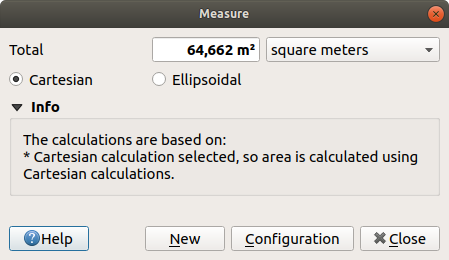
Fig. 7.17 Medir Área
Measure Bearing: You can also measure bearings.
The cursor becomes cross-shaped.
Click to draw the first point of the bearing,
then move the cursor to draw the second point.
The measurement is displayed in a pop-up dialog.
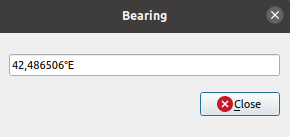
Fig. 7.18 Measure Bearing
Measure Angle: You can also measure angles.
The cursor becomes cross-shaped.
Click to draw the first segment of the angle you wish to measure,
then move the cursor to draw the desired angle.
The measurement is displayed in a pop-up dialog.
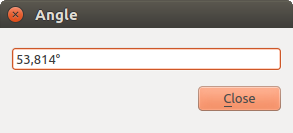
Fig. 7.19 Medir Ângulo
7.1.9. Definição de visualizações adicionais do mapa
It is also possible to open additional map views whose content could diverge
from the Layers panel current state.
To add a new map view, go to  . A new floating widget, mimicking the main map
view’s rendering, is added to QGIS. You can add as many map views as you need.
They can be kept floating, placed side by side or stacked on top of each
other.
. A new floating widget, mimicking the main map
view’s rendering, is added to QGIS. You can add as many map views as you need.
They can be kept floating, placed side by side or stacked on top of each
other.
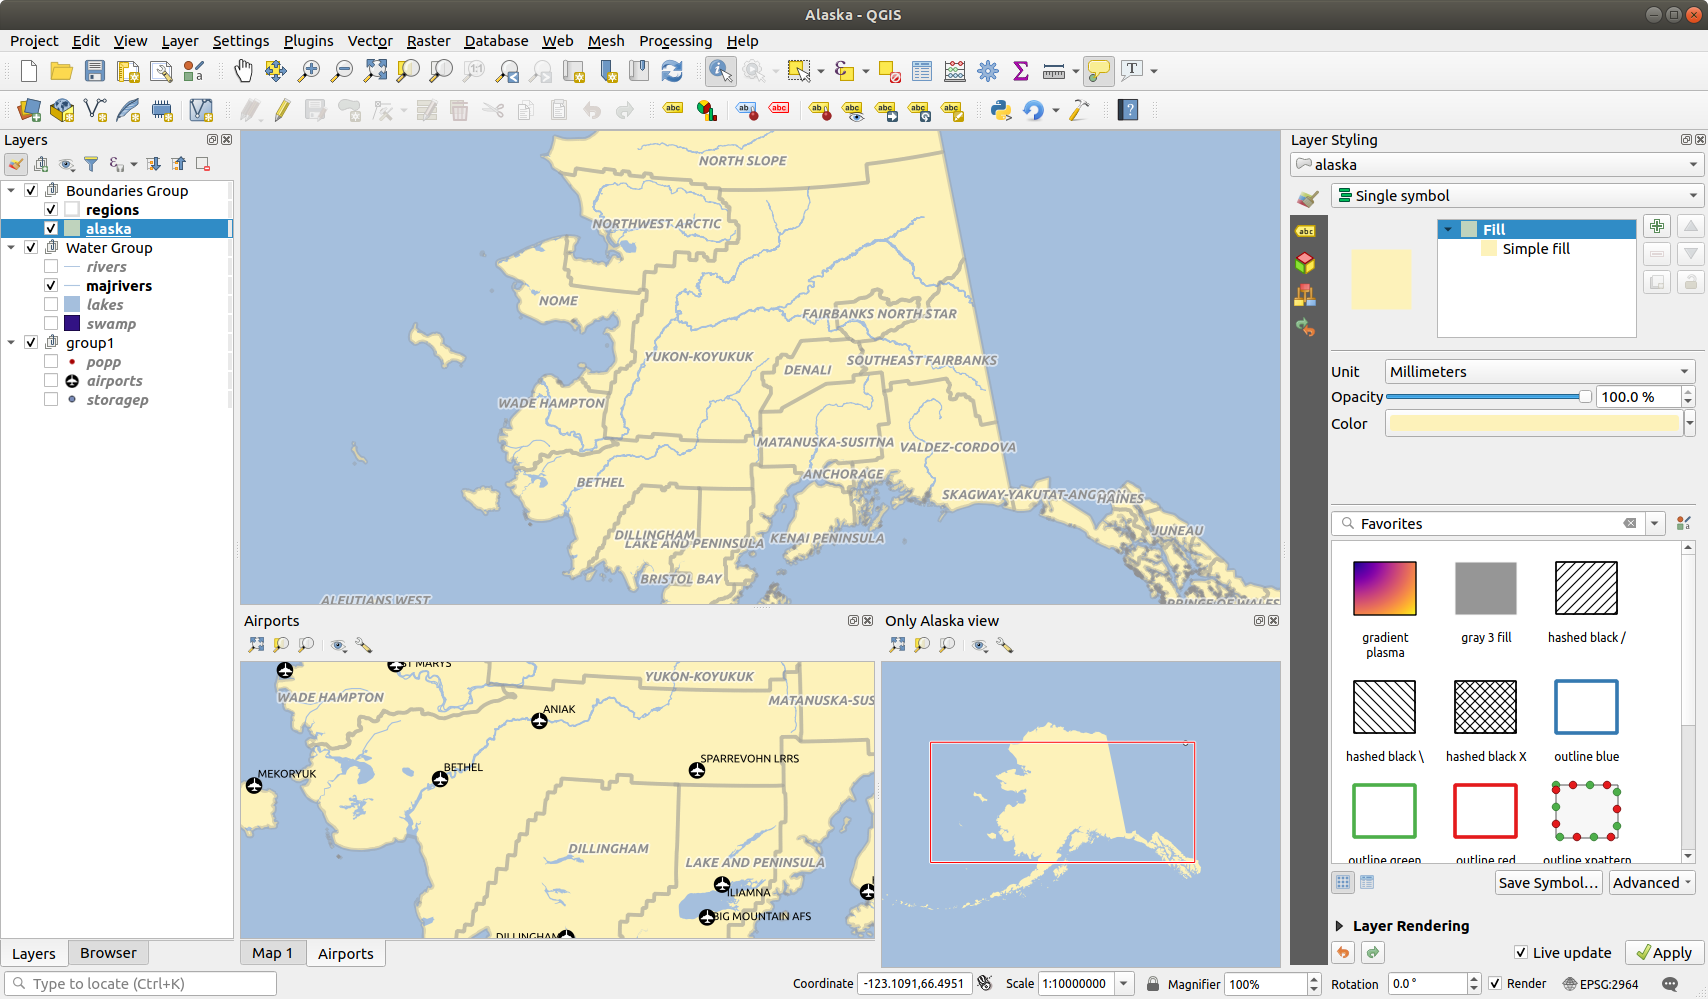
Fig. 7.20 Múltiplas visualizações de mapas com diferentes configurações
No topo de uma tela de mapa adicional, há uma barra de ferramentas com as seguintes capacidades:
 Zoom Full,
  Zoom to Selection
and
Zoom to Selection
and  Zoom to Layer(s) to navigate within the view
 Set View Theme to select the map theme
to display in the map view. If set to
Set View Theme to select the map theme
to display in the map view. If set to (none), the view will follow the Layers panel changes. Configurações de visualização para configura a visualização do mapa:
- Synchronize view center with main map:
syncs the center of the map views without changing the scale.
This allows you to have an overview style or magnified map which follows
the main canvas center.
 Synchronize view to selection: same as
zoom to selection
Synchronize view to selection: same as
zoom to selectionEscala
Rotação
guilabel:`Magnificação’
- Synchronize scale with the main map scale.
A Scale factor can then be applied, allowing you to have
a view which is e.g. always 2x the scale of the main canvas.
- Show annotations
- Mostrar a posição do cursor
- Show main canvas extent
- Show labels: allows to hide labels regardless
they are set in the displayed layers’ properties
Mudar SRC do mapa…
Renomear visualização…
7.1.10. Exportando a visualização do mapa
Maps you make can be layout and exported to various formats using the advanced capabilities of the print layout or report. It’s also possible to directly export the current rendering, without a layout. This quick “screenshot” of the map view has some convenient features.
To export the map canvas with the current rendering:
Vá para
Dependendo do seu formato de saída, selecione
 Export Map to Image…
ou
 Export Map to PDF…
The two tools provide you with a common set of options. In the dialog that opens:
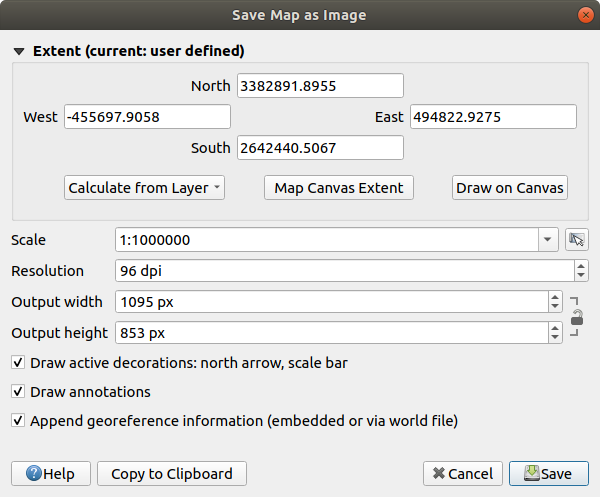
Fig. 7.21 The Save Map as Image dialog
Choose the Extent to export: it can be the current view extent (the default), the extent of a layer or a custom extent drawn over the map canvas. Coordinates of the selected area are displayed and manually editable.
Enter the Scale of the map or select it from the predefined scales: changing the scale will resize the extent to export (from the center).
Defina a Resolução da saída
Control the Output width and Output height in pixels of the image: based by default on the current resolution and extent, they can be customized and will resize the map extent (from the center). The size ratio can be locked, which may be particularly convenient when drawing the extent on the canvas.
- Draw active decorations: in use decorations (barra de escala, título, malha, Rosa dos ventos…) são exportados com o mapa
- Desenhar anotações para exportar qualquer annotation
- Append georeference information (embedded or
via world file): depending on the output format, a world file of
the same name (with extension
PNGWforPNGimages,JPGWforJPG, …) is saved in the same folder as your image. ThePDFformat embeds the information in the PDF file. Ao exportar para PDF, mais opções estão disponíveis na caixa de diálogo Salvar mapa como PDF…:
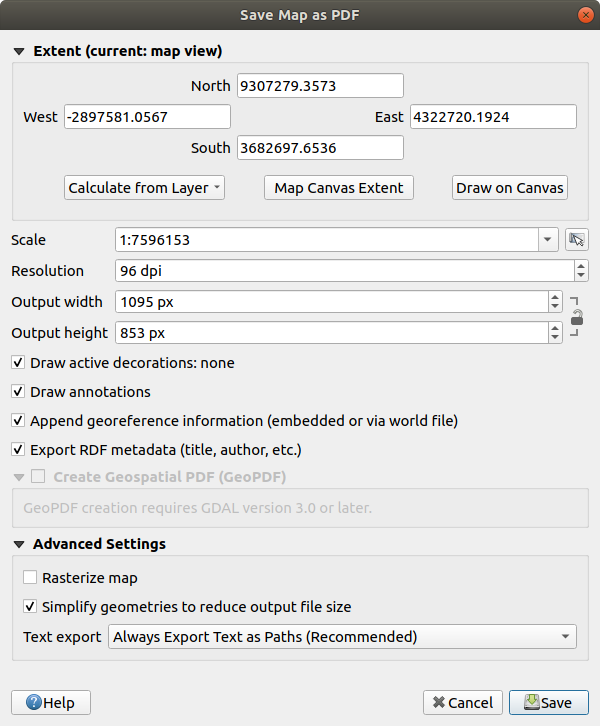
Fig. 7.22 A caixa de diálogo Salvar Mapa como PDF
- Exportar metadados RDF do documento, como título, autor, data, descrição…
- Create Geospatial PDF: Generate a
georeferenced PDF file.
You can:
Choose the Geospatial PDF Format
- Include vector feature information in the
Geospatial PDF file: will include all the geometry and attribute
information from features visible within the map in the output
Geospatial PDF file.
Nota
A Geospatial PDF file can also be used as a data source. For more on Geospatial PDF support in QGIS, see https://north-road.com/2019/09/03/qgis-3-10-loves-geospatialpdf/.
Rasterize map
- Simplify geometries to reduce output file size:
Geometries will be simplified while exporting the map by removing
vertices that are not discernibly different at the export
resolution (e.g. if the export resolution is
300 dpi, vertices that are less than1/600 inchapart will be removed). This can reduce the size and complexity of the export file (very large files can fail to load in other applications). Set the Text export: controls whether text labels are always or preferably exported as text or outline objects.
Clique :guilabel:`Salvar’ para selecionar o local, nome e formato do arquivo.
When exporting to image, it’s also possible to Copy to clipboard the expected result of the above settings and paste the map in another application such as LibreOffice, GIMP…