중요
번역은 여러분이 참여할 수 있는 커뮤니티 활동입니다. 이 페이지는 현재 85.83% 번역되었습니다.
2.4. 수업: 심볼
심볼은 맵 상에 레이어를 시각적으로 표현하는 방법입니다. 공간 성격을 가지는 데이터를 표현하는 다른 방법들에 비해, GIS의 강점은 사용자가 작업하는 데이터의 역동적인 시각적 표현을 할 수 있다는 것입니다.
따라서 맵의 (개별 레이어의 심볼에 의존하는) 시각적 표현이 매우 중요합니다. 여러분이 생산한 맵의 최종 이용자는 맵이 나타내는 내용을 쉽게 알아볼 수 있어야 합니다. 마찬가지로 여러분이 작업할 때 데이터를 탐색할 수 있어야 하는데, 훌륭한 심볼이 큰 도움이 됩니다.
즉 적절한 심볼을 갖추는 일은 그냥 그러면 좋다 정도의 일이 아니라는 겁니다. 여러분이 GIS를 제대로 사용하려면, 사람들이 이용할 수 있는 맵과 정보를 생산하려면, 심볼이 필수적입니다.
이 수업의 목표: 벡터 레이어에 대해 사용자가 원하는 심볼을 생성하기.
2.4.1. ★☆☆ 따라해보세요: 색상 변경하기
레이어의 심볼을 변경하려면 해당 레이어의 Layer Properties 를 여십시오. 먼저 landuse 레이어의 색상을 바꿔봅시다.
레이어 목록에 있는
landuse레이어를 오른쪽 클릭하십시오.나타난 컨텍스트 메뉴에서 Properties… 메뉴 항목을 선택하십시오.
참고
레이어 목록에서 레이어를 더블 클릭해도 레이어 속성에 접근할 수 있습니다.
팁
Layers 패널 최상단에 있는
 버튼을 누르면 Layer Styling 패널이 열릴 것입니다. 이 패널을 사용해서 레이어의 일부 속성을 변경할 수 있습니다: 기본적으로, 변경 사항은 즉시 적용될 것입니다!
Layer Properties 창에서,
Symbology 탭을 선택하십시오: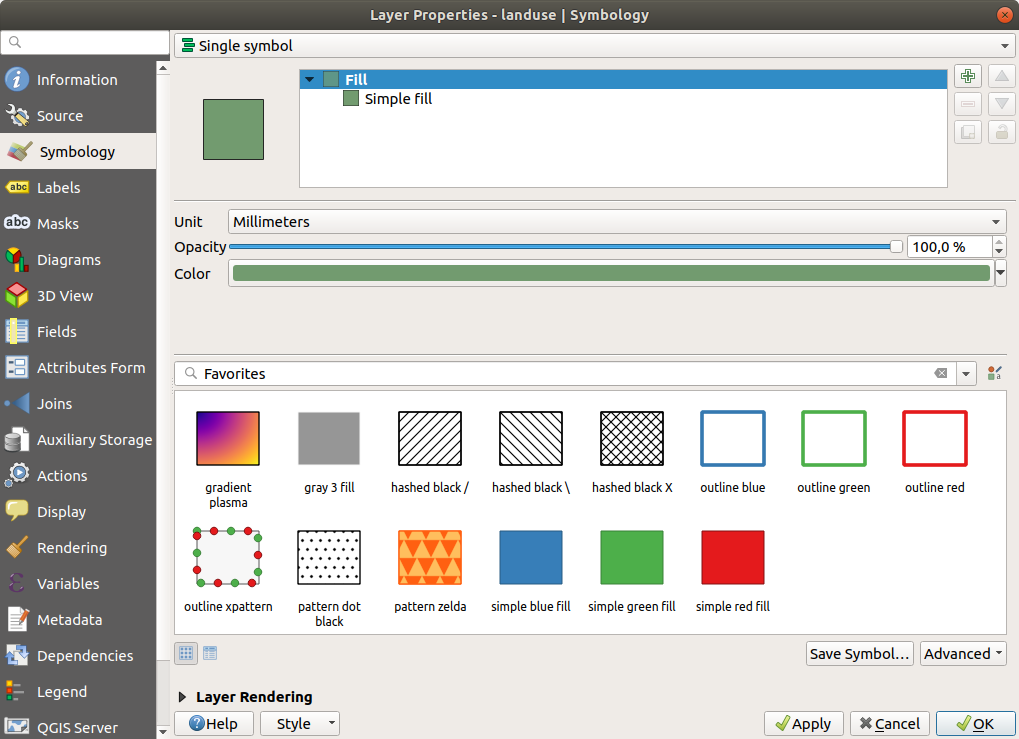
Color 라벨 옆에 있는 색상 선택 버튼을 클릭하십시오. 표준 색상 대화창이 나타날 것입니다.
회색을 선택한 다음 OK 를 클릭합니다.
다시 Layer Properties 창의 OK 를 클릭하면 레이어의 색상이 변경되는 것을 볼 수 있습니다.
2.4.2. ★☆☆ 혼자서 해보세요:
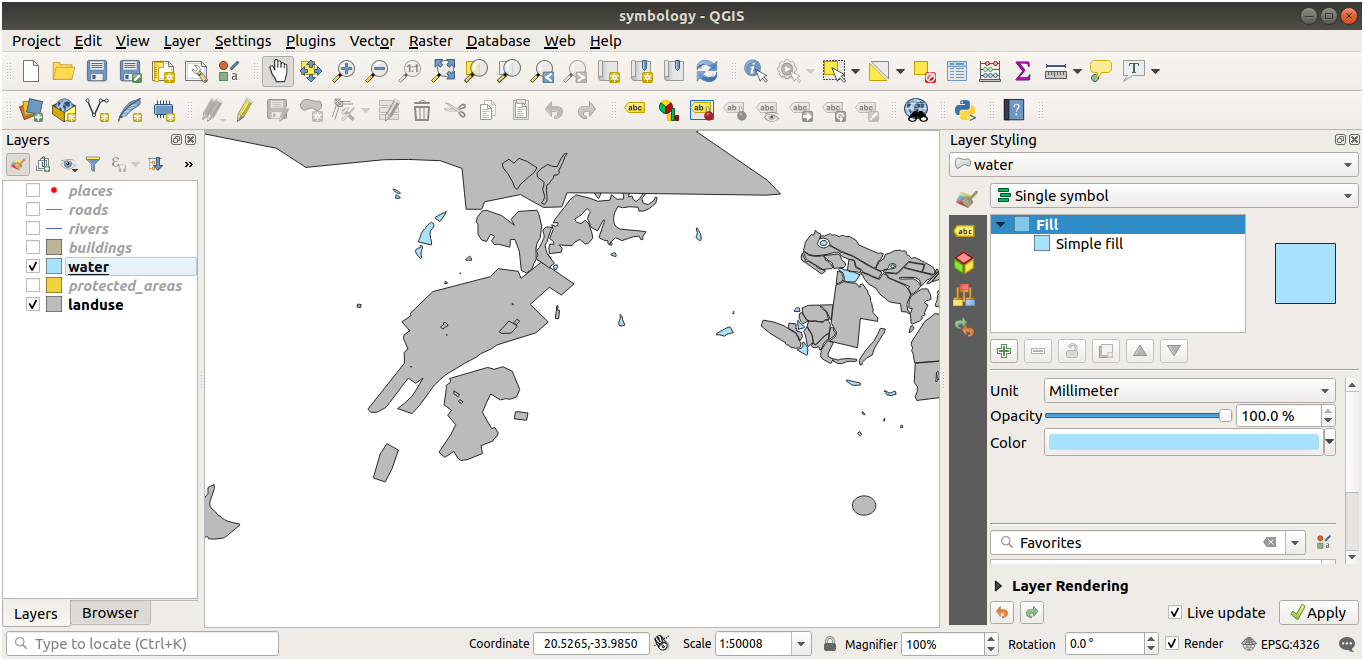
water 레이어의 색상을 하늘색으로 변경하십시오. Layer Properties 메뉴 대신 Layer Styling 패널을 사용해보십시오.
Solution
색상이 여러분이 예상한대로 변경되는지 확인하십시오.
범례에서
water레이어를 선택한 다음 Open the Layer Styling panel 버튼을 클릭하면 끝입니다. 물과 어울리는 색상으로 변경하십시오.
한 번에 레이어 하나씩만 작업하길 원하고 다른 레이어들에 신경을 쓰고 싶지 않은 경우, 레이어 목록에서 레이어 이름 옆에 있는 체크박스를 클릭해서 레이어를 숨길 수 있습니다. 체크박스가 비어 있다면 레이어가 숨겨져 있는 것입니다.
2.4.3. ★☆☆ 따라해보세요: 심볼 구조 변경하기
색상만 제대로 바꿔도 맵이 괜찮아지지만, 레이어의 심볼에는 색상만 있는 것이 아닙니다. 이제 서로 다른 토지이용구역 사이의 라인을 제거해서 맵이 너무 조밀하게 보이지 않도록 해보겠습니다.
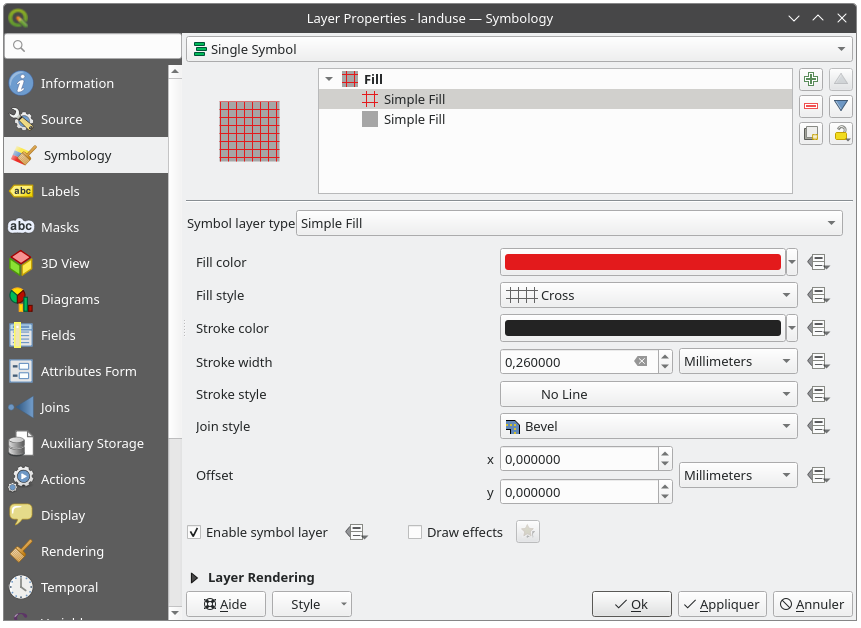
landuse레이어의 Layer Properties 창을 엽니다. Symbology 탭 아래에서 이전과 동일한 유형의 대화창을 볼 수 있습니다. 하지만 이번엔, 그냥 색상만 바꾸는 것보다 더 많은 작업을 할 것입니다.심볼 레이어 트리에서 Fill 드롭다운 메뉴를 펼쳐서 Simple fill 옵션을 선택하십시오.
Stroke style 드롭다운 메뉴를 클릭하십시오. 이 시점에서는 짧은 선과 Solid Line 이라는 단어가 보일 것입니다.
이것을 No Line 으로 변경하십시오.
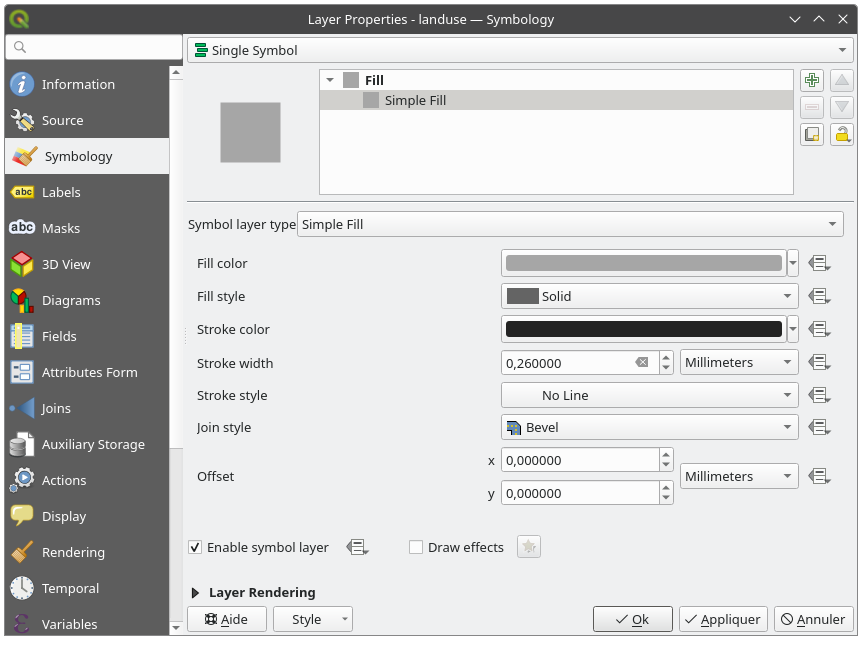
:guilabel:`OK`를 클릭하십시오.
이제 landuse 레이어의 각 구역 사이에 있던 라인들이 사라질 것입니다.
2.4.4. ★☆☆ 혼자서 해보세요:
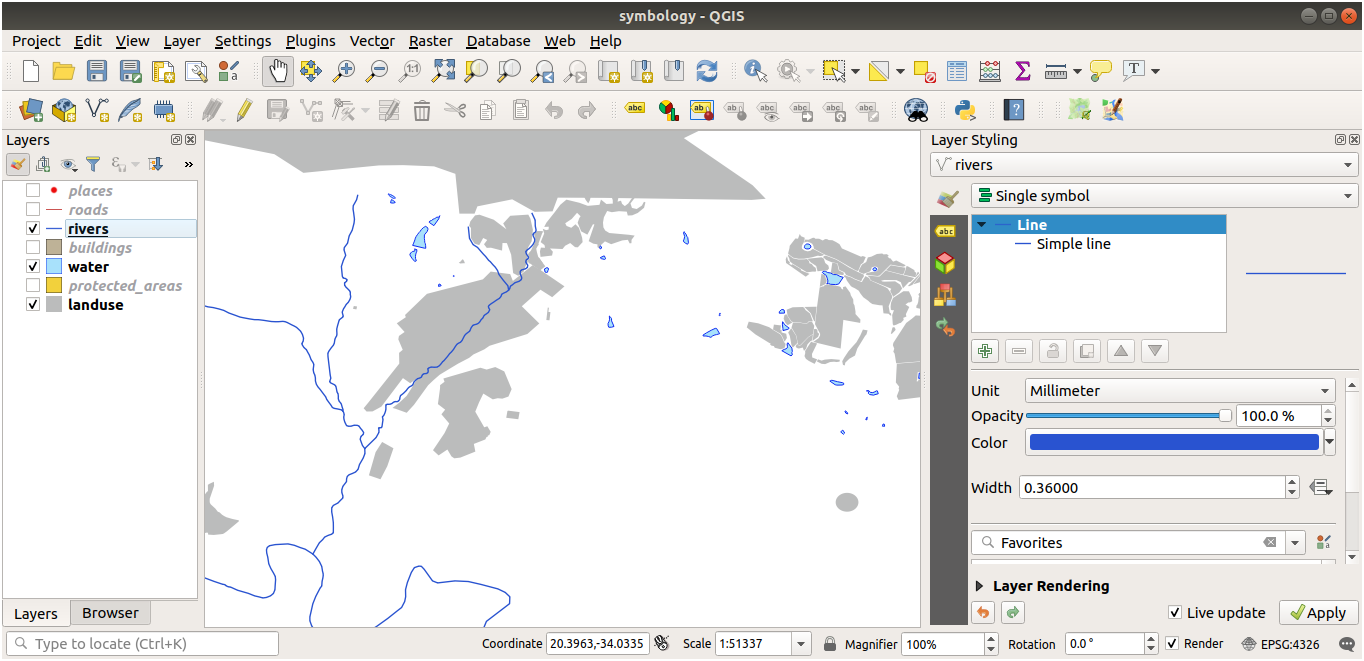
water레이어가 진한 파란색 윤곽선을 가지도록 레이어 심볼을 다시 변경하십시오.rivers레이어의 심볼을 변경해서 수로를 합리적으로 표현해보십시오.
Open the Layer Styling panel 버튼을 사용하면 모든 변경 사항을 즉시 볼 수 있다는 사실을 기억하십시오. 이 패널은 레이어의 심볼을 작업하는 동안 각각의 변경 사항을 실행 취소도 할 수 있게 해줍니다.
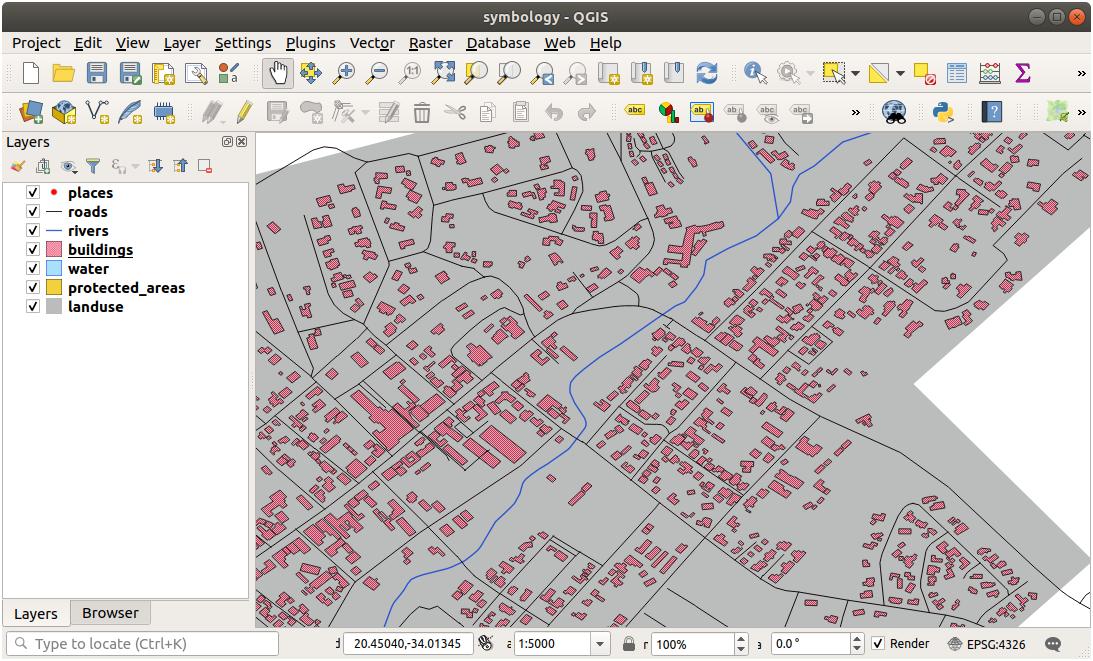
해답
이제 여러분의 맵은 다음과 같이 보여야 합니다:
여러분이 초급 수준 사용자라면, 이제 그만해도 좋습니다.
앞의 방법을 사용해서 남아 있는 모든 레이어의 색상과 스타일을 변경하십시오.
각 객체들에 대해 자연스러운 색상을 사용해보십시오. 예를 들어 도로가 빨간색이나 파란색이면 이상하겠죠. 회색 또는 검정색을 사용하는 편이 낫습니다.
또, 폴리곤에 대해 서로 다른 Fill style 과 Stroke style 설정을 마음껏 시험해보십시오.
2.4.5. ★★☆ 따라해보세요: 축척 기반 가시성
가끔 레이어가 특정 축척에서 잘 맞지 않는다고 느껴질 때가 있습니다. 예를 들면 전 대륙을 담은 데이터셋은 상세함이 부족해서 마을 수준에서는 정확하지 않을 수도 있습니다. 이런 경우 부적절한 축척에서는 해당 데이터셋을 숨기는 편이 좋습니다.
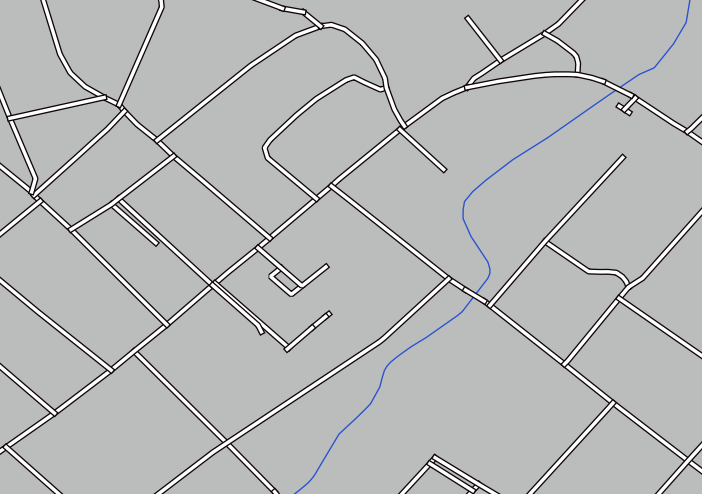
우리의 경우, 소축척 뷰에서 건물을 숨기자고 결정할 수도 있습니다. 예를 들면 이 맵은…
…별로 유용하지 않습니다. 이 축척에서는 건물을 구별하기 힘듭니다.
축척 기반 렌더링을 활성화하려면,
buildings레이어의 Layer Properties 대화창을 여십시오. Rendering 탭을 선택하십시오.
Scale dependent visibility 라는 체크박스를 클릭해서 축척 기반 렌더링을 활성화시키십시오:
Minimum 값을
1:10000으로 변경하십시오.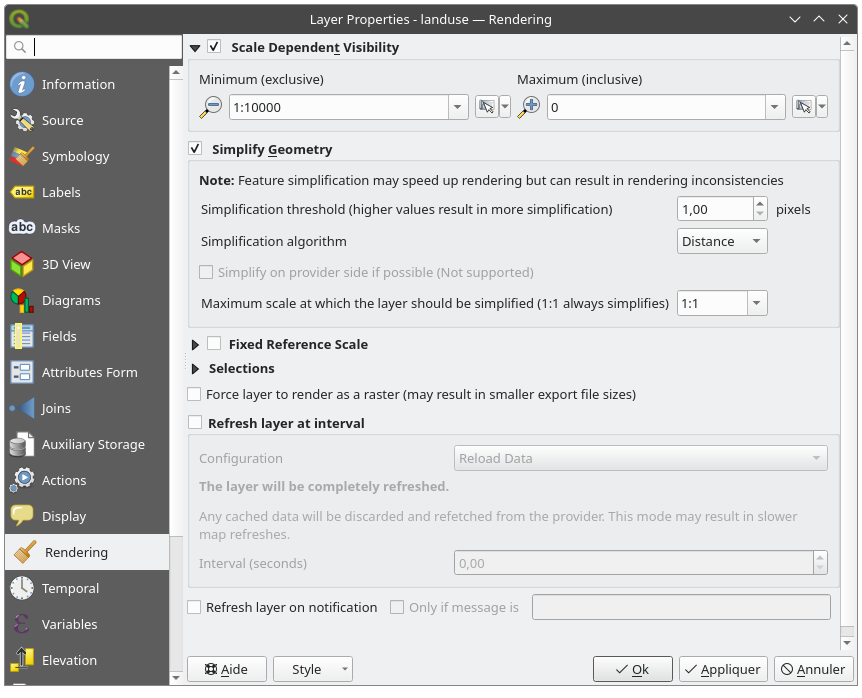
:guilabel:`OK`를 클릭하십시오.
그 결과 맵이 어떻게 변하는지 확대/축소해보십시오. buildings 레이어가 언제 사라지고 언제 나타나는지 아시겠습니까?
참고
마우스 휠을 써서 조금씩 확대/축소할 수 있습니다. 또는 확대/축소 도구를 써서 창 크기에 맞게 확대/축소할 수도 있습니다.


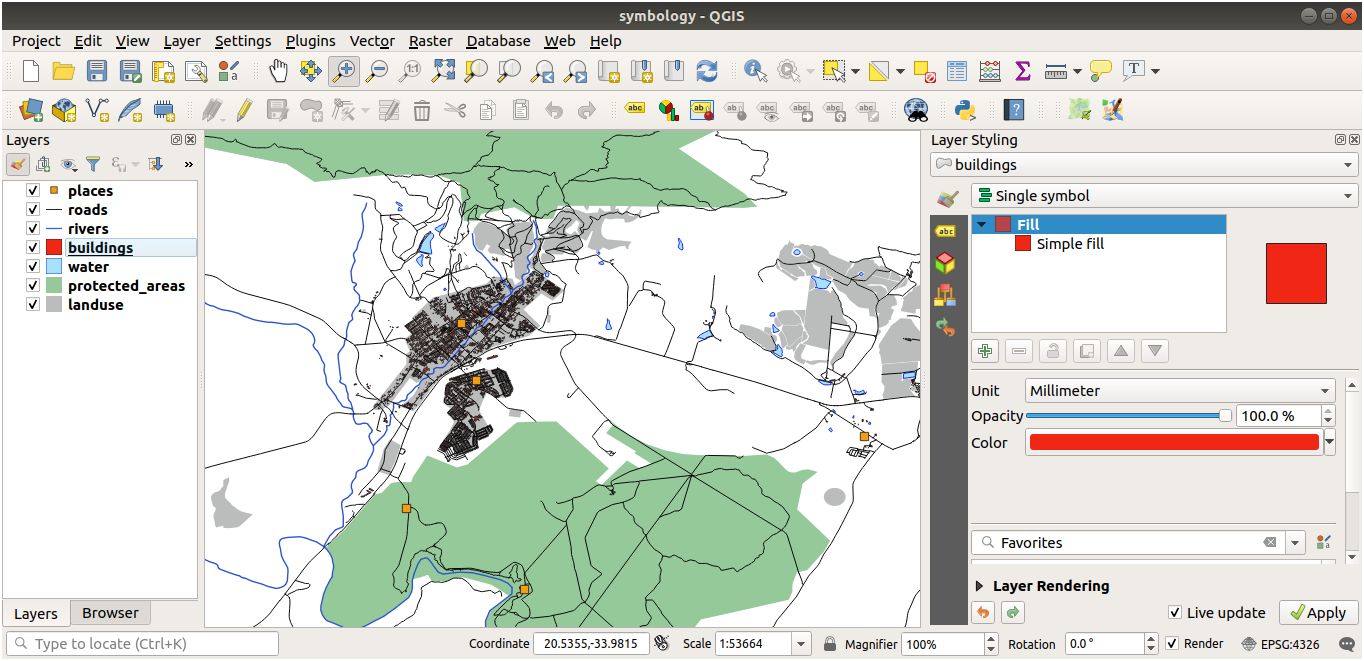
2.4.6. ★★☆ 따라해보세요: 심볼 레이어 추가하기
이제 레이어에서 단순한 심볼을 변경하는 방법을 알았으니, 다음으로 좀 더 복잡한 심볼을 생성해볼 차례입니다. QGIS에서는 심볼 레이어를 이용합니다.
landuse레이어의 심볼 속성 패널로 돌아가십시오. (심볼 레이어 트리에서 Simple fill 을 클릭하면 됩니다.)이 예제의 현재 심볼에는 윤곽선이 없습니다. (즉 No Line 경계선 스타일을 사용하고 있습니다.)
트리에서 Fill 수준을 선택한 다음
 Add symbol layer 버튼을 클릭하십시오. 새로운 심볼 레이어가 추가되고, 대화창이 다음과 비슷하게 바뀔 것입니다:
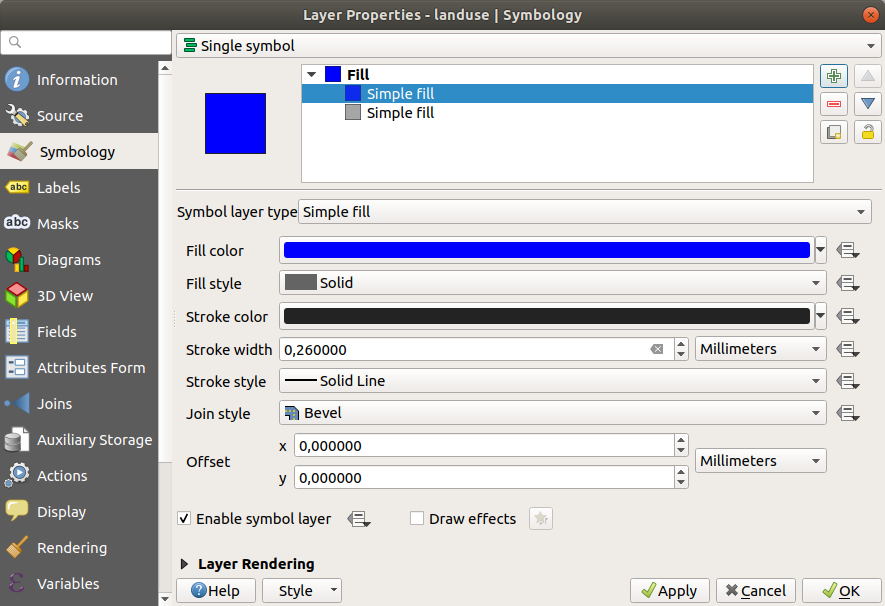
예를 들어 색상이 어느 정도 다를 수도 있지만, 그것과는 상관없이 여러분이 색상을 변경할 예정이니까요.
이제 두 번째 심볼 레이어가 나타납니다. 단색이기 때문에, 당연히 이전 심볼 유형을 완전히 가리게 됩니다. 또 이 레이어는 Solid Line 경계선 스타일을 사용하는데, 당연히 이 심볼을 바꿔야 합니다.
참고
맵 레이어와 심볼 레이어를 착각하지 않는 것이 중요합니다. 맵 레이어는 맵에 불러온 벡터(또는 래스터)입니다. 심볼 레이어는 맵 레이어를 표현하는 데 쓰이는 심볼의 일부입니다. 이 수업에서는 착각하지 않도록 맵 레이어를 그냥 레이어로 보통 부르지만, 심볼 레이어는 언제나 심볼 레이어라고 부를 것입니다.
새로운 Simple Fill 심볼 레이어를 선택한 다음:
이전처럼 경계선 스타일을 No Line 으로 설정합니다.
채우기 스타일을 다음과 같이 Solid 또는 No brush 이외의 것으로 변경합니다:
:guilabel:`OK`를 클릭하십시오.
이제 여러분의 결과물을 보고 필요한 대로 조정할 수 있습니다. 추가 심볼 레이어를 여러 개 추가하는 방식으로 여러분의 레이어를 위한 일종의 텍스터를 생성할 수도 있습니다.

재미있죠! 그러나 실제 맵에 사용하기에는 색상이 너무 많을지도 모르겠군요…
2.4.7. ★★☆ 혼자서 해보세요:
필요한 경우 확대하는 것을 잊지 말고, 앞에서 설명한 방법을 사용해서 ``buildings``레이어에 단순하지만 보기 쉬운 텍스처를 생성해보십시오.
해답
여러분이 원하는 대로 buildings 레이어를 사용자 정의해보십시오. 그러나 맵 상에서 서로 다른 레이어들을 쉽게 구별할 수 있어야 한다는 사실을 잊지 마십시오.
다음은 그 예시입니다:
2.4.8. ★★☆ 따라해보세요: 심볼 수준 정렬시키기
서로 다른 맵 레이어를 렌더링할 때와 마찬가지로 심볼 레이어도 순차적으로 렌더링됩니다. 즉 하나의 심볼에 많은 심볼 레이어를 사용할 경우 기대하지 않은 결과가 나올 수도 있다는 이야기입니다.
(앞에서 설명한 심볼 레이어를 추가하는 방법을 사용해서)
roads레이어에 심볼 레이어를 추가하십시오.기저 라인(base line)의 Stroke width 를
1.5로 그리고 색상을 검정색으로 설정하십시오.새로운, 가장 위에 있는 레이어의 라인 두께를
0.8로 그리고 색상을 하얀색으로 설정하십시오.
그러면 이렇게 보일 것입니다:
이제 도로의 심볼이 거리 처럼 보이는군요. 하지만 교차하는 지점마다 라인들이 중첩하고 있습니다. 이건 아니지요!
이런 일이 일어나지 않게 하려면, 심볼 레이어의 순서를 바꿔 서로 다른 심볼 레이어들이 렌더링 되는 순서를 조정해야 합니다.
심볼 레이어의 순서를 변경하려면:
Select the topmost
Linelayer in the symbol layers tree.대화창의 우하단에 있는 메뉴 항목을 클릭하십시오.
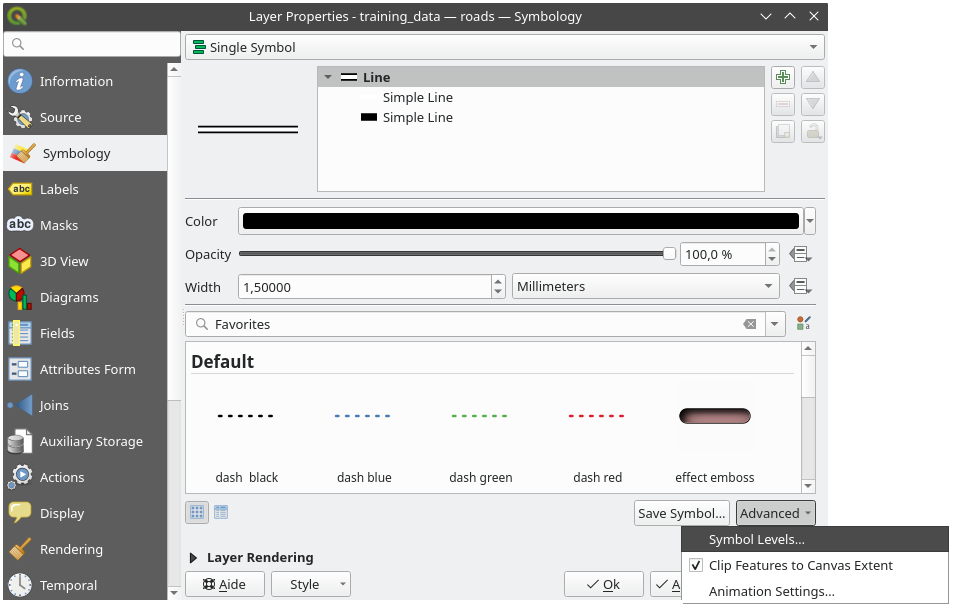
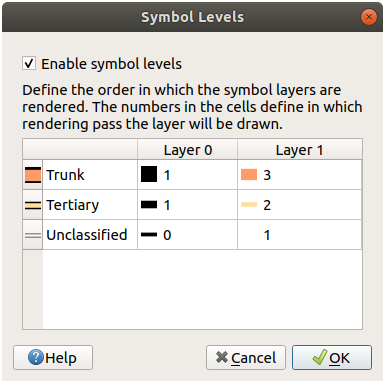
다음 대화창이 열릴 것입니다:
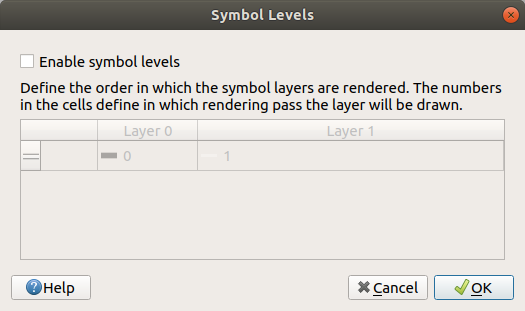
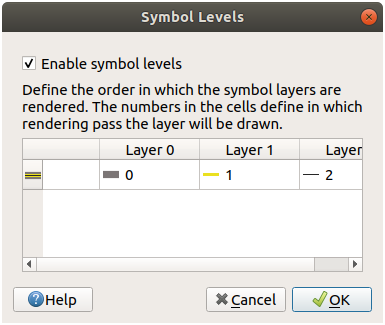
 Enable symbol levels 옵션을 체크하십시오. 그러면 대응하는 수준 번호를 입력해서 각 심볼의 레이어 순서를 설정할 수 있습니다. 0은 최하단 레이어라는 의미입니다.
이 경우엔, 다음과 같이 옵션을 활성화시키기만 하면 됩니다:
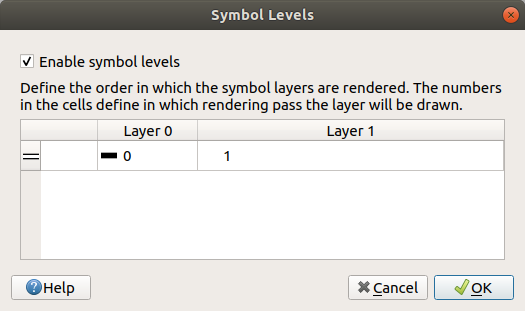
이렇게 하면 하얀색 라인을 굵은 검은색 경계선 위로 렌더링할 것입니다:
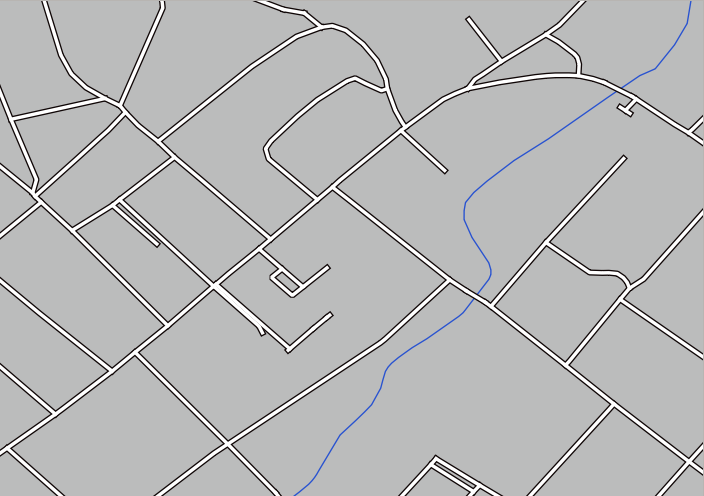
OK 를 두 번 클릭해서 맵으로 돌아갑니다.
이제 맵이 다음과 같이 보일 것입니다:
작업을 마쳤을 때, 향후 심볼을 다시 변경할 경우 여러분의 작업이 사라지지 않도록 심볼 자체를 저장하는 것을 잊지 마십시오. Layer Properties 대화창 하단에 있는 Save Style… 버튼을 클릭하면 현재 심볼 스타일을 저장할 수 있습니다. 이 예제에서는 QGIS QML Style File 포맷을 사용할 것입니다.
solution/styles/better_roads.qml 폴더에 여러분의 스타일을 저장하십시오. Load Style… 버튼을 클릭하면 언제라도 이전에 저장했던 스타일을 불러올 수 있습니다. 스타일을 변경하기 전에, 여러분이 대체하려는 스타일 가운데 저장하지 않았던 모든 스타일이 사라질 것이라는 사실을 기억하세요.
2.4.9. ★★☆ 혼자서 해보세요:
roads 레이어의 모양을 다시 변경하십시오.
얇은 회색 경계선을 가지고 가운데 얇은 검정색 라인이 지나가는, 좁은 노란색 도로를 만들어보십시오. 대화창을 통해 레이어들의 렌더링 순서를 변경해야 할지도 모른다는 사실을 기억하십시오.
해답
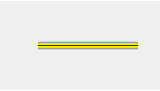
이런 심볼을 만들려면, 심볼 레이어 3개가 필요합니다:
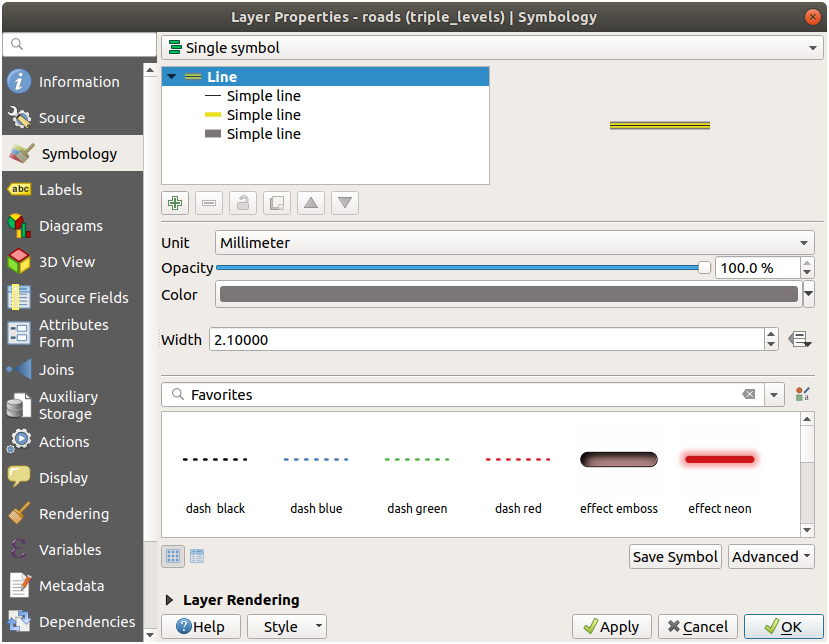
가장 아래 있는 심볼 레이어는 넓은 회색 실선입니다. 그 위에는 약간 더 얇은 노란색 실선이 있고 마지막으로 가장 위에는 더 얇은 검정색 실선이 있습니다.
여러분의 심볼 레이어들이 앞의 예시와 비슷하지만 원하는 결과가 아닌 경우:
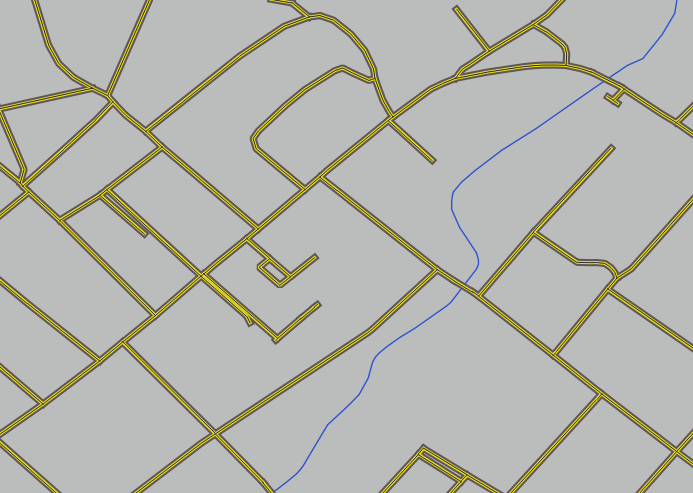
여러분의 심볼 레이어들이 다음처럼 보이는지 확인하십시오:
이제 여러분의 맵은 다음과 같이 보여야 합니다:
2.4.10. ★★★ 혼자서 해보세요:
심볼 수준은 범주화 레이어들(예: 심볼 여러 개를 가지고 있는 레이어들)에 대해서도 작동합니다. 아직 범주화(classification)에 대해 배우지 않았기 때문에, 기초적인 사전 범주화 데이터를 작업하게 될 것입니다.
새 프로젝트를 생성하고
roads데이터셋만 추가하십시오.레이어에
exercise_data/styles에 있는advanced_levels_demo.qml스타일 파일을 적용시키십시오. Layer Properties 대화창 하단에 있는 메뉴 항목을 사용하면 됩니다.Swellendam 지역으로 확대하십시오.
심볼 레이어를 사용해서 다음 그림처럼 레이어의 윤곽선이 서로 이어지도록 만드십시오:
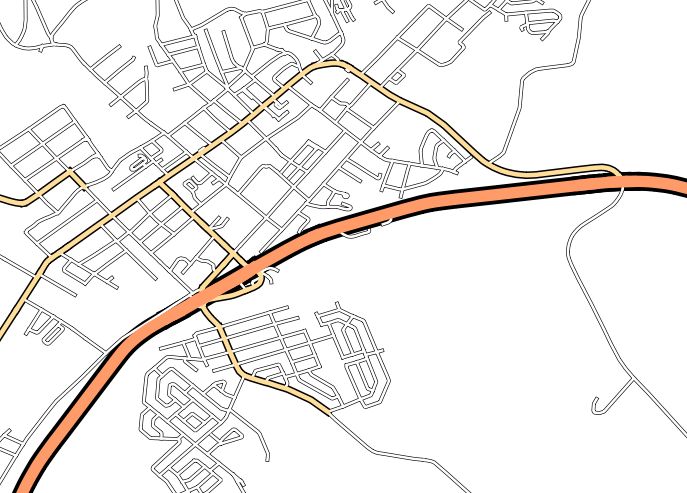
해답
여러분의 심볼 수준을 다음 값들로 조정하십시오:
서로 다른 값들로 서로 다른 결과물이 생성되도록 시험해보십시오.
다음 예제를 풀기 전에 원본 맵을 다시 여십시오.
2.4.11. ★★☆ 따라해보세요: 심볼 레이어 유형
채우기 색상을 설정하고 사전 정의 패턴을 사용하는 일 이외에도, 서로 완전히 다른 심볼 레이어 유형들을 사용할 수 있습니다. 지금까지 사용했던 유형은 Simple Fill 유형뿐이었습니다. 좀 더 고급인 심볼 레이어 유형을 사용하면 여러분의 심볼들을 더 심도 있게 사용자 정의할 수 있습니다.
각각의 (포인트, 벡터, 폴리곤) 벡터 유형은 고유의 심볼 레이어 유형 집합을 갖추고 있습니다. 먼저 포인트에 대해 사용할 수 있는 유형들을 살펴보겠습니다.
포인트 심볼 레이어 유형
places를 제외한 다른 모든 레이어를 체크 해제하십시오.places레이어의 심볼 속성을 변경하십시오: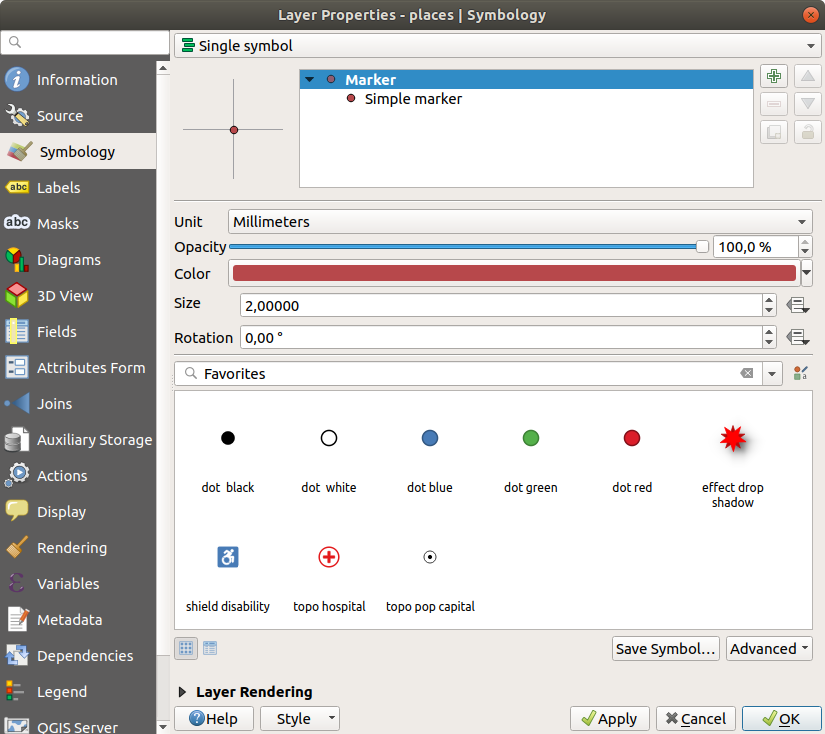
심볼 레이어 트리에서 Simple marker 레이어를 선택한 다음 Symbol layer type 드롭다운 메뉴를 클릭하면, 여러 가지 심볼 레이어 유형에 접근할 수 있습니다:
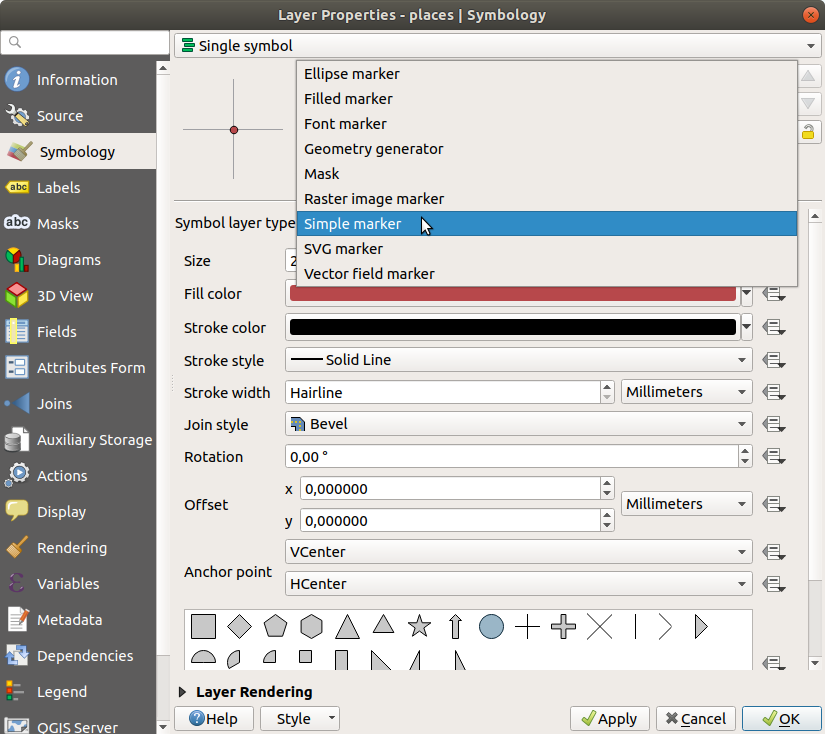
사용할 수 있는 다양한 옵션들을 살펴보고, 여러분이 적합하다고 생각하는 스타일의 심볼을 선택하십시오.
고르기 힘든 경우, 경계선은 하얀색, 채우기는 옅은 녹색, Size 는
3.00, 그리고 Stroke width 는0.5로 설정한 동그란 Simple marker 를 사용해보십시오.
라인 심볼 레이어 유형
라인 데이터에 대해 사용할 수 있는 다양한 옵션들을 보려면:
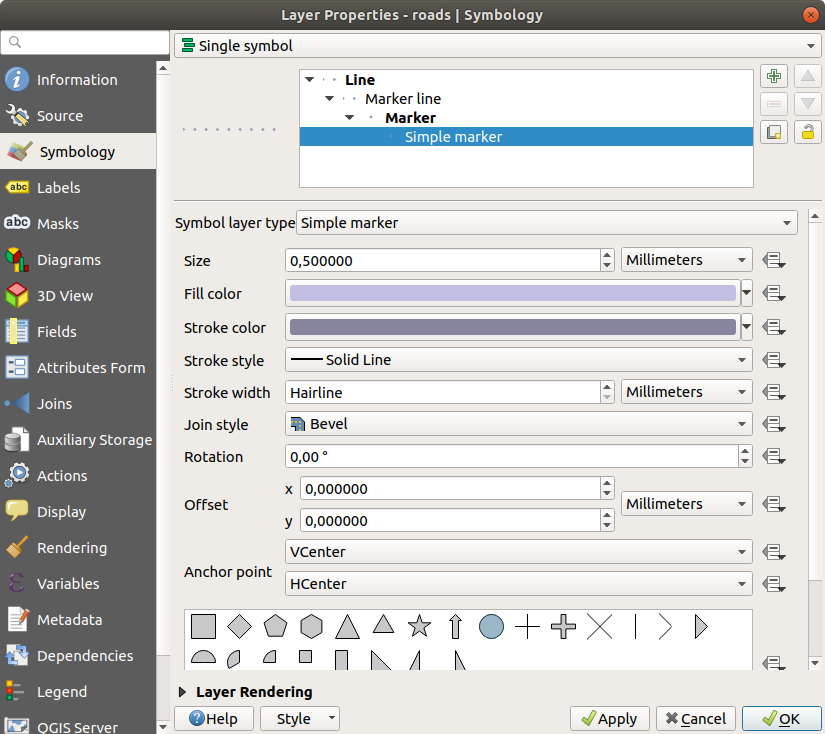
roads레이어의 가장 위에 있는 심볼 레이어의 Symbol layer type 을 Marker line 으로 변경하십시오: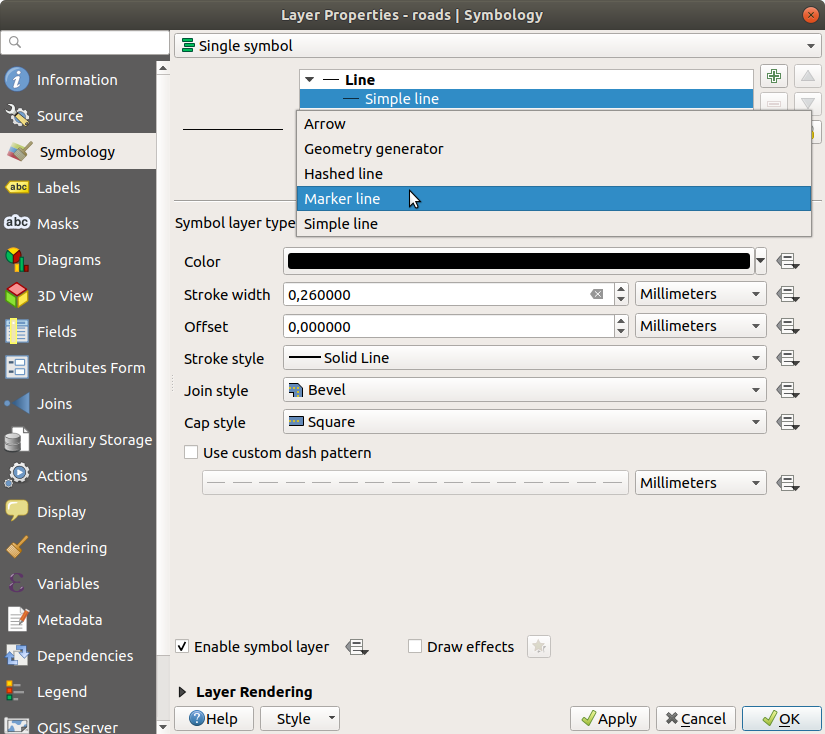
심볼 레이어 트리에서 Simple marker 레이어를 선택한 다음, 심볼 속성을 다음 대화창과 일치하도록 변경하십시오:
Marker line 레이어를 선택한 다음 간격(interval)을
1.00으로 변경하십시오: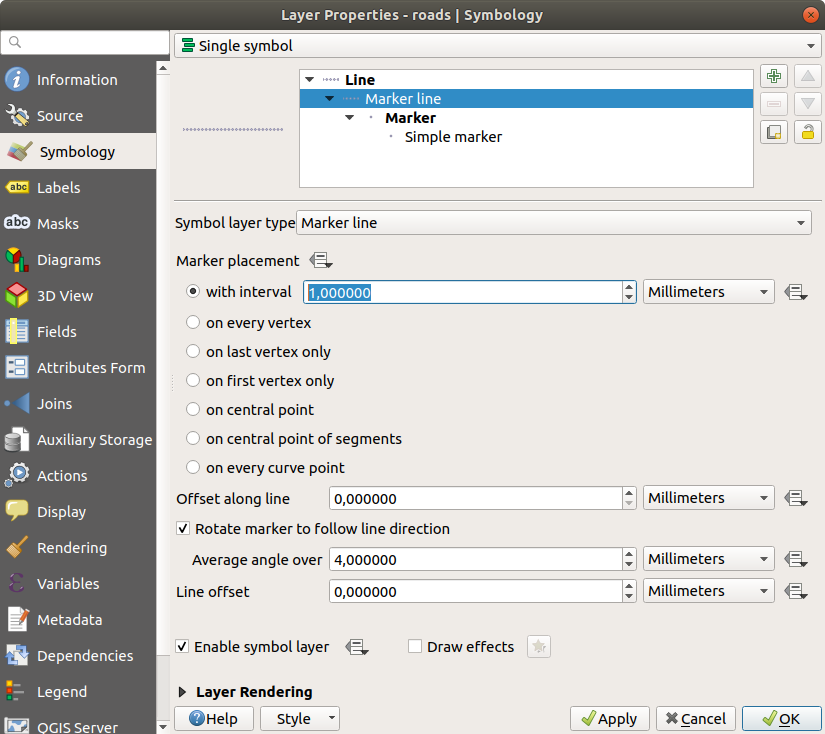
스타일을 적용하기 전에 (앞에서 사용했던 대화창을 통해) 심볼 수준이 정확한지 확인하십시오.
스타일을 적용한 다음, 맵 상에 스타일이 어떻게 표현되는지 살펴보십시오. 이 심볼들은 도로를 따라 방향이 바뀌지만, 항상 도로를 따라 휘어지지는 않습니다. 이 습성은 어떤 목적에는 부합하지만, 다른 목적에는 아닐 수도 있습니다. 원한다면 해당 심볼 레이어를 원래대로 다시 바꿀 수 있습니다.
폴리곤 심볼 레이어 유형
폴리곤 레이어에 대해 사용할 수 있는 다양한 옵션들을 보려면:
이전의 다른 레이어들과 마찬가지로,
water레이어의 Symbol layer type 을 변경하십시오.목록에 있는 서로 다른 옵션들이 각각 어떤 작용을 하는지 살펴보십시오.
여러분이 어울린다고 생각하는 옵션을 하나 선택하십시오.
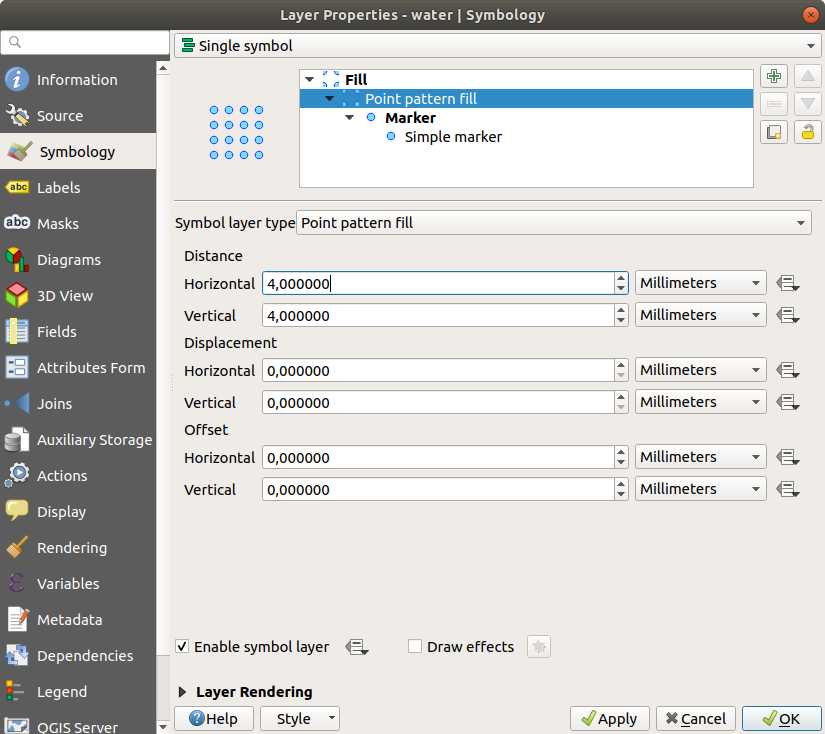
고르기 힘든 경우, Point pattern fill 을 선택하고 다음 옵션을 적용하십시오:
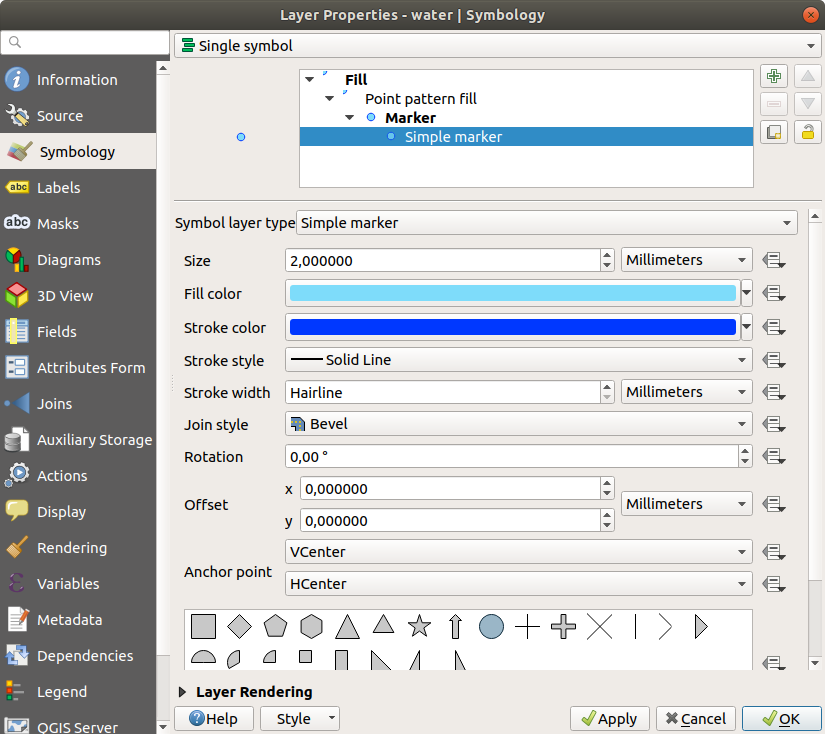
일반적인 Simple fill 을 사용해서 새 심볼 레이어를 추가하십시오.
경계선은 어두운 파란색으로, 채우기는 동일한 밝은 파란색으로 설정하십시오.
Move down 버튼을 사용해서 포인트 패턴 심볼 레이어 아래로 이동시키십시오.
이제 water 레이어에 텍스처 심볼을 적용시켰습니다. 이 방법의 장점은 사용자가 텍스처를 구성하는 개별 점들의 크기, 형태, 거리를 마음대로 설정할 수 있다는 것입니다.
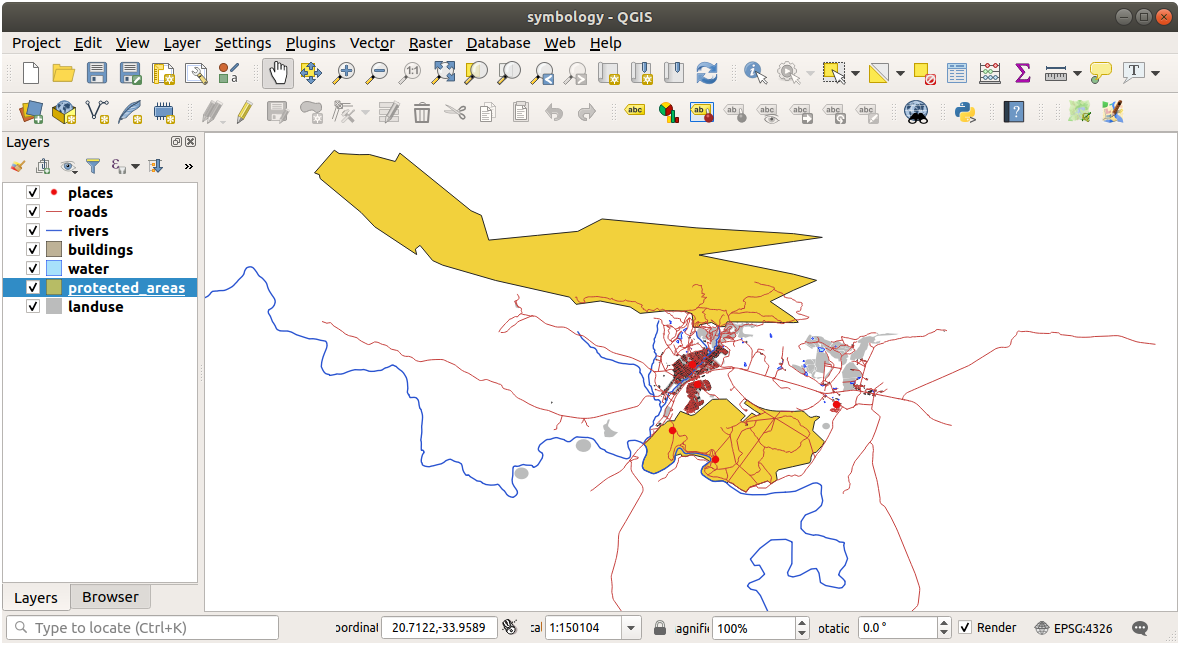
2.4.12. ★★☆ 혼자서 해보세요:
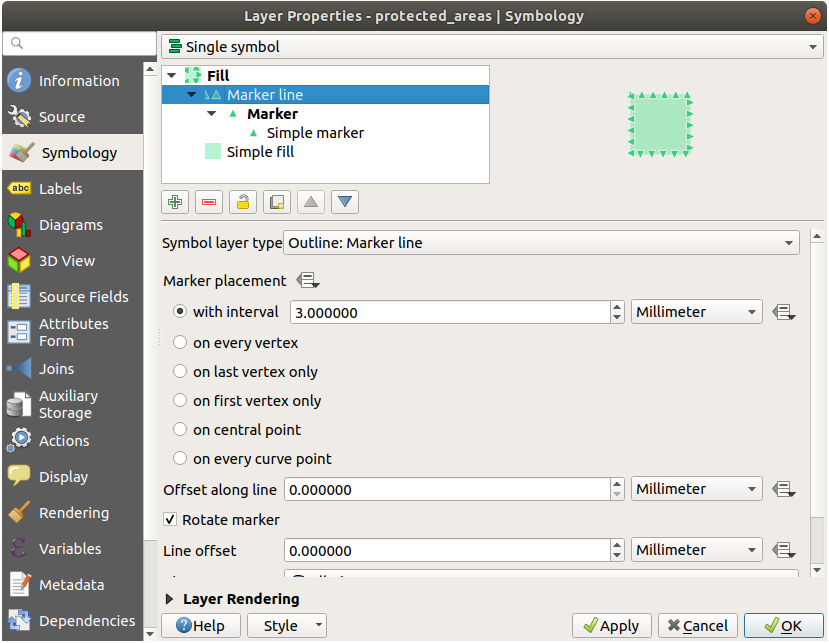
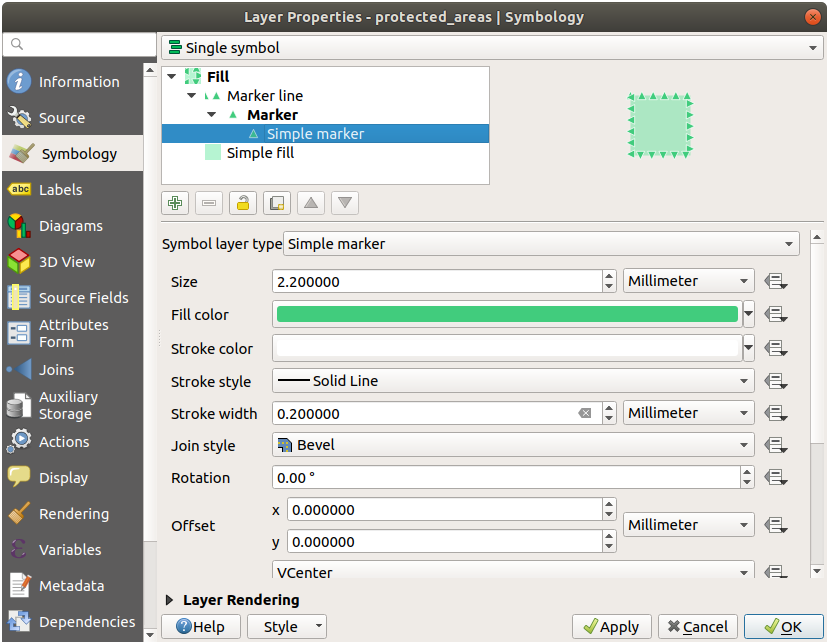
protected_areas 레이어에 투명한 녹색 채우기 색상을 적용시킨 다음, 경계선을 다음처럼 변경하십시오:
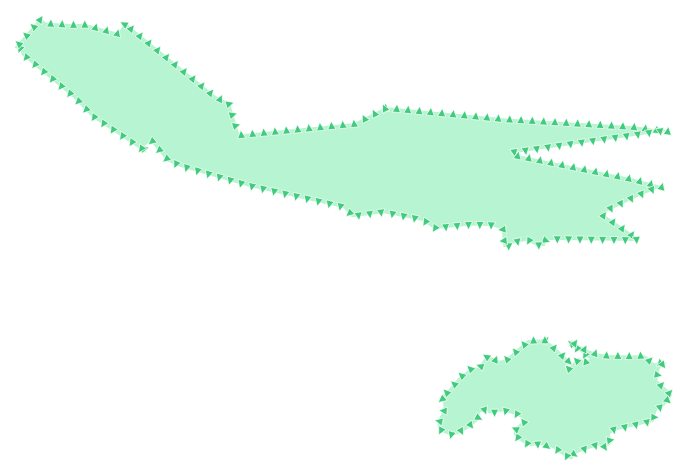
해답
다음은 이 심볼 구조의 예시입니다:
2.4.13. ★★★ 따라해보세요: 도형 생성기 심볼
모든 (포인트, 라인, 폴리곤) 레이어 유형에 도형 생성기(geometry generator) 심볼을 사용할 수 있습니다. 생성되는 심볼은 해당 레이어 유형을 직접적으로 따릅니다.
아주 간단하게 설명하자면, 도형 생성기 심볼은 심볼 자체 내에서 몇몇 공간 연산을 할 수 있게 해줍니다. 예를 들면 폴리곤 레이어 상에서 포인트 레이어를 생성하지 않고서도 실질적인 중심(centroid) 공간 연산을 할 수 있습니다.
게다가 생성되는 심볼의 모양을 변경할 수 있는 스타일 작업 옵션을 모두 사용할 수 있습니다.
한번 해볼까요!
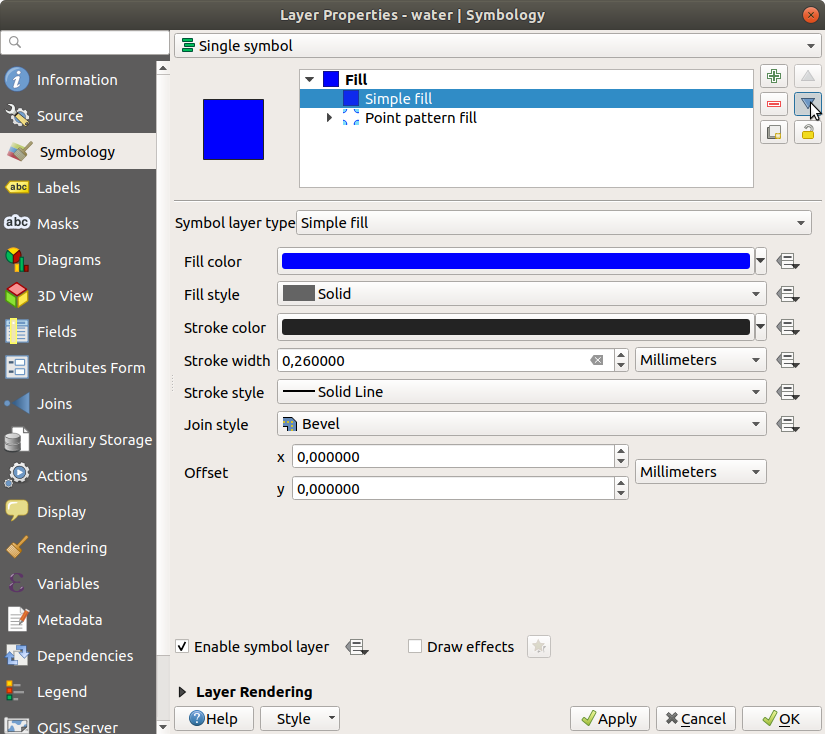
water레이어를 선택하십시오.Simple fill 을 클릭하고 Symbol layer type 을 Geometry generator 로 변경하십시오.
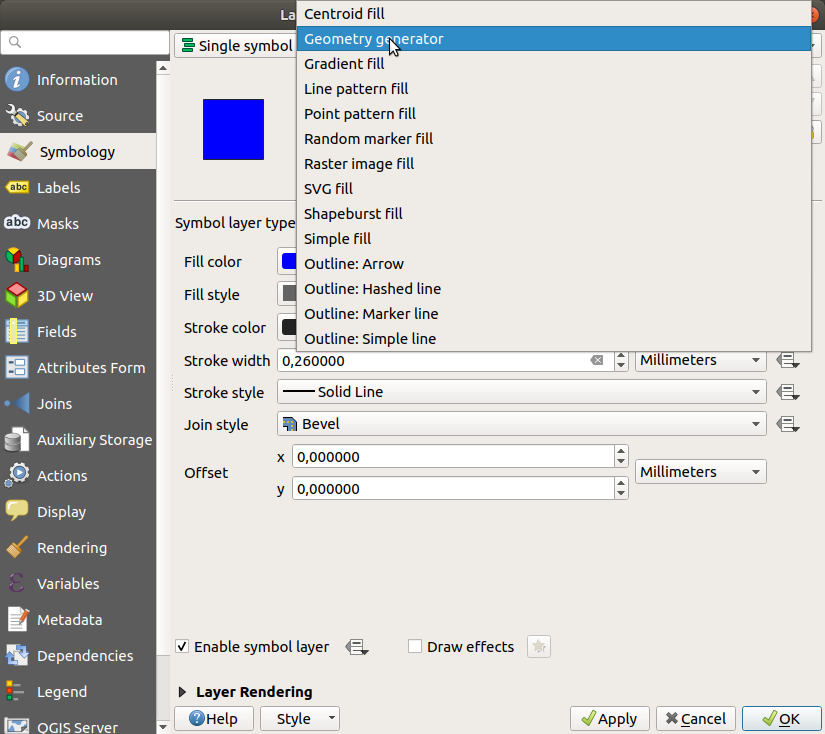
공간 쿼리를 작성하기 전에 산출물의 도형 유형을 선택해야 합니다. 이 예제에서는 각 피처의 중심을 생성할 것이기 때문에, 도형 유형을 Point / Multipoint 로 변경하십시오.
이제 쿼리 패널에 쿼리를 작성해봅시다:
centroid($geometry)
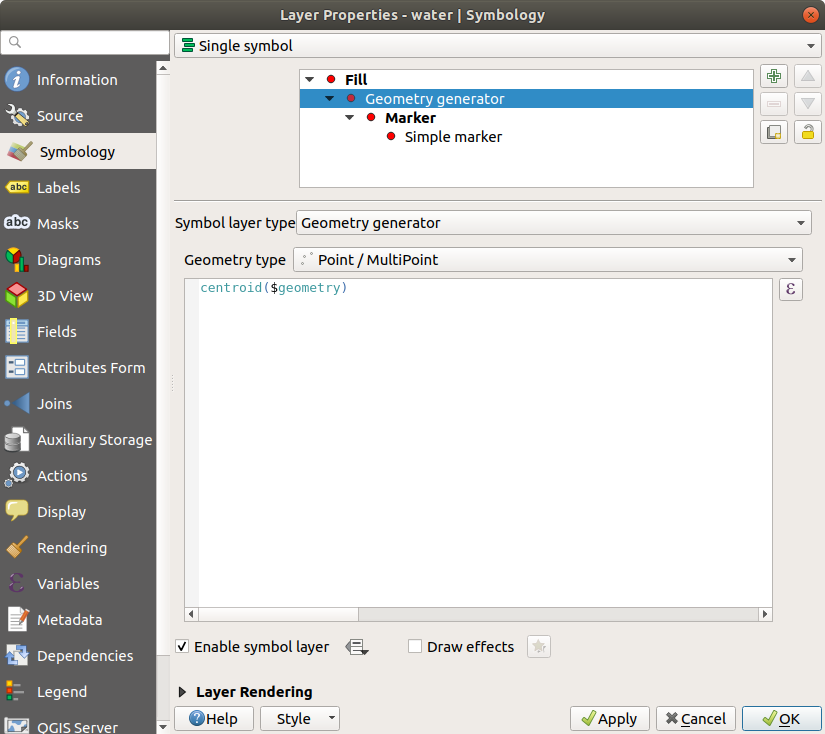
OK 버튼을 클릭하면
water레이어가 포인트 레이어로 렌더링된 것을 보게 될 것입니다! 방금 레이어 심볼 자체 내에서 공간 연산을 한 겁니다. 놀랍지 않나요?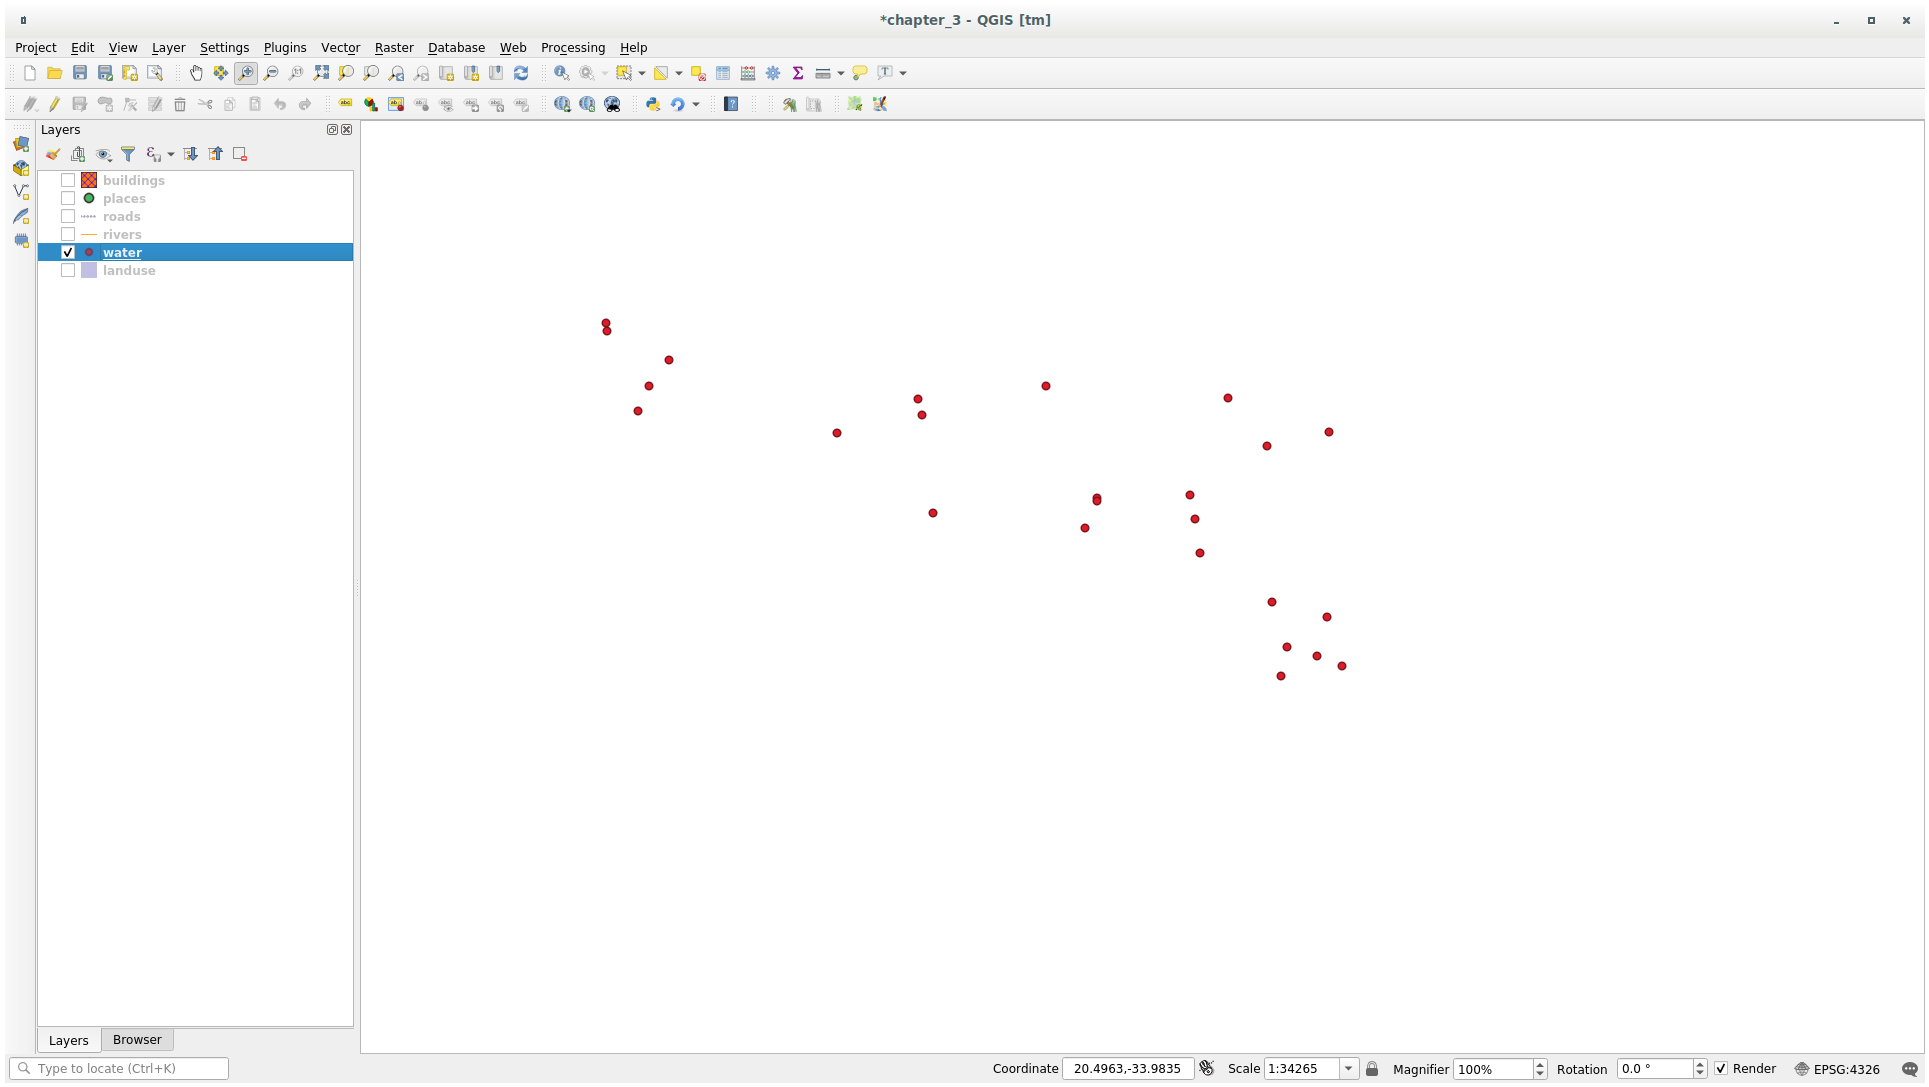
도형 생성기 심볼을 사용하면 일반 심볼의 한계를 성큼 뛰어넘을 수 있습니다.
★★★ 혼자서 해보세요:
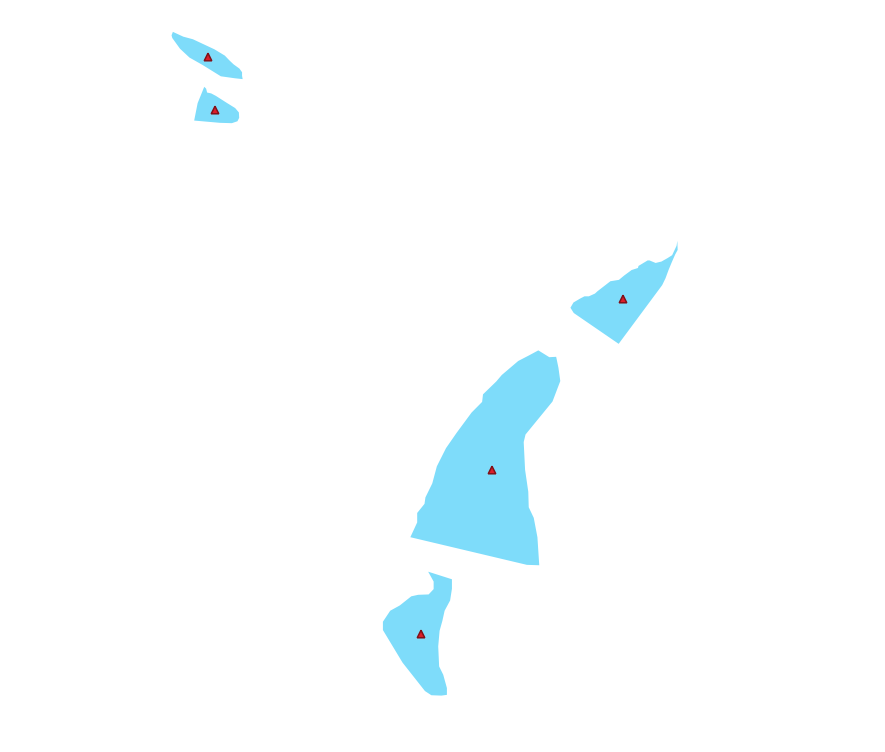
도형 생성기는 또다른 심볼 수준일 뿐입니다. Geometry generator 심볼 아래에 또다른 Simple fill 을 추가해보십시오.
도형 생성기 심볼의 단순 마커 모양도 변경하십시오.
마지막 결과물이 다음과 같이 보여야 합니다:
해답
- 버튼을 클릭해서 또다른 심볼 수준을 추가하십시오.
 버튼을 클릭해서 새 심볼을 목록 맨 아래로 이동시키십시오.
water폴리곤을 채우기 좋은 색상을 선택하십시오.도형 생성기 심볼의 Marker 를 클릭한 다음 원을 마음껏 다른 형태로 변경해보십시오.
더 유용한 결과물을 생성할 수 있도록 다른 옵션들도 시험해보십시오.
2.4.14. ★★★ 따라해보세요: 사용자 정의 SVG 채우기 생성하기
참고
이 예제를 따라해보려면, 무료 벡터 편집 소프트웨어 잉크스케이프 가 설치되어 있어야 합니다.
잉크스케이프 프로그램을 실행하십시오. 다음 인터페이스를 보게 될 것입니다:
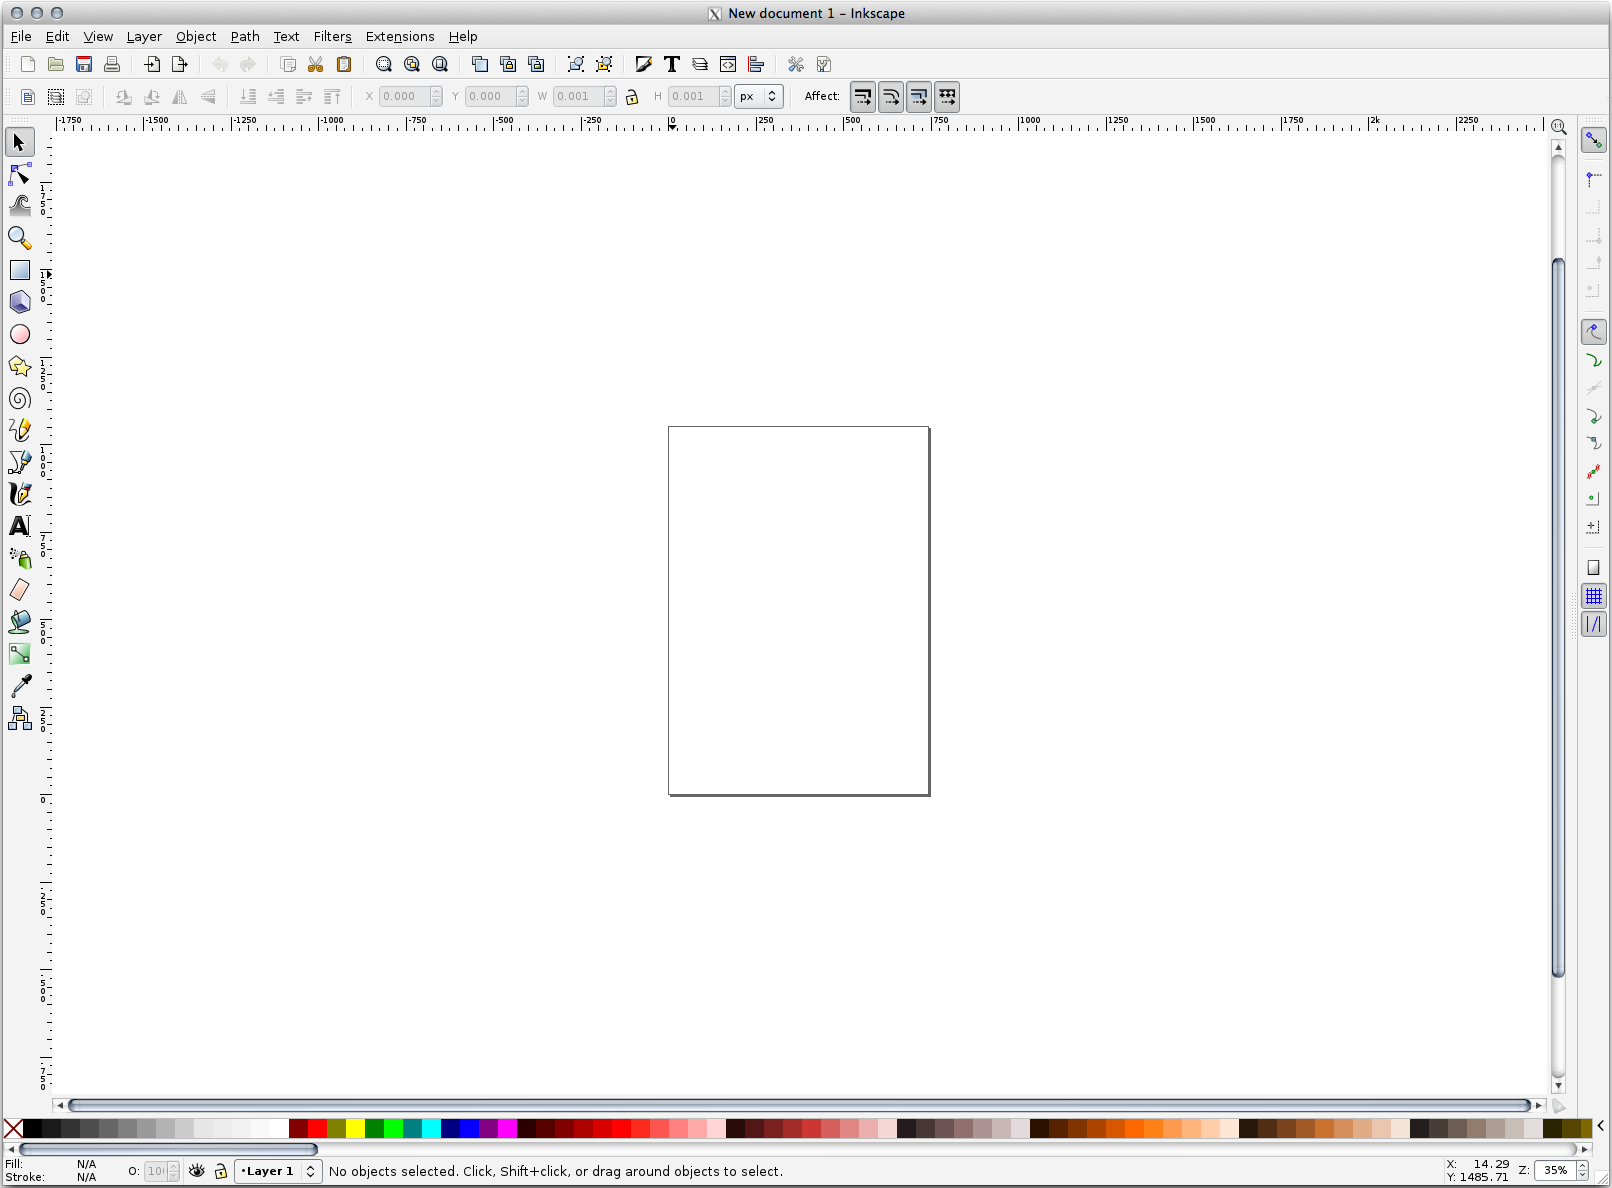
코렐(Corel) 같은 다른 벡터 이미지 편집 프로그램을 사용해본 적이 있다면 이 화면이 익숙할 것입니다.
먼저 작은 텍스처에 적당하도록 캔버스 크기를 변경할 것입니다.
메뉴에서 항목을 클릭하십시오. Document Properties 대화창이 나타날 것입니다.
Units 를 px 로 바꾸십시오.
Width 와 Height 를
100으로 변경하십시오.변경이 끝났으면 대화창을 닫으십시오.
메뉴에서 항목을 클릭해서 여러분이 작업할 페이지를 보십시오.
Circle 도구를 선택한 다음:
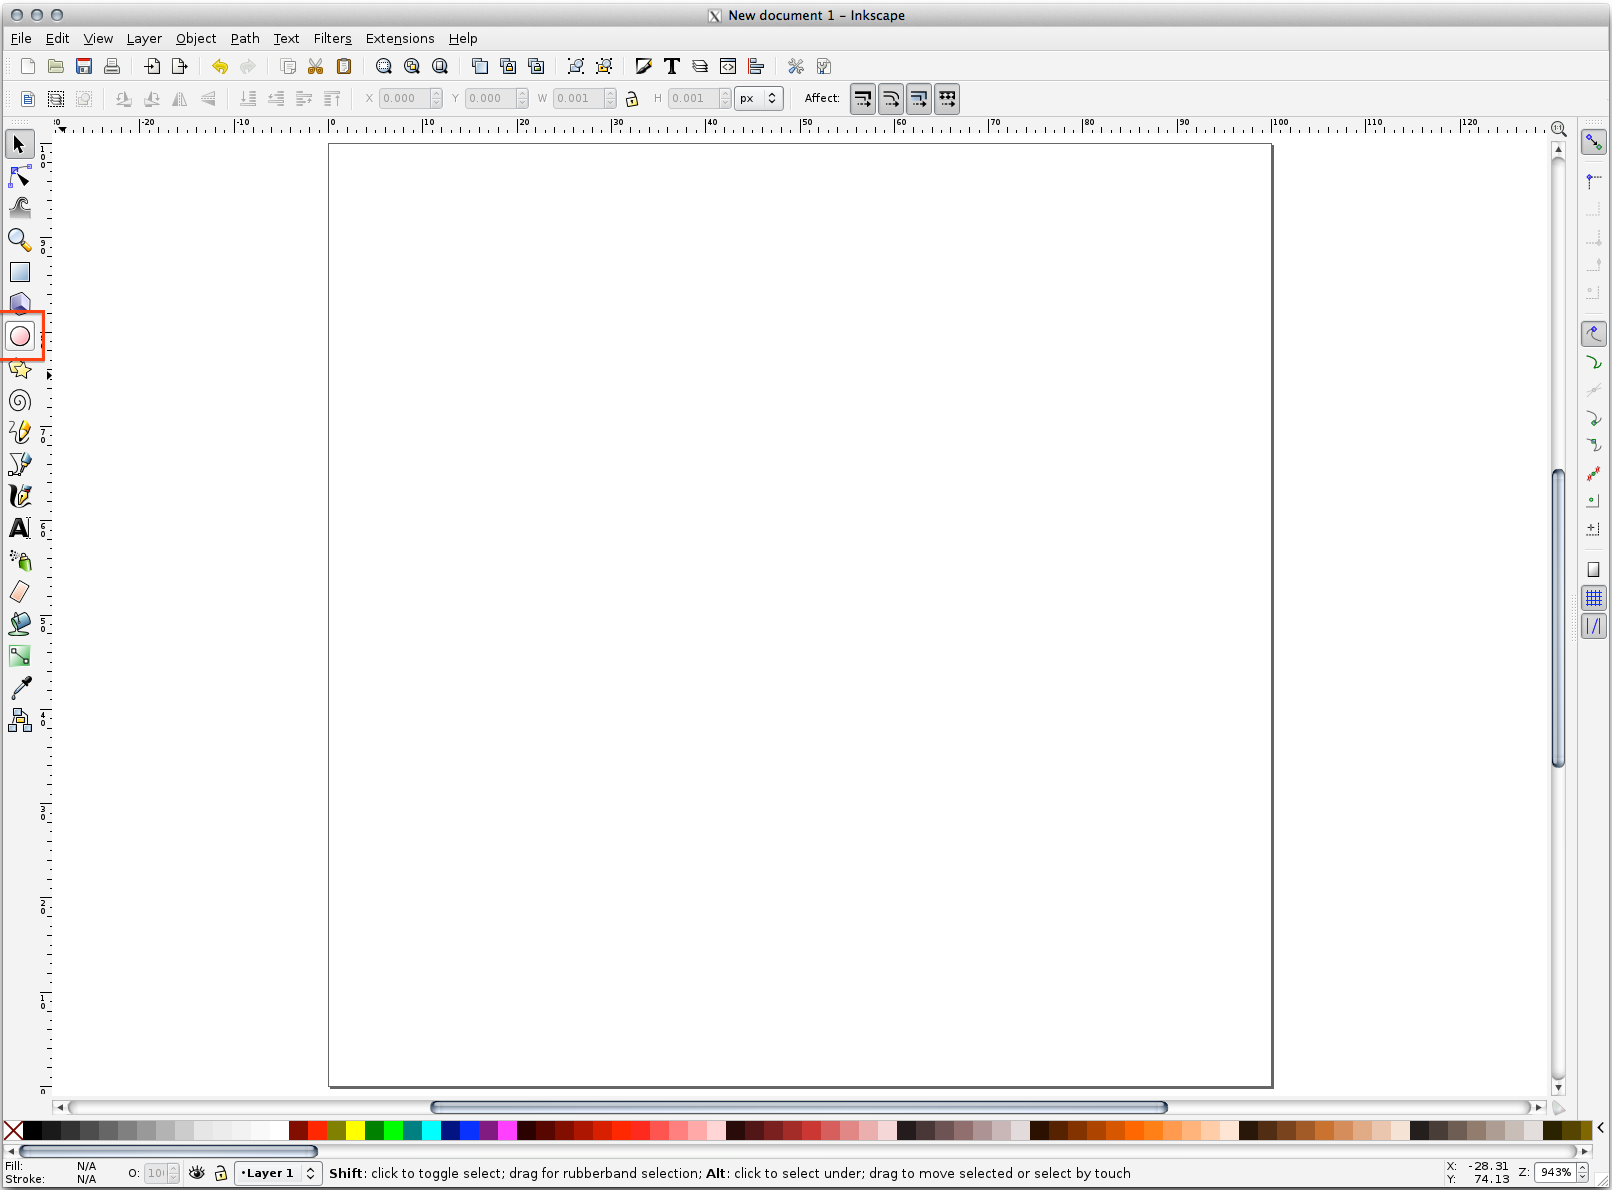
페이지 위에서 클릭&드래그해서 타원을 그리십시오. 원을 그리려면, Ctrl 키를 누른 채 클릭&드래그하십시오.
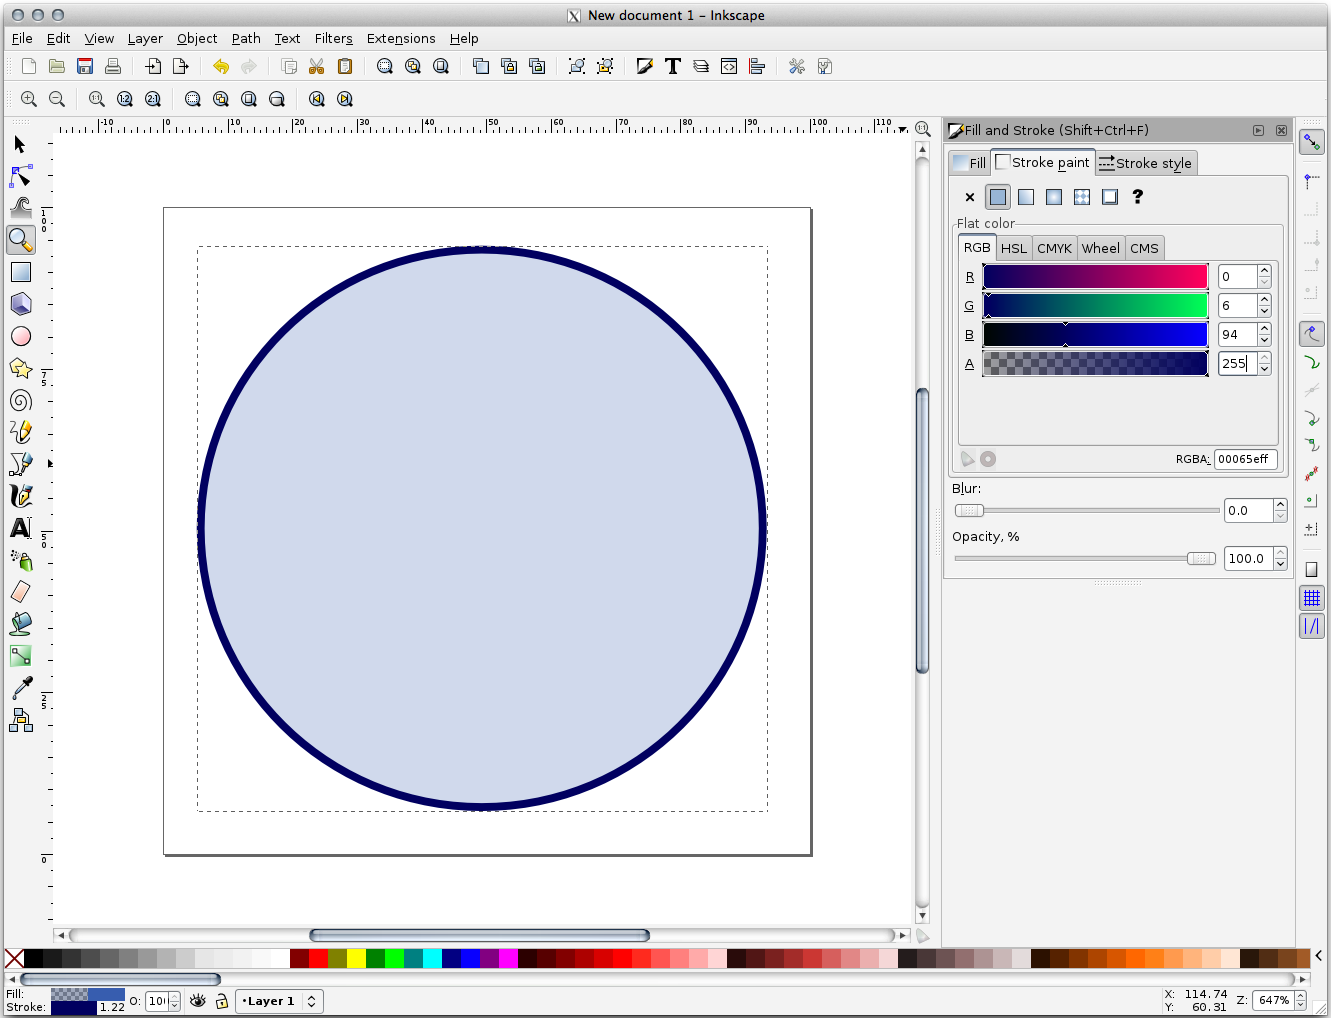
방금 그린 원을 오른쪽 클릭해서 Fill and Stroke 옵션 대화창을 여십시오. 다음과 같이 원의 렌더링을 조정할 수 있습니다:
Fill 색상을 좀더 연한 청회색으로 변경합니다.
Stroke paint 탭에서 경계선 색상을 더 진한 색으로 지정합니다.
마지막으로 Stroke style 탭에서 경계선 두께를 줄입니다.
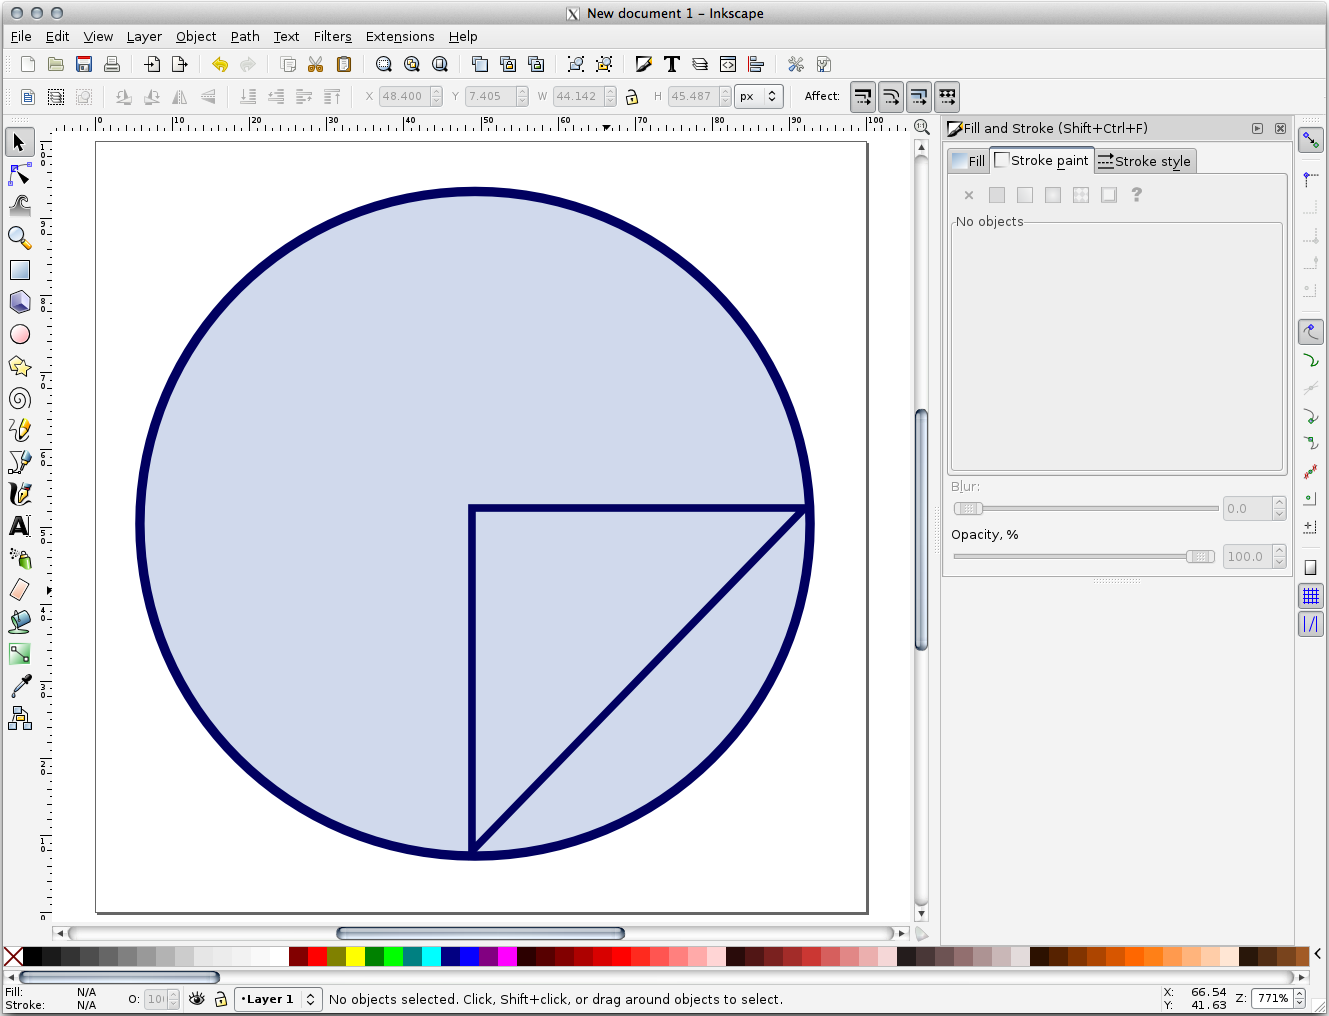
Pencil 도구를 사용해서 라인을 그리십시오:
한 번 클릭하면 라인을 시작합니다. Ctrl 키를 누르고 있으면 15도 단계별로 스냅합니다.
마우스 커서를 수평으로 이동시키고 한 번 클릭으로 포인트를 배치합니다.
라인의 꼭짓점에 클릭해서 스냅시킨 다음 수직으로 라인을 그리고 한 번 클릭으로 끝내십시오.
이제 두 종단 꼭짓점을 연결하십시오.
삼각형 심볼의 색상과 두께를 원의 획과 일치하도록 변경한 다음, 필요한 경우 이리저리 움직여서 다음과 같은 심볼을 생성하십시오:
이 심볼이 마음에 든다면, 물론
exercise_data/symbols아래 있는 디렉터리에 이 심볼을 SVG 파일로 저장하십시오.
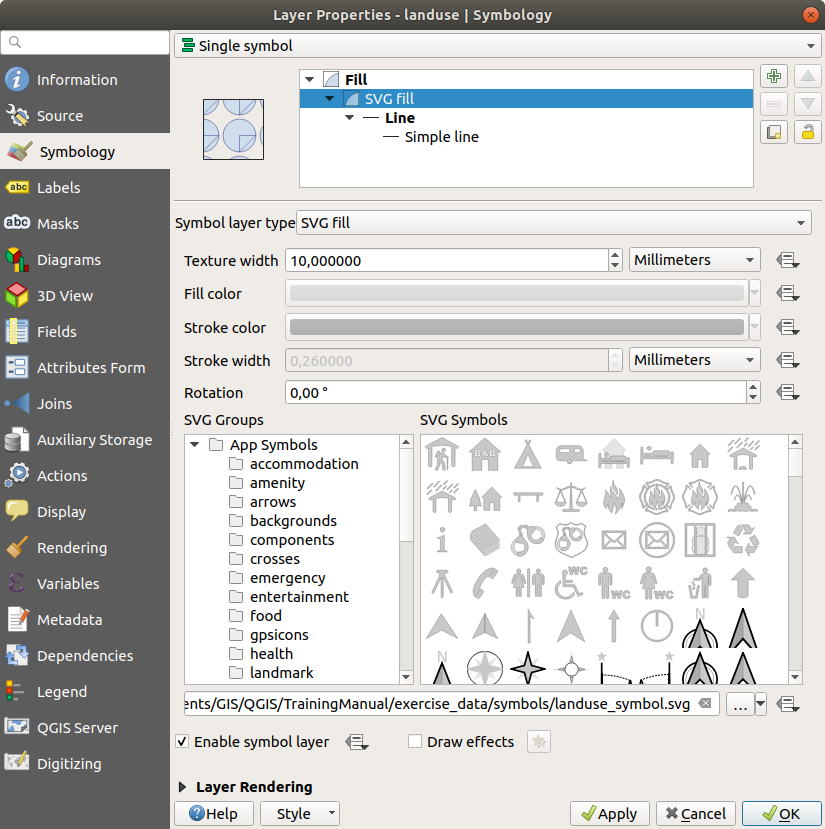
QGIS로 돌아와서:
landuse레이어의 Layer Properties 창을 엽니다.- Symbology 탭에서, Symbol Layer Type 을 다음 그림처럼 SVG Fill 로 바꿔서 심볼 구조를 변경합니다.
… 버튼을 클릭한 다음 Select File… 을 클릭해서 여러분의 SVG 이미지를 선택하십시오.
해당 이미지가 심볼 트리에 추가되어 이제 이미지의 다른 특성들을 (색상, 각도, 효과, 단위 등등을) 사용자 정의할 수 있습니다.
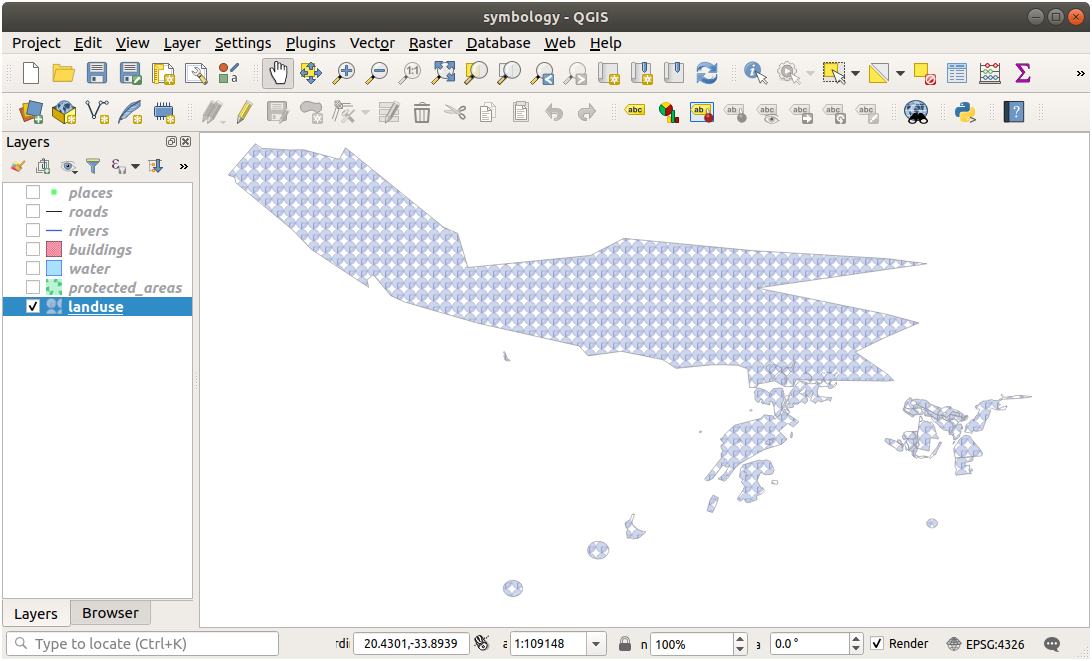
이 대화창의 OK 버튼을 누르면, landuse 레이어에 있는 피처들이 심볼들의 집합으로 덮여서 이제 다음 맵에서 보이는 것과 같은 텍스처를 보일 것입니다. 텍스처가 보이지 않는 경우, 맵 캔버스를 확대하거나 또는 레이어 속성에서 Texture width 를 더 큰 값으로 설정해야 할 수도 있습니다.
2.4.15. ★★☆ Follow Along: Masking
Masking feature allows you to mask some symbol layer using another symbol layer or label.
In the following exercise, we want to configure rendering so that polygon labels will mask the black part of lines layer.
Load the
selective_masking.qgsfrom dataset in directoryexercise_data/masking.Open the Layer Properties window for the
polyslayer.Under the
 Labels tab, you will see that Single Labels have
already been defined.
Labels tab, you will see that Single Labels have
already been defined.From the Labels tab, select the
 Mask (and not Masks in general category list)
Enable label mask by checking the
 Enable mask option
A message tells you that the now defined label mask shape can be later selected as a mask source to mask other symbol layers. Let’s do that.
OK 를 클릭합니다.
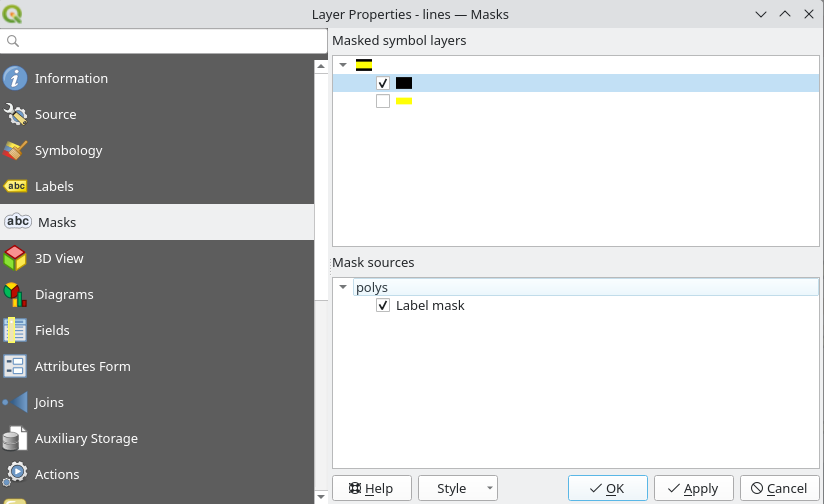
Open the Layer Properties window for the
lineslayer.Go to the
Masks tabClick on the black line part of lines checkbox from masked symbol layers
A message warns you that you have to select both masking and masked symbol layers to be able to save masking configuration. Again, let’s do that.
Click on
polysLabel mask checkboxThe message disappears, you can now safely save your configuration.
OK 를 클릭합니다.
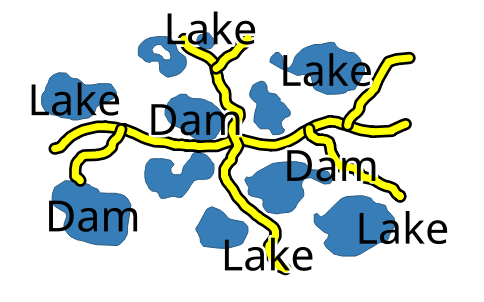
You can see now that labels are masking the black part of lines, leaving only the yellow part.
2.4.16. ★★☆ Follow Along: Masking using points symbols
We want now to mask the black part of lines using only black planes that represent the points layer (i.e. B52 and Jet points categories).
For the sake of visibility, you can switch off polys layer visibility.
Open the Layer Properties window for the
pointslayer.Under the
Symbology tab, you will see that a  Categorized renderer has
been defined with 3 different symbols depending on the
Categorized renderer has
been defined with 3 different symbols depending on the Classfield value.Double click on
B52plane icon, within the Symbol column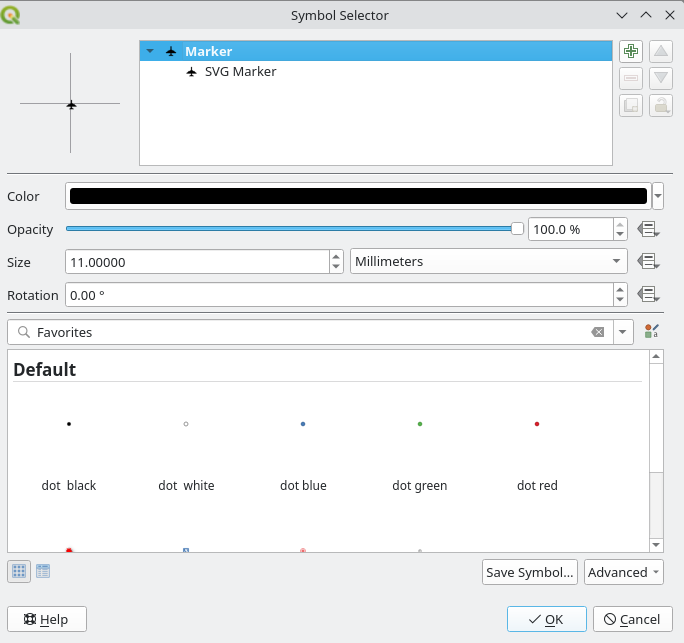
Click the
Add symbol layer button and select the MaskSymbol layer typeA new hierarchy
Mask(symbol layer) >Marker(symbol) >Simple Marker(symbol layer) appear below the root symbolMarker.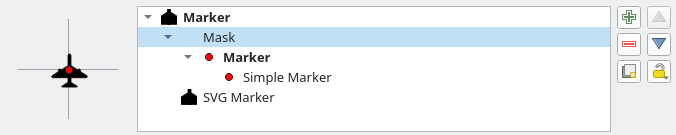
Now, let’s define a mask that is identical to our plane marker but a little bit bigger.
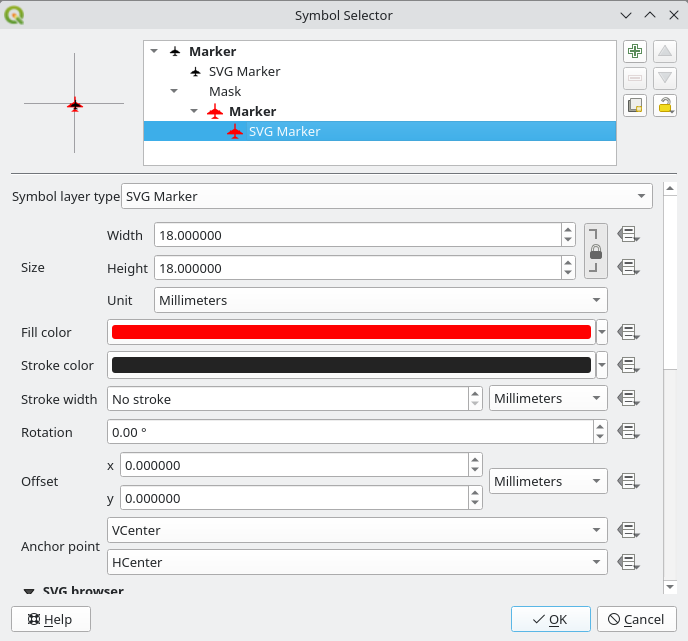
Select the newly created
Simple Markersymbol layer and change its Symbol layer type toSVG markerSet the SVG file path to be the same as the already existing SVG marker, and the size to be bigger (24 millimeters is a pretty good choice for this use case).
Mask color doesn’t matter here, only the shape is used in masking. Symbol layer order is also irrelevant in that situation.
You should get something like that:
Repeat the same operations on
Jetsymbol.OK 를 클릭합니다.
Open the Layer Properties window for the
lineslayer.Go to the
Masks tab.The black line part of lines checkbox from masked symbol layers is already checked from our previous configuration.
Uncheck the Label mask
polyscheckbox and check bothB52andJetMask symbol layerOK 를 클릭합니다.
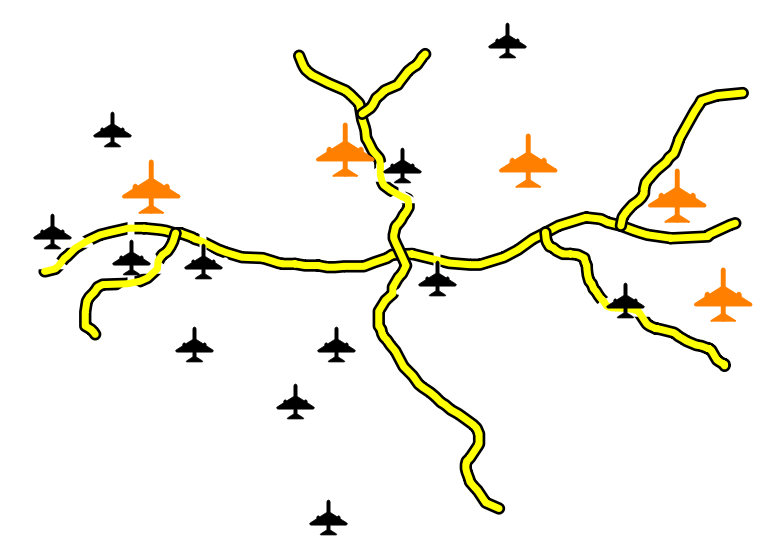
You now see that black planes are masking the black part of lines, with only the yellow part visible.
2.4.17. 결론
서로 다른 레이어들에 대한 심볼을 변경하는 작업이 한 무리의 벡터 파일들을 판독 가능한 맵으로 변환시켰습니다. 여러분이 작업에 익숙해진 것은 물론, 보기 좋은 맵이 되기까지 했군요!
2.4.18. 더 읽어볼 거리
2.4.19. 다음은 무엇을 배우게 될까요?
전체 레이어의 심볼을 변경하는 작업은 유용하지만, 이 맵을 읽는 사람이 각 레이어 안에 담긴 정보에 접근할 수는 없습니다. 거리 이름은 무엇인가? 특정 지역이 속한 행정 구역은 어디인가? 이 농장의 상대표면적은 얼마나 되나? 이 모든 정보가 아직 숨겨져 있습니다. 다음 강의에서는 여러분이 만든 맵에 이런 데이터를 어떻게 표현하는지 설명할 것입니다.
참고
지금 여러분의 맵을 저장해야 한다는 건 잊지 않으셨죠?