Ważne
Tłumaczenie jest wysiłkiem społeczności QGISa przyłącz się. Ta strona jest obecnie przetłumaczona w 32.14%.
5.1. Lekcja: Tworzenie nowego zestawu danych wektorowych
Dane używane w Twoim projekcie muszą skądś pochodzić. W większości przypadków będziesz korzystać z już gotowych danych, ale im bardziej szczegółowy i wyspecjalizowany projekt, tym większa szansa, że takie dane nie będą publicznie dostępne. W takich przypadkach należy utworzyć je samodzielnie.
Cel lekcji: Utworzenie nowego zestawu danych wektorowych.
5.1.1. ★☆☆ Podążaj za instrukcjami: Okno tworzenia warstwy
Zanim dodasz nowe dane wektorowe, musisz zdefiniować, do jakiego zestawu danych je zapisać. W naszym przypadku utworzymy zupełnie nowy zestaw danych, zamiast korzystać z już istniejącego. Dlatego też musimy najpierw zdefiniować zestaw danych.
Otwórz QGIS i stwórz nowy, pusty projekt.
Z górnego paska wybierz opcję . Pojawi się okienko Nowa warstwa Shapefile, za pomocą którego utworzymy nową warstwę.
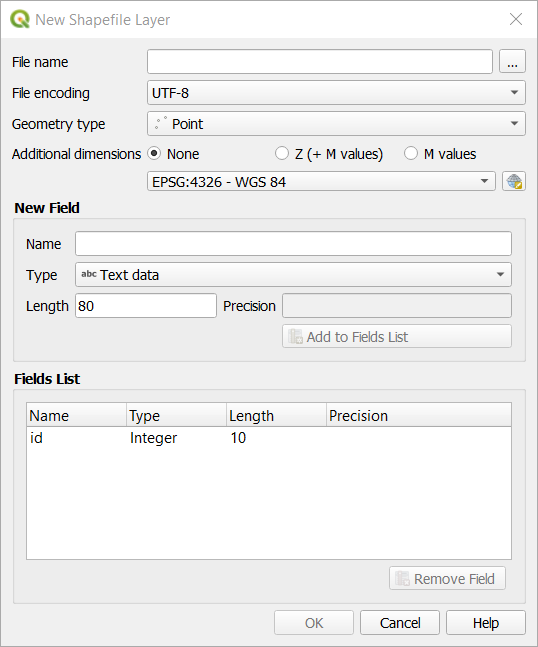
Naciśnij … obok pola Nazwa pliku. Pojawi się okno zapisywania.
Odnajdź folder
exercise_data.Zapisz swoją nową warstwę pod nazwą
school_property.shp.Ważne jest, żeby już na tym etapie zdecydować się, jaki rodzaj danych zapiszemy. Każdy rodzaj danych wektorowych tworzony jest w inny sposób, więc nie można go zmienić po utworzeniu warstwy.
W następnym ćwiczeniu utworzymy obiekty opisujące powierzchnię. W takim przypadku należy utworzyć warstwę zawierającą poligony.
W polu Typ geometrii wybierz opcję Poligon z rozwijalnej listy:

Wybór ten nie wpływa na resztę okienka tworzenia nowej warstwy, ale dzięki temu prawidłowy rodzaj geometrii zostanie użyty do stworzenia zestawu danych.
Następne pole pozwala na wybranie układu współrzędnych warstwy. Układ współrzędnych odpowiada za dopasowywanie numerycznych współrzędnych do punktów leżących na powierzchni ziemi. Więcej informacji o układach współrzędnych dostępnych jest tutaj: Working with Projections.
W tym przykładzie użyjemy domyślnego układu współrzędnych powiązanego z tym projektem, czyli WGS84.

Następnie mamy cały zestaw opcji zgrupowanych w polu Nowe pole. Domyślnie, nowa warstwa posiada tylko jeden atrybut
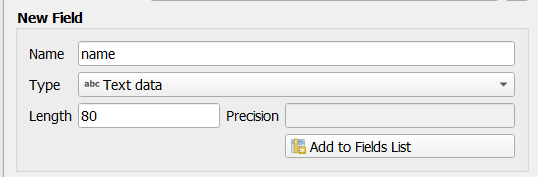
id(który powinien być widoczny w okienku Lista pól znajdującym się poniżej). Żeby jednak tworzone przez nas dane były przydatne, powinniśmy zawrzeć również w nich informacje o tworzonych przez nas obiektach. Dla naszych potrzeb wystarczy w tym momencie dodanie jednego pola nazwanegonazwa, zawierającego rodzaj danych Tekst (string) z długością ustawioną na80znaków.Skopiuj pokazane poniżej kroki (z opcjonalną zmianą nazwy pola na polski) i naciśnij Dodaj do listy pól:
Twoje okienko powinno teraz wyglądać tak:
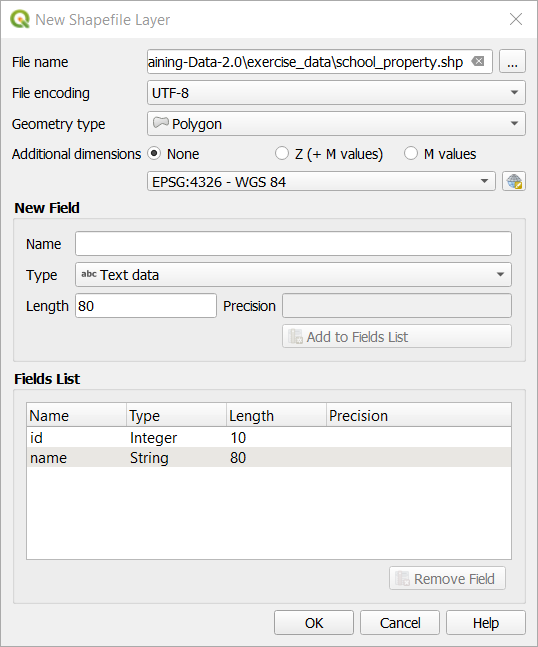
Kliknij OK
Nowa warstwa powinna pokazać się w panelu Warstwy.
5.1.2. ★☆☆: Podążaj za instrukcjami: Źródła danych
Kiedy tworzysz nowe dane, muszą one rzecz jasna odnosić się do istniejących rzeczy. Musimy więc znaleźć gdzieś informacje źródłowe.
There are many different ways to obtain data about objects. For example, you could use a GPS to capture points in the real world, then import the data into QGIS afterwards. Or you could survey points using a theodolite, and enter the coordinates manually to create new features. Or you could use the digitizing process to trace objects from remote sensing data, such as satellite imagery or aerial photography.
For our example, you’ll be using the digitizing approach. Sample raster datasets are provided, so you’ll need to import them as necessary.
Click on
 Data Source Manager button.
Select
 Raster on the left side.
In the Source panel, click on the … button:
Navigate to
exercise_data/raster/.Select the file
3420C_2010_327_RGB_LATLNG.tif.Click Open to close the dialogue window.
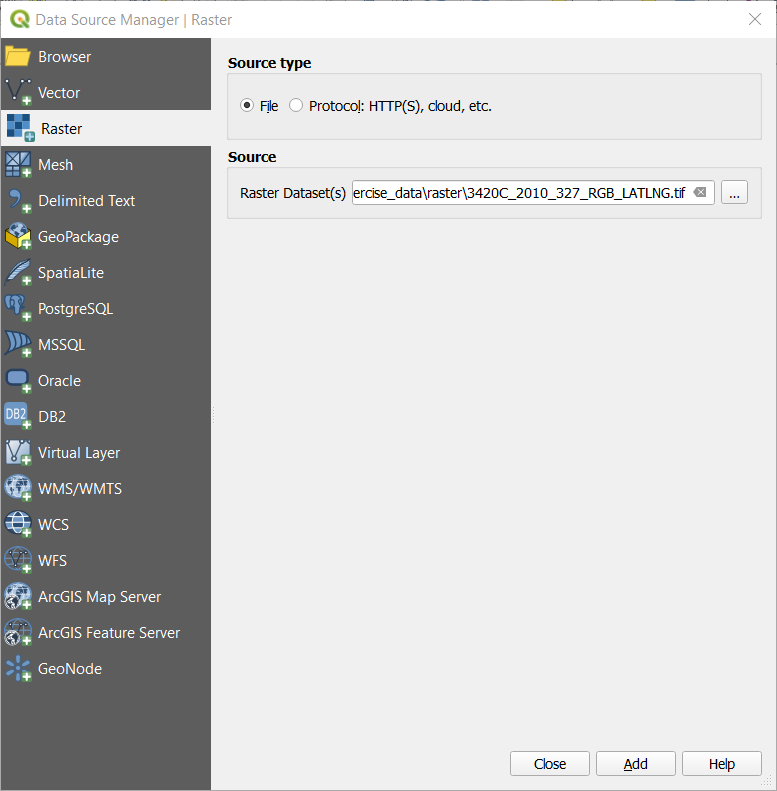
Click Add and Close. An image will load into your map.
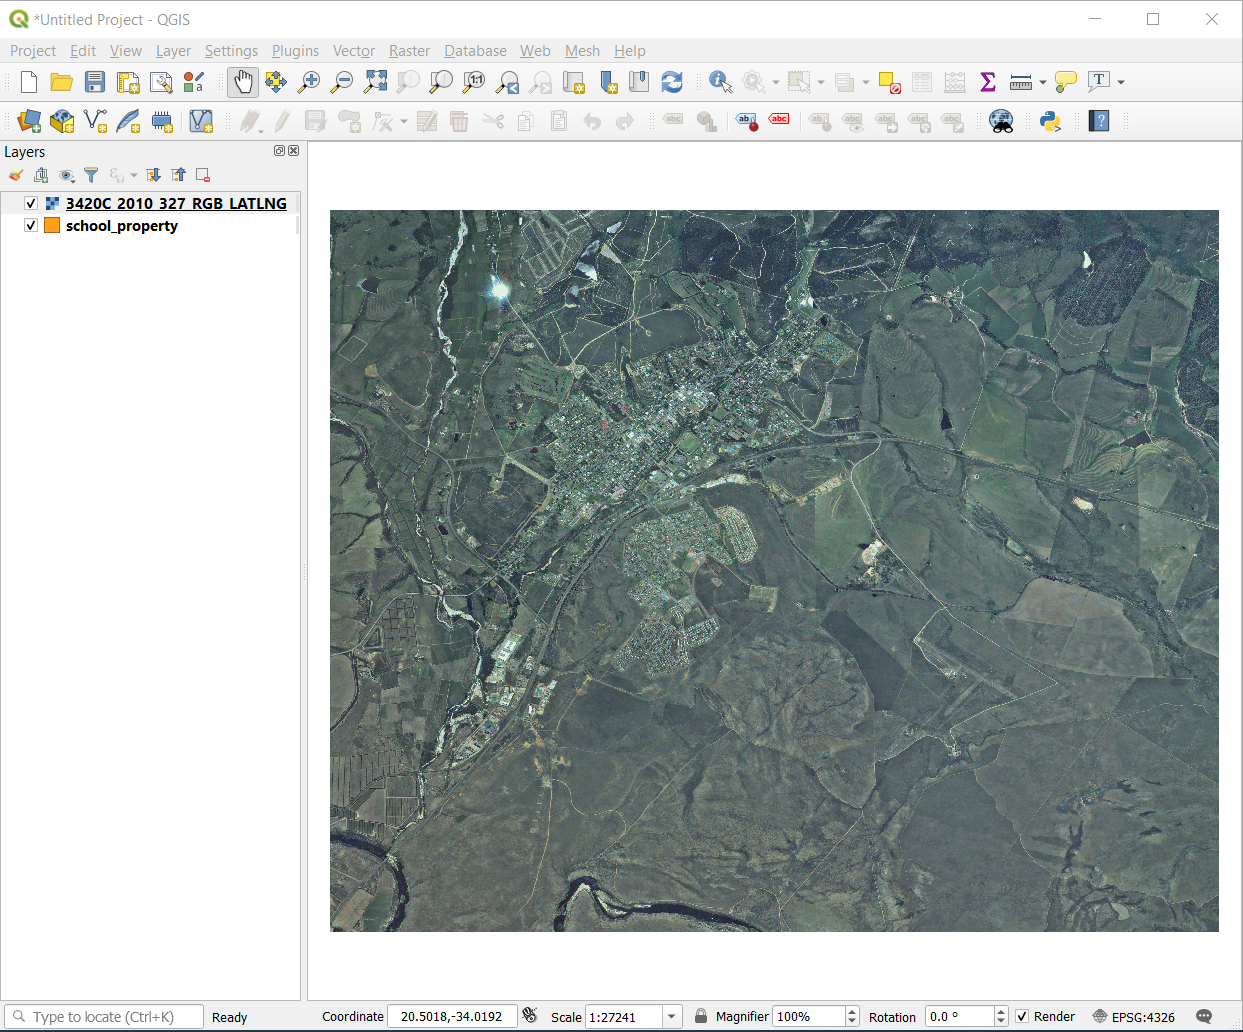
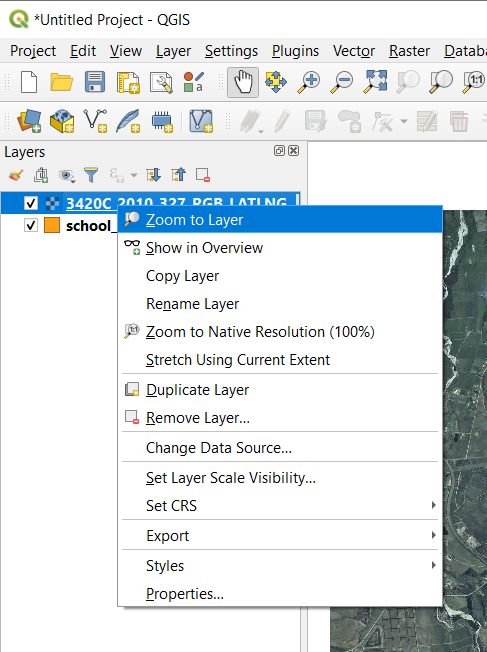
If you don’t see an aerial image appear, select the new layer, right click, and choose Zoom to Layer in the context menu.
Click on the
 Zoom In button, and zoom to the area highlighted in blue below: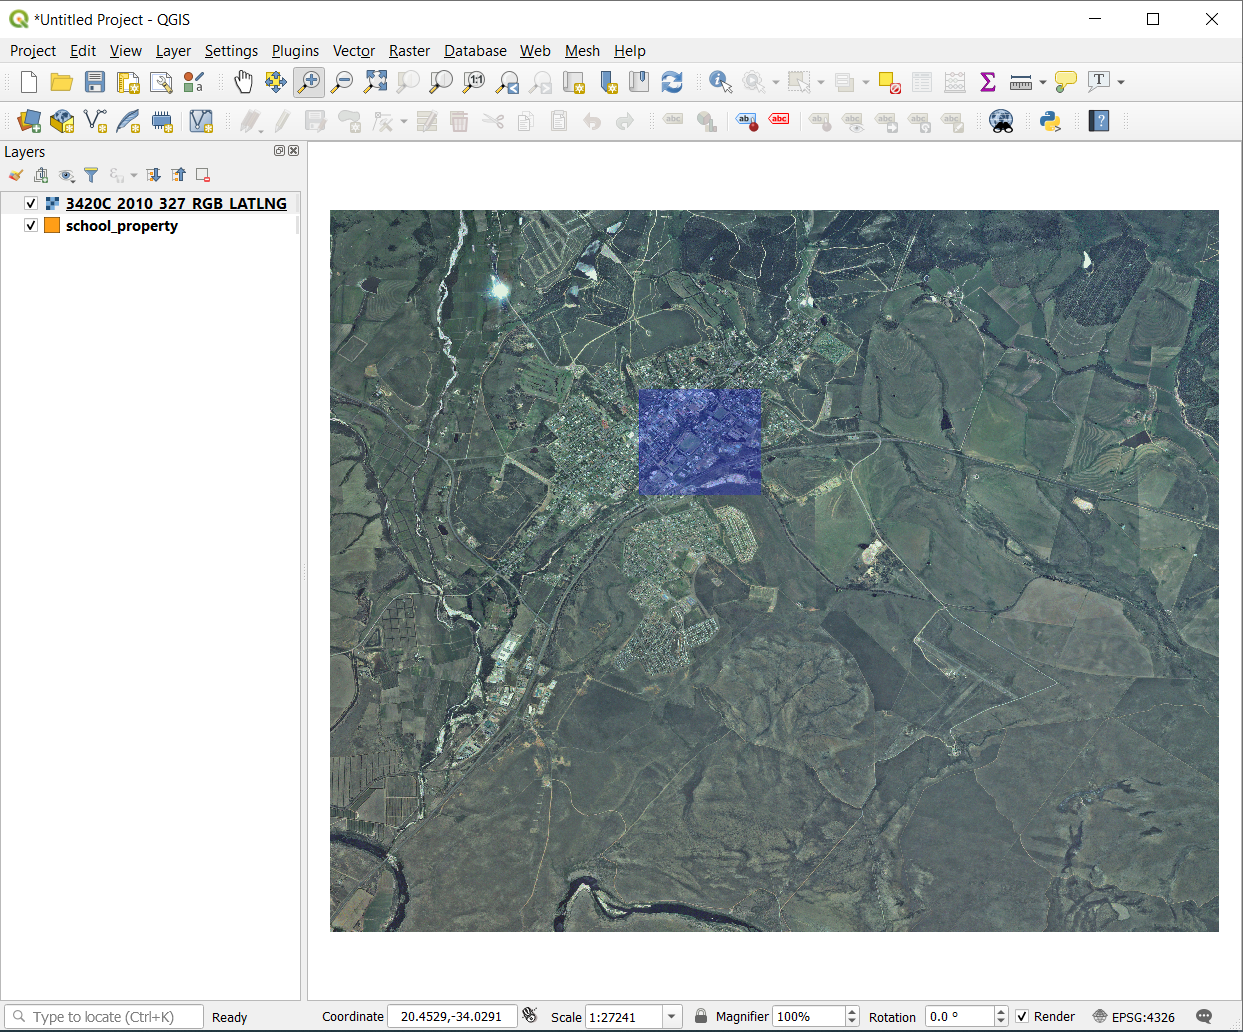
Now you are ready to digitize these three fields:
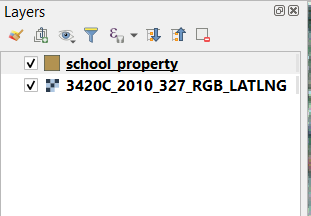
Before starting to digitize, let’s move the school_property layer above the aerial image.
Select
school_propertylayer in the Layers pane and drag it to the top.
In order to begin digitizing, you’ll need to enter edit mode. GIS software commonly requires this to prevent you from accidentally editing or deleting important data. Edit mode is switched on or off individually for each layer.
To enter edit mode for the school_property layer:
Click on the
school_propertylayer in the Layers panel to select it.Click on the
 Toggle Editing button.
If you can’t find this button, check that the Digitizing toolbar is enabled. There should be a check mark next to the menu entry.
As soon as you are in edit mode, you’ll see that some digitizing tools have become active:
 Capture Polygon
 Vertex Tool
Other relevant buttons are still inactive, but will become active when we start interacting with our new data.
Notice that the layer
school_propertyin the Layers panel now has the pencil icon, indicating that it is in edit mode.Click on the
Capture Polygon button to begin digitizing
our school fields.You’ll notice that your mouse cursor has become a crosshair. This allows you to more accurately place the points you’ll be digitizing. Remember that even when you’re using the digitizing tool, you can zoom in and out on your map by rolling the mouse wheel, and you can pan around by holding down the mouse wheel and dragging around in the map.
The first feature you’ll be digitizing is the athletics field:
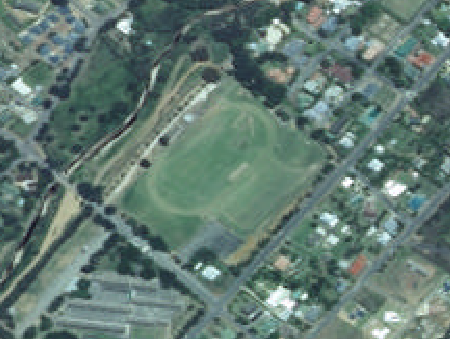
Start digitizing by clicking on a point somewhere along the edge of the field.
Place more points by clicking further along the edge, until the shape you’re drawing completely covers the field.
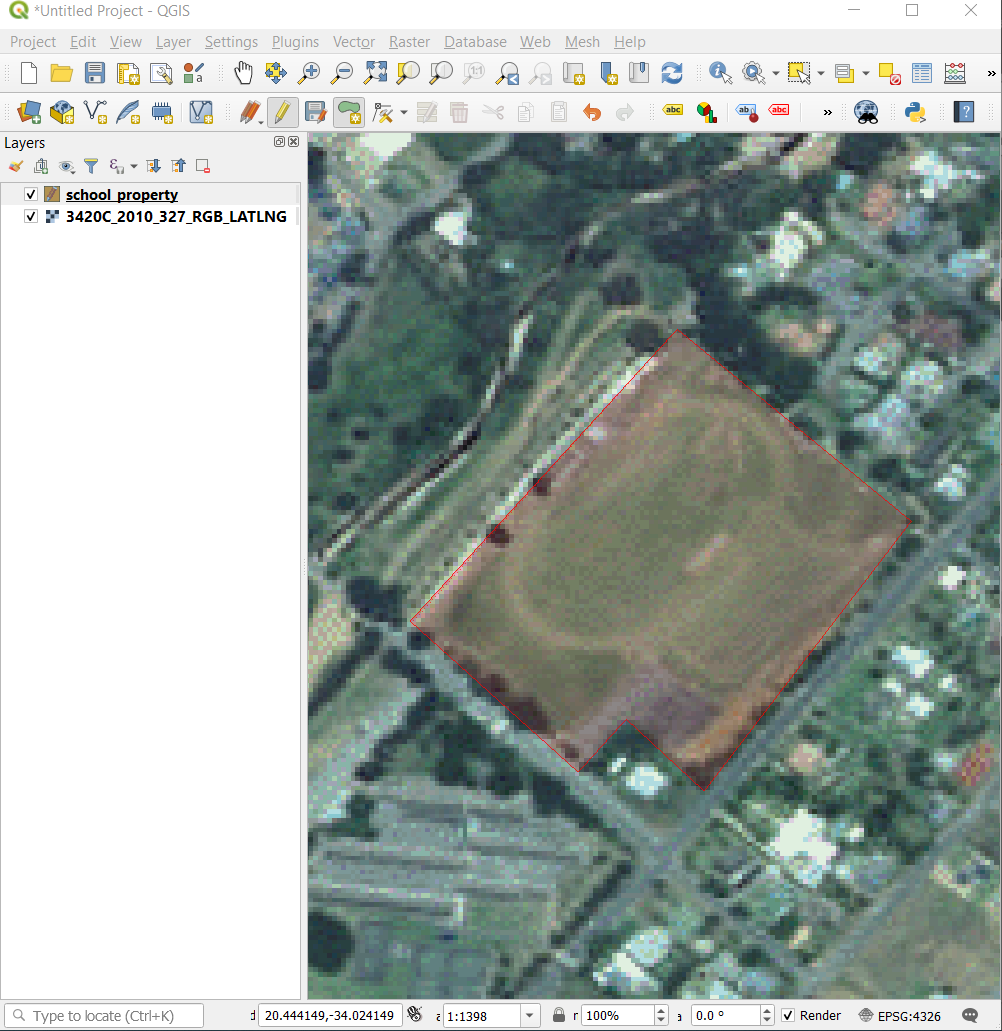
After placing your last point, right click to finish drawing the polygon. This will finalize the feature and show you the Attributes dialog.
Fill in the values as below:
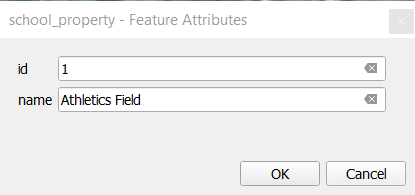
Click OK, and you have created a new feature!
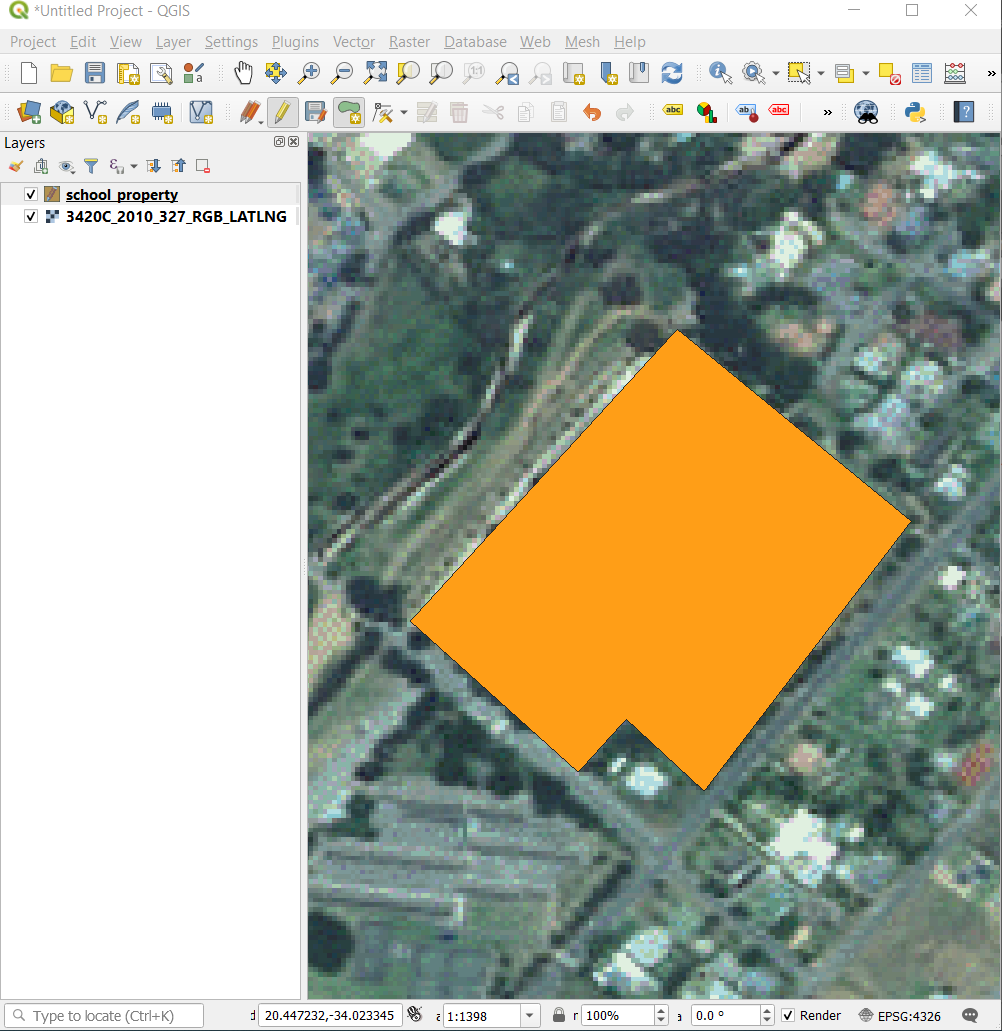
In the Layers panel select the
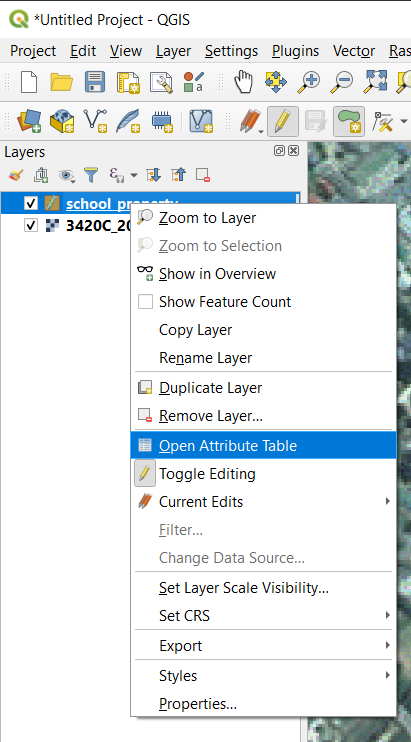
school_propertylayer.Right click and choose Open Attribute Table in the context menu.
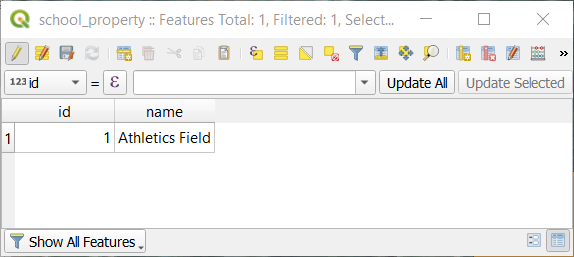
In the table you will see the feature you just added. While in edit mode you can update the attributes data by double click on the cell you want to update.
Close the attribute table.
To save the new feature we just created, click on
 Save Edits button.
Remember, if you’ve made a mistake while digitizing a feature, you can always edit it after you’re done creating it. If you’ve made a mistake, continue digitizing until you’re done creating the feature as above. Then:
Click on
Vertex Tool button.Hover the mouse over a vertex you want to move and left click on the vertex.
Move the mouse to the correct location of the vertex, and left click. This will move the vertex to the new location.
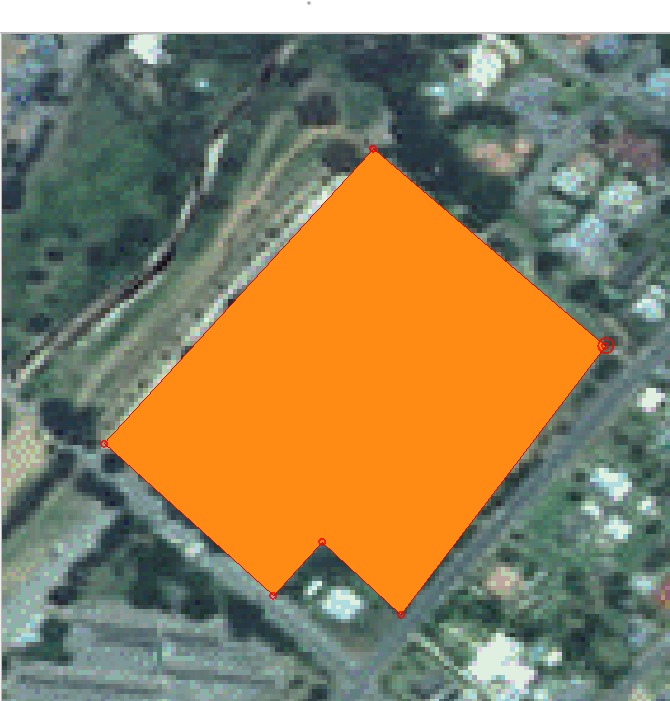
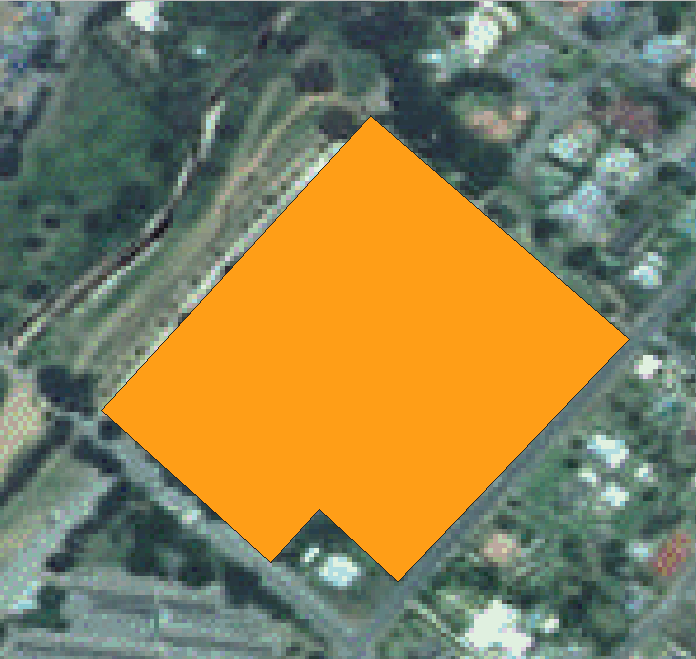
The same procedure can be used to move a line segment, but you will need to hover over the midpoint of the line segment.
If you want to undo a change, you can press the
 Undo button or Ctrl+Z.
Remember to save your changes by clicking the
Save Edits button.When done editing, click the
Toggle Editing button
to get out of edit mode.
5.1.3. ★☆☆ Try Yourself: Digitizing Polygons
Digitize the school itself and the upper field. Use this image to assist you:
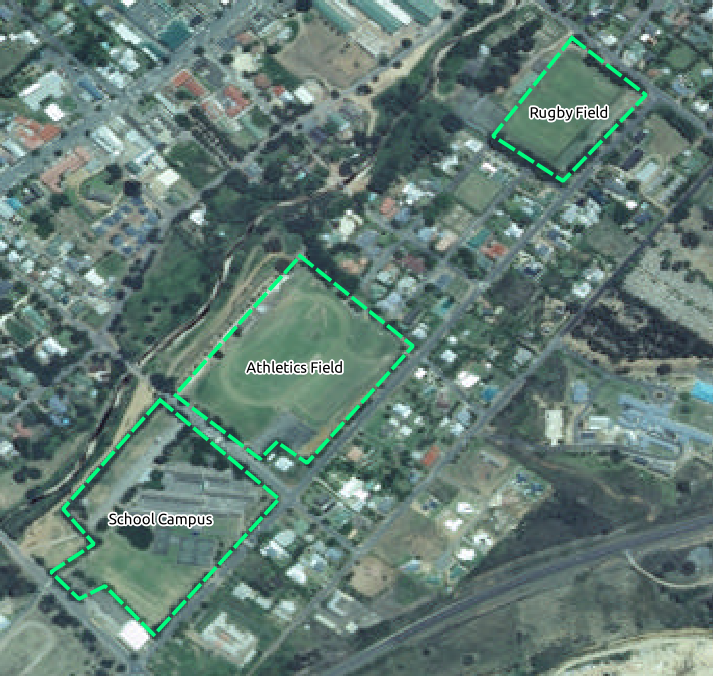
Remember that each new feature needs to have a unique id value!
Informacja
When you’re done adding features to a layer, remember to save your edits and then exit edit mode.
Informacja
You can style the fill, outline and label placement and formatting
of the school_property using techniques learnt in earlier
lessons.
5.1.4. ★★☆ Follow Along: Using Vertex Editor Table
Another way to edit a feature is to manually enter the actual coordinate values for each vertex using the Vertex Editor table.
Make sure you are in edit mode on layer
school_property.If not already activated, click on
Vertex Tool button.Move the mouse over one of the polygon features you created in the
school_propertylayer and right click on it. This will select the feature and a Vertex Editor pane will appear.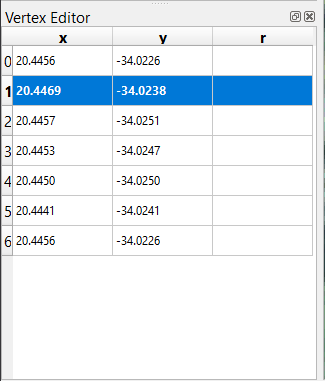
Informacja
This table contains the coordinates for the vertices of the feature. Notice there are seven vertices for this feature, but only six are visually identified in the map area. Upon closer inspection, one will notice that row 0 and 6 have identical coordinates. These are the start and end vertices of the feature geometry, and are required in order to create a closed polygon feature.
Click and drag a box over a vertex, or multiple vertices, of the selected feature.
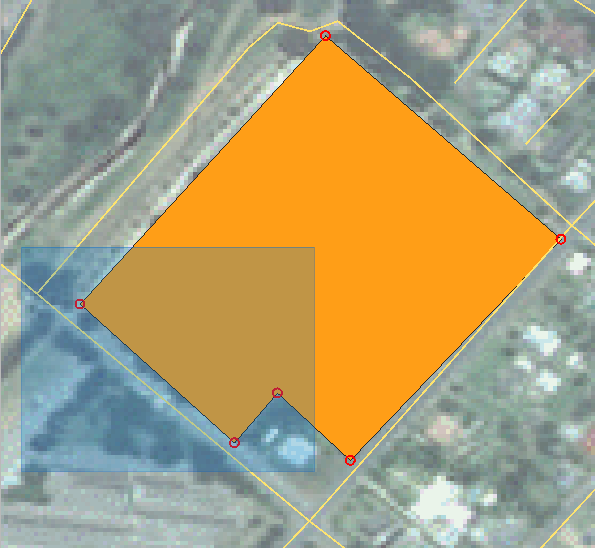
The selected vertices will change to a color blue and the Vertex Editor table will have the corresponding rows highlighted, which contain the coordinates of the vertices.
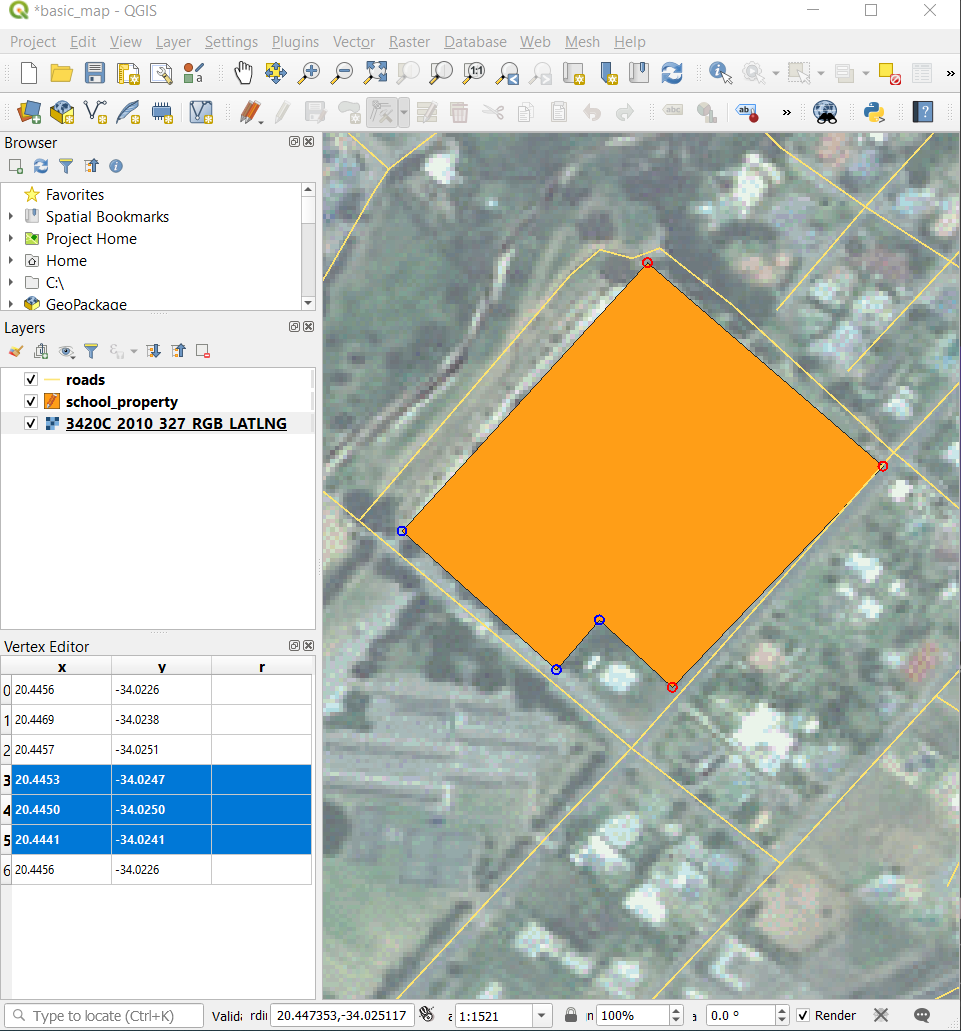
To update a coordinate, double left click on the cell in the table that you want to edit and enter the updated value. In this example, the x coordinate of row
4is updated from20.4450to20.4444.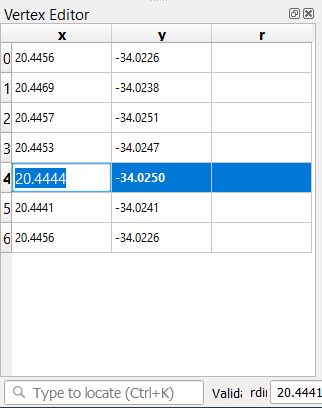
After entering the updated value, hit the enter key to apply the change. You will see the vertex move to the new location in the map window.
When done editing, click the
Toggle Editing
button to get out of edit mode, and save your edits.
5.1.5. ★☆☆ Try Yourself: Digitizing Lines
We are going to digitize two routes which are not already marked on the roads layer; one is a path, the other is a track. Our path runs along the southern edge of the suburb of Railton, starting and ending at marked roads:
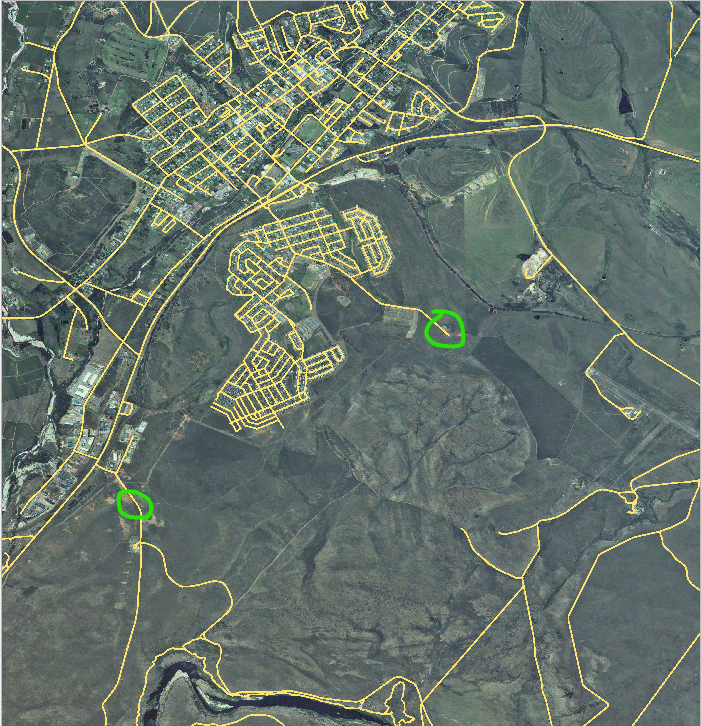
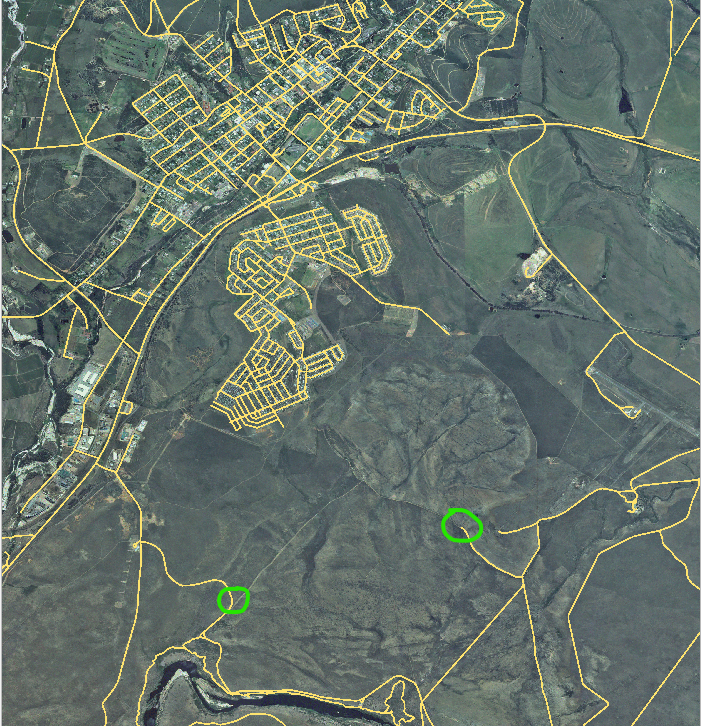
Our track is a little further to the south:
If the roads layer is not yet in your map, then add the
roadslayer from the GeoPackage filetraining-data.gpkgincluded in theexercise_datafolder of the training data you downloaded. You can read ★☆☆ Podążaj za instrukcjami: Ładowanie warstwy wektorowej z bazy danych GeoPackage for a how-to.Create a new ESRI Shapefile line dataset called
routes.shpin theexercise_datadirectory, with attributesidandtype(use the approach above to guide you.)Activate edit mode on the
routeslayer.Since you are working with a line feature, click on the
 Add Line button to initiate line
digitizing mode.
Add Line button to initiate line
digitizing mode.One at a time, digitize the path and the track on the
routeslayer. Try to follow the routes as accurately as possible, adding additional points along corners or turns.Set the
typeattribute value topathortrack.Use the Layer Properties dialog to add styling to your routes. Feel free to use different styles for paths and tracks.
Save your edits and toggle off editing mode by pressing the
Toggle Editing button.
Odpowiedź
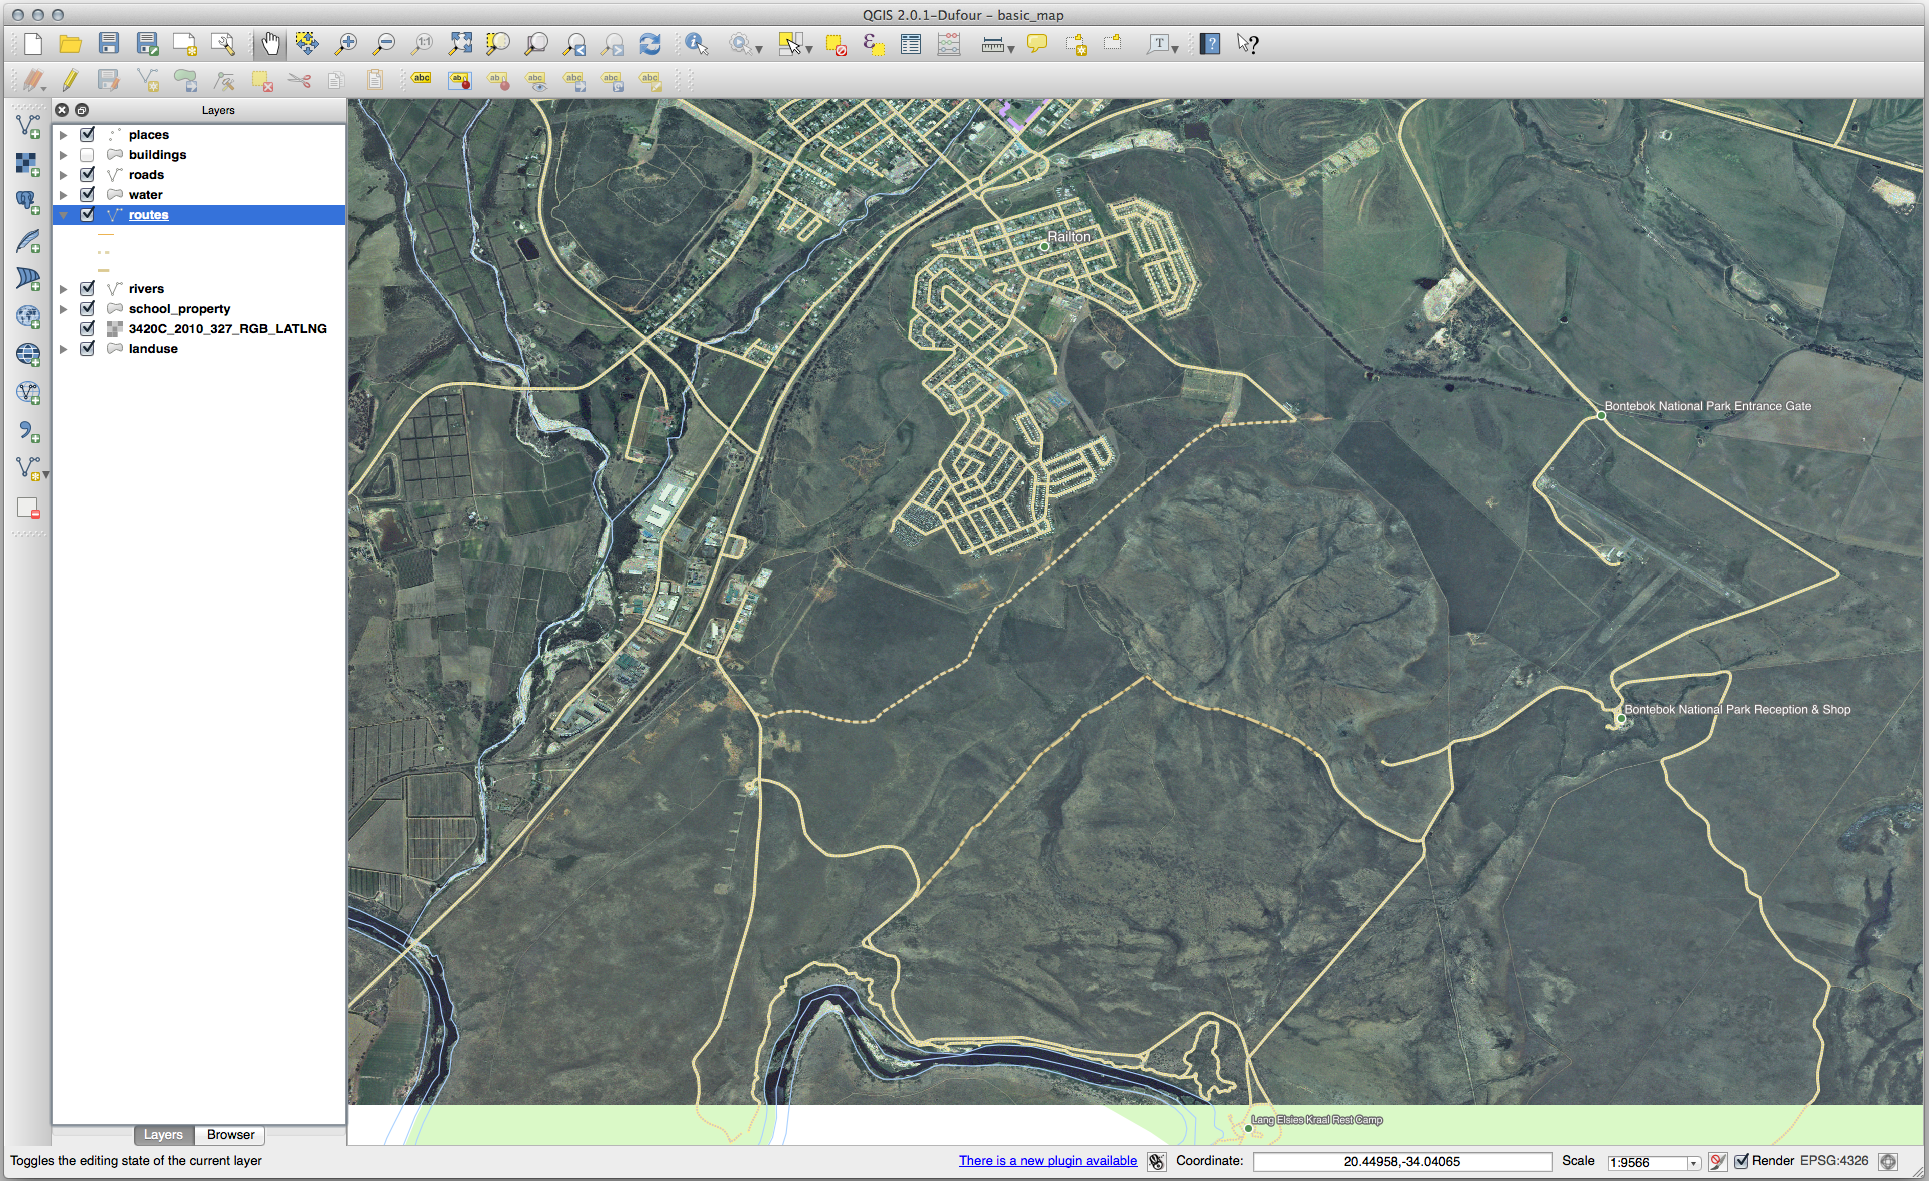
The symbology doesn’t matter, but the results should look more or less like this:
5.1.6. Wnioski
Now you know how to create features! This course doesn’t cover adding point features, because that’s not really necessary once you’ve worked with more complicated features (lines and polygons). It works exactly the same, except that you only click once where you want the point to be, give it attributes as usual, and then the feature is created.
Knowing how to digitize is important because it’s a very common activity in GIS programs.
5.1.7. Co dalej?
Features in a GIS layer aren’t just pictures, but objects in space. For example, adjacent polygons know where they are in relation to one another. This is called topology. In the next lesson you’ll see an example of why this can be useful.