Vector analysis
Basic statistics for fields
Generates basic statistics for a field of the attribute table of a vector layer.
Numeric, date, time and string fields are supported.
The statistics returned will depend on the field type.
Statistics are generated as an HTML file and are available in the .
Default menu:
Parameters
Label |
Name |
Type |
Description |
|---|---|---|---|
Input vector |
|
[vector: any] |
Vector layer to calculate the statistics on |
Field to calculate statistics on |
|
[tablefield: any] |
Any supported table field to calculate the statistics |
Statistics |
|
[file] |
HTML file for the calculated statistics |
Outputs
Label |
Name |
Type |
Description |
|---|---|---|---|
Statistics |
|
[file] |
HTML file with the calculated statistics |
Count |
|
[number] |
|
Number of unique values |
|
[number] |
|
Number of empty (null) values |
|
[number] |
|
Number of non-empty values |
|
[number] |
|
Minimum value |
|
[number] |
|
Maximum value |
|
[number] |
|
Minimum length |
|
[number] |
|
Maximum length |
|
[number] |
|
Mean length |
|
[number] |
|
Coefficient of Variation |
|
[number] |
|
Sum |
|
[number] |
|
Mean value |
|
[number] |
|
Standard deviation |
|
[number] |
|
Range |
|
[number] |
|
Median |
|
[number] |
|
Minority (rarest occurring value) |
|
[number] |
|
Majority (most frequently occurring value) |
|
[number] |
|
First quartile |
|
[number] |
|
Third quartile |
|
[number] |
|
Interquartile Range (IQR) |
|
[number] |
Count points in polygon
Takes a point and a polygon layer and counts the number of points from the first one in each polygon of the second one.
A new polygons layer is generated, with the exact same content as the input polygons layer, but containing an additional field with the points count corresponding to each polygon.
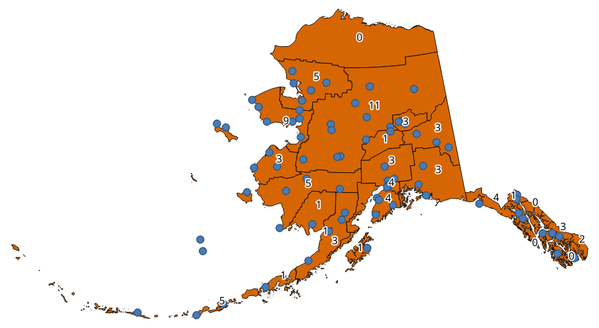
The labels identify the point count
An optional weight field can be used to assign weights to each point. Alternatively, a unique class field can be specified. If both options are used, the weight field will take precedence and the unique class field will be ignored.
Default menu:
Parameters
Label |
Name |
Type |
Description |
|---|---|---|---|
Polygons |
|
[vector: polygon] |
Polygon layer whose features are associated with the count of points they contain |
Points |
|
[vector: point] |
Point layer with features to count |
Weight field Optional |
|
[tablefield: any] |
A field from the point layer.
The count generated will be the sum of the weight field of the
points contained by the polygon.
If the weight field is not numeric, the count will be |
Class field Optional |
|
[tablefield: any] |
Points are classified based on the selected attribute and if several points with the same attribute value are within the polygon, only one of them is counted. The final count of the points in a polygon is, therefore, the count of different classes that are found in it. |
Count field name |
|
[string] Default: ‘NUMPOINTS’ |
The name of the field to store the count of points |
Count |
|
[vector: polygon] |
Specification of the output layer |
Outputs
Label |
Name |
Type |
Description |
|---|---|---|---|
Count |
|
[vector: polygon] |
Resulting layer with the attribute table containing the new column with the points count |
DBSCAN clustering
Clusters point features based on a 2D implementation of Density-based spatial clustering of applications with noise (DBSCAN) algorithm.
The algorithm requires two parameters, a minimum cluster size, and the maximum distance allowed between clustered points.
Parameters
Label |
Name |
Type |
Description |
|---|---|---|---|
Input layer |
|
[vector: point] |
Layer to analyze |
Minimum cluster size |
|
[number] Default: 5 |
Minimum number of features to generate a cluster |
Maximum distance between clustered points |
|
[number] Default: 1.0 |
Distance beyond which two features can not belong to the same cluster (eps) |
Cluster field name |
|
[string] Default: ‘CLUSTER_ID’ |
Name of the field where the associated cluster number shall be stored |
Treat border points as noise (DBSCAN*) Optional |
|
[boolean] Default: False |
If checked, points on the border of a cluster are themselves treated as unclustered points, and only points in the interior of a cluster are tagged as clustered. |
Clusters |
|
[vector: point] |
Vector layer for the result of the clustering |
Outputs
Label |
Name |
Type |
Description |
|---|---|---|---|
Clusters |
|
[vector: point] |
Vector layer containing the original features with a field setting the cluster they belong to |
Number of clusters |
|
[number] |
The number of clusters discovered |
See also
Distance matrix
Calculates for point features distances to their nearest features in the same layer or in another layer.
Default menu:
Parameters
Label |
Name |
Type |
Description |
|---|---|---|---|
Input point layer |
|
[vector: point] |
Point layer for which the distance matrix is calculated (from points) |
Input unique ID field |
|
[tablefield: any] |
Field to use to uniquely identify features of the input layer. Used in the output attribute table. |
Target point layer |
|
[vector: point] |
Point layer containing the nearest point(s) to search (to points) |
Target unique ID field |
|
[tablefield: any] |
Field to use to uniquely identify features of the target layer. Used in the output attribute table. |
Output matrix type |
|
[enumeration] Default: 0 |
Different types of calculation are available:
|
Use only the nearest (k) target points |
|
[number] Default: 0 |
You can choose to calculate the distance to all the points in the target layer (0) or limit to a number (k) of closest features. |
Distance matrix |
|
[vector: point] |
Outputs
Label |
Name |
Type |
Description |
|---|---|---|---|
Distance matrix |
|
[vector: point] |
Point (or MultiPoint for the “Linear (N * k x 3)” case) vector layer containing the distance calculation for each input feature. Its features and attribute table depend on the selected output matrix type. |
Distance to nearest hub (line to hub)
Creates lines that join each feature of an input vector to the nearest feature in a destination layer. Distances are calculated based on the center of each feature.
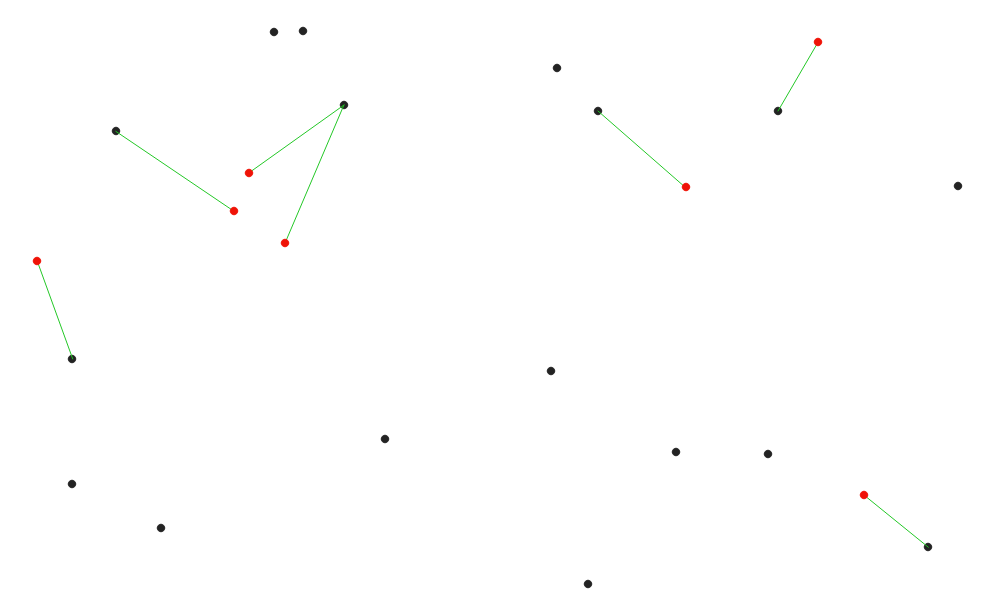
Display the nearest hub for the red input features
Parameters
Label |
Name |
Type |
Description |
|---|---|---|---|
Source points layer |
|
[vector: any] |
Vector layer for which the nearest feature is searched |
Destination hubs layer |
|
[vector: any] |
Vector layer containing the features to search for |
Hub layer name attribute |
|
[tablefield: any] |
Field to use to uniquely identify features of the destination layer. Used in the output attribute table |
Measurement unit |
|
[enumeration] Default: 0 |
Units in which to report the distance to the closest feature:
|
Hub distance |
|
[vector: line] |
Line vector layer for the distance matrix output |
Outputs
Label |
Name |
Type |
Description |
|---|---|---|---|
Hub distance |
|
[vector: line] |
Line vector layer with the attributes of the input features, the identifier of their closest feature and the calculated distance. |
Distance to nearest hub (points)
Creates a point layer representing the center of the input features with the addition of two fields containing the identifier of the nearest feature (based on its center point) and the distance between the points.
Parameters
Label |
Name |
Type |
Description |
|---|---|---|---|
Source points layer |
|
[vector: any] |
Vector layer for which the nearest feature is searched |
Destination hubs layer |
|
[vector: any] |
Vector layer containing the features to search for |
Hub layer name attribute |
|
[tablefield: any] |
Field to use to uniquely identify features of the destination layer. Used in the output attribute table |
Measurement unit |
|
[enumeration] Default: 0 |
Units in which to report the distance to the closest feature:
|
Hub distance |
|
[vector: point] |
Point vector layer for the distance matrix output. |
Outputs
Label |
Name |
Type |
Description |
|---|---|---|---|
Hub distance |
|
[vector: point] |
Point vector layer with the attributes of the input features, the identifier of their closest feature and the calculated distance. |
Join by lines (hub lines)
Creates hub and spoke diagrams by connecting lines from points on the spoke layer to matching points in the hub layer.
Determination of which hub goes with each point is based on a match between the Hub ID field on the hub points and the Spoke ID field on the spoke points.
If input layers are not point layers, a point on the surface of the geometries will be taken as the connecting location.
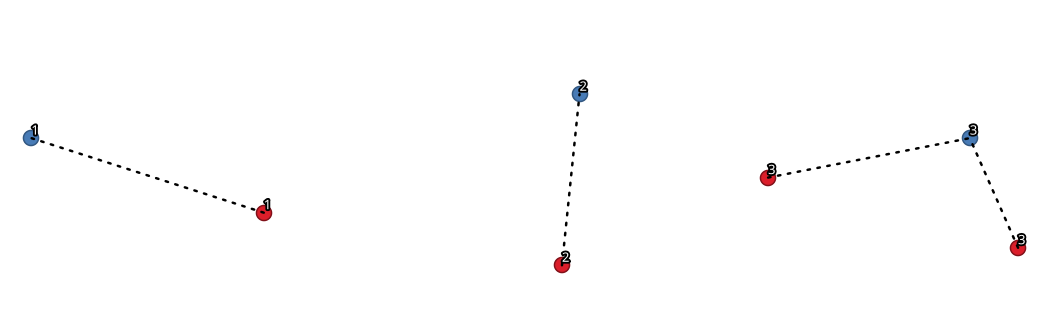
Join points on common field
Parameters
Label |
Name |
Type |
Description |
|---|---|---|---|
Hub layer |
|
[vector: any] |
Input layer |
Hub ID field |
|
[tablefield: any] |
Field of the hub layer with ID to join |
Hub layer fields to copy (leave empty to copy all fields) Optional |
|
[tablefield: any] [list] |
The field(s) of the hub layer to be copied. If no field(s) are chosen all fields are taken. |
Spoke layer |
|
[vector: any] |
Additional spoke point layer |
Spoke ID field |
|
[tablefield: any] |
Field of the spoke layer with ID to join |
Spoke layer fields to copy (leave empty to copy all fields) Optional |
|
[tablefield: any] [list] |
Field(s) of the spoke layer to be copied. If no fields are chosen all fields are taken. |
Hub lines |
|
[vector: lines] |
The resulting line layer |
Outputs
Label |
Name |
Type |
Description |
|---|---|---|---|
Hub lines |
|
[vector: lines] |
The resulting line layer |
K-means clustering
Calculates the 2D distance based k-means cluster number for each input feature.
K-means clustering aims to partition the features into k clusters in which each feature belongs to the cluster with the nearest mean. The mean point is represented by the barycenter of the clustered features.
If input geometries are lines or polygons, the clustering is based on the centroid of the feature.
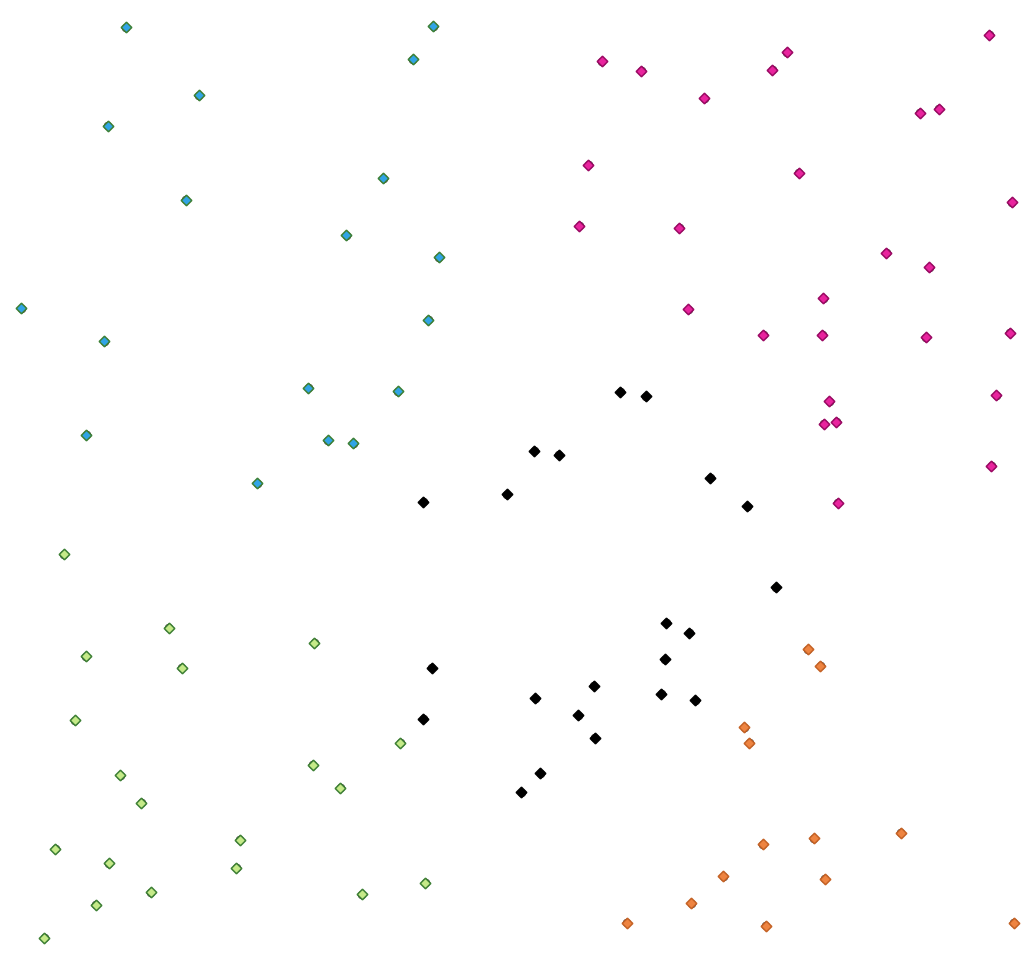
A five class point clusters
Parameters
Label |
Name |
Type |
Description |
|---|---|---|---|
Input layer |
|
[vector: any] |
Layer to analyze |
Number of clusters |
|
[number] Default: 5 |
Number of clusters to create with the features |
Cluster field name |
|
[string] Default: ‘CLUSTER_ID’ |
Name of the cluster number field |
Clusters |
|
[vector: any] |
Vector layer for generated the clusters |
Outputs
Label |
Name |
Type |
Description |
|---|---|---|---|
Clusters |
|
[vector: any] |
Vector layer containing the original features with a field specifying the cluster they belong to |
See also
List unique values
Lists unique values of an attribute table field and counts their number.
Default menu:
Parameters
Label |
Name |
Type |
Description |
|---|---|---|---|
Input layer |
|
[vector: any] |
Layer to analyze |
Target field(s) |
|
[tablefield: any] |
Field to analyze |
Unique values |
|
[table] |
Summary table layer with unique values |
HTML report |
|
[html] |
HTML report of unique values in the |
Outputs
Label |
Name |
Type |
Description |
|---|---|---|---|
Unique values |
|
[table] |
Summary table layer with unique values |
HTML report |
|
[html] |
HTML report of unique values. Can be opened from the |
Total unique values |
|
[number] |
The number of uniqe values in the input field |
UNIQUE_VALUES |
|
[string] |
A string with the comma separated list of unique values found in the input field |
Mean coordinate(s)
Computes a point layer with the center of mass of geometries in an input layer.
An attribute can be specified as containing weights to be applied to each feature when computing the center of mass.
If an attribute is selected in the parameter, features will be grouped according to values in this field. Instead of a single point with the center of mass of the whole layer, the output layer will contain a center of mass for the features in each category.
Default menu:
Parameters
Label |
Name |
Type |
Description |
|---|---|---|---|
Input layer |
|
[vector: any] |
Input vector layer |
Weight field Optional |
|
[tablefield: numeric] |
Field to use if you want to perform a weighted mean |
Unique ID field |
|
[tablefield: numeric] |
Unique field on which the calculation of the mean will be made |
Mean coordinates |
|
[vector: point] |
The (point vector) layer for the result |
Outputs
Label |
Name |
Type |
Description |
|---|---|---|---|
Mean coordinates |
|
[vector: point] |
Resulting point(s) layer |
Nearest neighbour analysis
Performs nearest neighbor analysis for a point layer.
Output is generated as an HTML file with the computed statistical values:
Observed mean distance
Expected mean distance
Nearest neighbour index
Number of points
Z-Score
Default menu:
Parameters
Label |
Name |
Type |
Description |
|---|---|---|---|
Input layer |
|
[vector: point] |
Point vector layer to calculate the statistics on |
Nearest neighbour |
|
[html] |
HTML file for the computed statistics |
Outputs
Label |
Name |
Type |
Description |
|---|---|---|---|
Nearest neighbour |
|
[html] |
HTML file with the computed statistics |
Observed mean distance |
|
[number] |
Observed mean distance |
Expected mean distance |
|
[number] |
Expected mean distance |
Nearest neighbour index |
|
[number] |
Nearest neighbour index |
Number of points |
|
[number] |
Number of points |
Z-Score |
|
[number] |
Z-Score |
Statistics by categories
Calculates statistics of fields depending on a parent class.
For numerical fields, a table layer with the following statistics is output:
count
unique
min
max
range
sum
mean
median
stdev
minority
majority
q1
q3
iqr
For string fields, the following statistics will be calculated:
count
unique
empty
filled
min
max
min_length
max_length
mean_length
Parameters
Label |
Name |
Type |
Description |
|---|---|---|---|
Input vector layer |
|
[vector: any] |
Input vector layer with unique classes and values |
Field to calculate statistics on (if empty, only count is calculated) Optional |
|
[tablefield: any] |
If empty only the count will be calculated |
Field(s) with categories |
|
[vector: any] [list] |
The fields that (combined) define the categories |
Statistics by category |
|
[table] |
Table for the generated statistics |
Outputs
Label |
Name |
Type |
Description |
|---|---|---|---|
Statistics by category |
|
[table] |
Table containing the statistics |
Sum line lengths
Takes a polygon layer and a line layer and measures the total length of lines and the total number of them that cross each polygon.
The resulting layer has the same features as the input polygon layer, but with two additional attributes containing the length and count of the lines across each polygon.
The names of these two fields can be configured in the algorithm parameters.
Default menu:
Parameters
Label |
Name |
Type |
Description |
|---|---|---|---|
Lines |
|
[vector: line] |
Input vector line layer |
Polygons |
|
[vector: polygon] |
Polygon vector layer |
Lines length field name |
|
[string] Default: ‘LENGTH’ |
Name of the field for the lines length |
Lines count field name |
|
[string] Default: ‘COUNT’ |
Name of the field for the lines count |
Line length |
|
[vector: polygon] |
The output polygon vector layer |
Outputs
Label |
Name |
Type |
Description |
|---|---|---|---|
Line length |
|
[vector: polygon] |
Polygon output layer with fields of lines length and line count |