14.8. 课: 基于LiDAR数据的DEM
通过使用不同的背景图像,可以改善地图的外观。您可以使用之前使用过的底图或航拍图像,但在某些情况下,地形的山体阴影栅格看起来会更好。
您将使用LAStools从LiDAR数据集中提取DEM,然后创建山体阴影栅格,以便稍后在地图表达中使用。
本课目标: 安装LAStools并根据LiDAR数据和山体阴影栅格计算DEM。
14.8.1.  跟我做: 安装Lastools
使用 LAStools 提供的处理框架和算法,可以在QGIS中管理LiDAR数据。
您可以从LiDAR点云获取数字高程模型 (DEM),然后创建一个更直观的山体阴影栅格,便于报告。首先,为正确使用LAStools必须设置 处理 框架设置:
如果已经启动QGIS,请关闭。
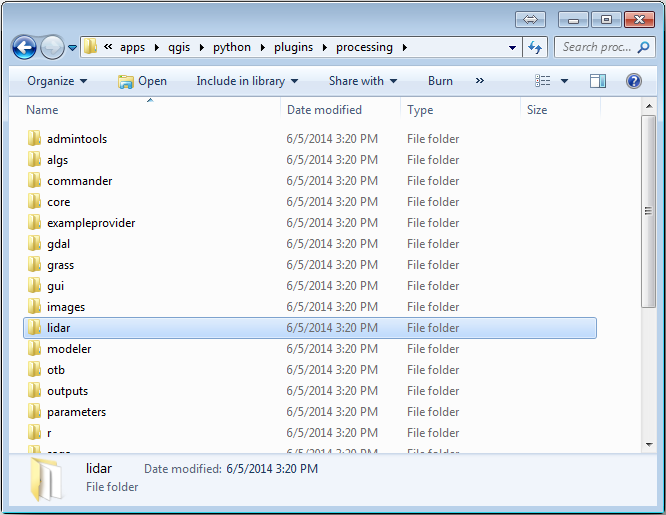
默认情况下,您的系统可能会安装旧版LiDAR插件,该插件位于
C:/Program Files/QGIS Valmiera/apps/qgis/python/plugins/processing/文件夹。如果您有一个名为 lidar 的文件夹,请将其删除。这对 QGIS 2.2 和 2.4 的某些安装有效。
Go to the
exercise_data\forestry\lidar\folder, there you can find the fileQGIS_2_2_toolbox.zip. Open it and extract the lidar folder to replace the one you just deleted.If you are using a different QGIS version, you can see more installation instructions in this tutorial.
Now you need to install the LAStools to your computer. Get the newest
lastools version here
and extract the content of the lastools.zip file into a folder in your
system, for example, C:\lastools\. The path to the lastools
folder cannot have spaces or special characters.
备注
Read the LICENSE.txt file inside the lastools folder. Some of the LAStools are open source and other are closed source and require licensing for most commercial and governmental use. For education and evaluation purposes you can use and test LAStools as much as you need to.
The plugin and the actual algorithms are now installed in your computer and almost ready to use, you just need to set up the Processing framework to start using them:
Open a new project in QGIS.
Set the project's CRS to ETRS89 / ETRS-TM35FIN.
Save the project as forest_lidar.qgs.
To setup the LAStools in QGIS:
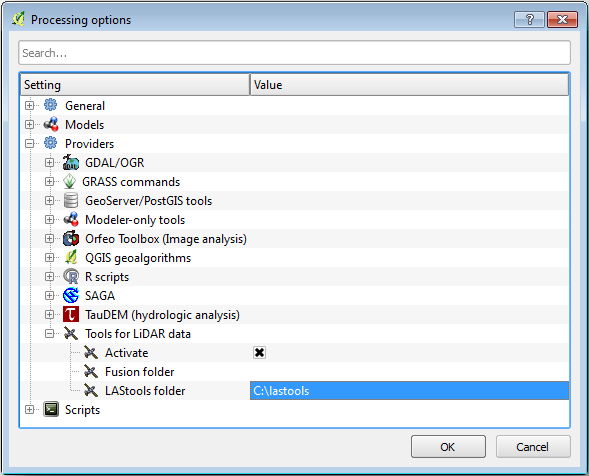
Go to .
In the Processing options dialog, go to Providers and then to Tools for LiDAR data.
Check Activate.
For LAStools folder set c:\lastools\ (or the folder you extracted LAStools to).
14.8.2. Follow Along: Calculating a DEM with LAStools
You have already used the toolbox in 课: 空间统计 to run some SAGA algorithms. Now you are going to use it to run LAStools programs:
Open .
In the dropdown menu at the bottom, select Advanced interface.
You should see the Tools for LiDAR data category.
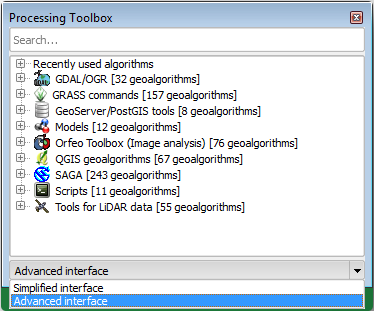
Expand it to see the tools available, and expand also the LAStools category (the number of algorithms may vary).
Scroll down until you find the lasview algorithm, double click it to open.
At Input LAS/LAZ file, browse to
exercise_data\forestry\lidar\and select therautjarvi_lidar.lazfile.
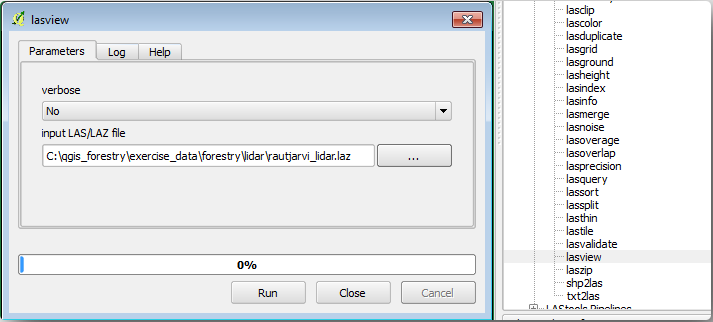
Click Run.
Now you can see the LiDAR data in the just a little LAS and LAZ viewer dialog window:
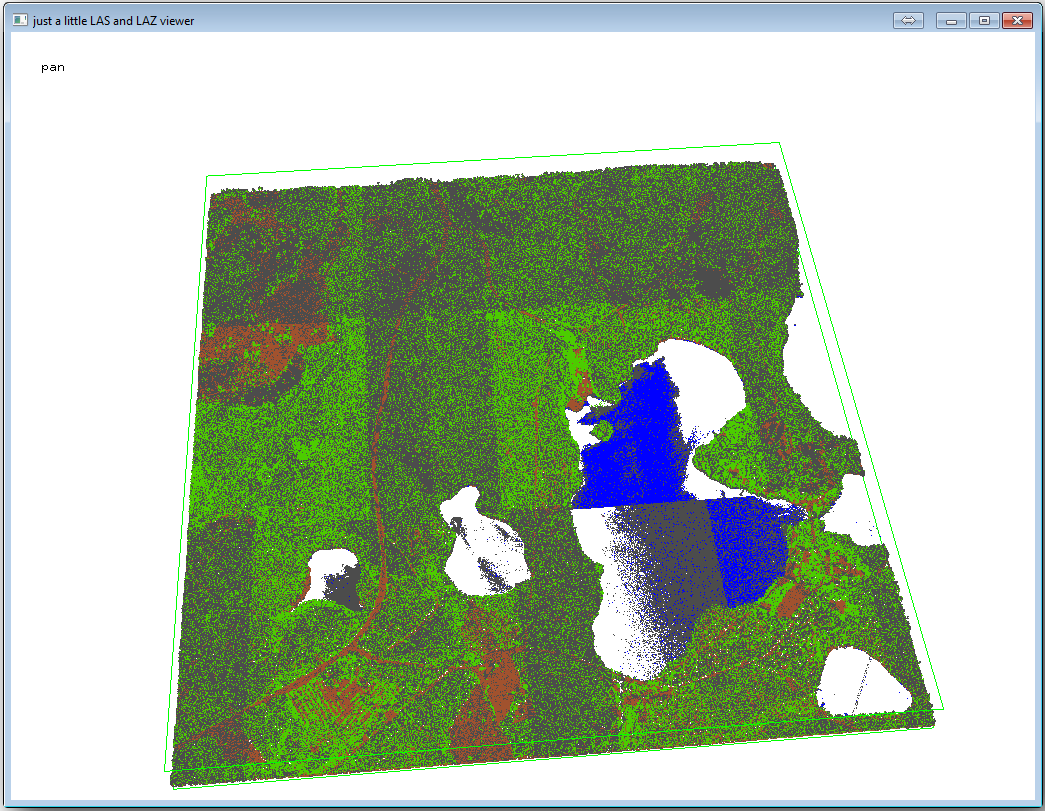
There are many things you can do within this viewer, but for now you can just click and drag on the viewer to pan the LiDAR point cloud to see what it looks like.
备注
If you want to know further details on how the LAStools work, you can
read the README text files about each of the tools, in the C:\lastools\bin\
folder. Tutorials and other materials are available at the Rapidlasso webpage.
Close the viewer when you are ready.
Creating a DEM with LAStools can be done in two steps, first one to classify the point cloud into ground and no ground points and then calculating a DEM using only the ground points.
Go back to the Processing Toolbox.
Note the Search... box, write lasground.
Double click to open the lasground tool and set it as shown in this image:
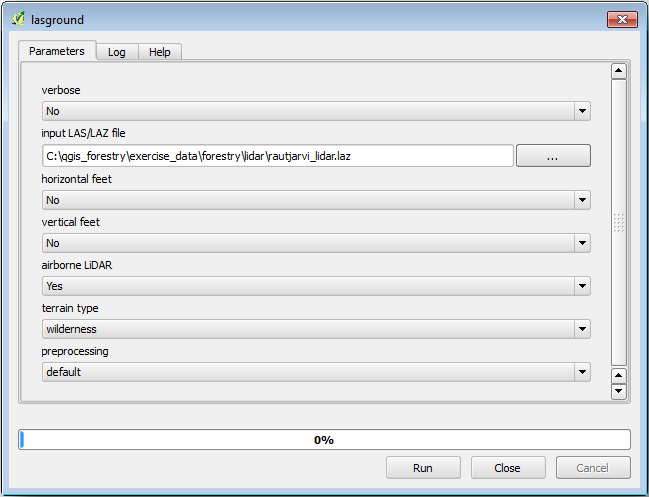
The output file is saved to the same folder where the
rautjarvi_lidar.lazis located and it is namedrautjarvi_lidar_1.las.
You can open it with lasview if you want to check it.
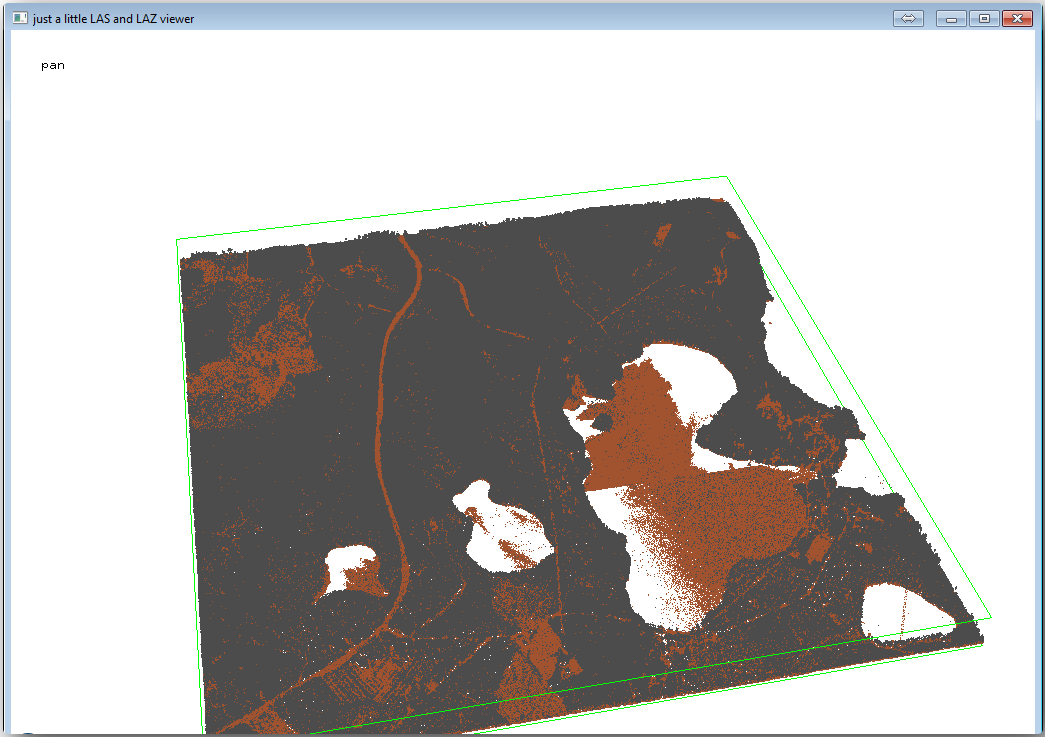
The brown points are the points classified as ground and the gray ones are the rest,
you can click the letter g to visualize only the ground points or the
letter u to see only the unclassified points. Click the letter a
to see all the points again. Check the lasview_README.txt file for more
commands. If you are interested, also this tutorial
about editing LiDAR points manually will show you different operations within
the viewer.
Close the viewer again.
In the Processing Toolbox, search for las2dem.
Open the las2dem tool and set it as shown in this image:
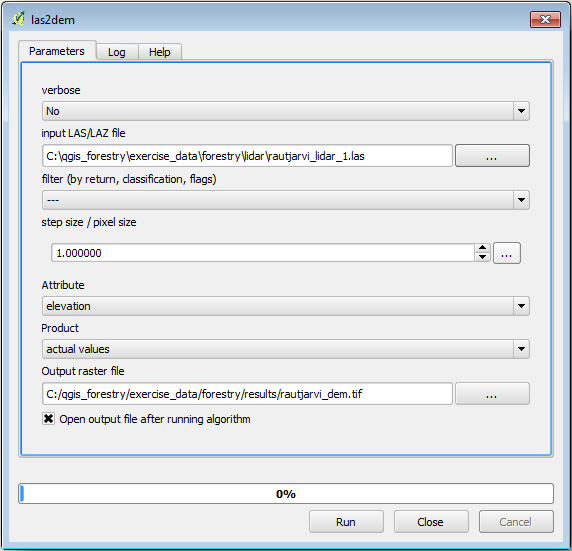
The result DEM is added to your map with the generic name Output raster file.
备注
The lasground and las2dem tools require licensing. You can use the unlicensed tool as indicated in the license file, but you get the diagonals you can appreciate in the image results.
14.8.3. Follow Along: Creating a Terrain Hillshade
- For visualization purposes, a hillshade generated from a DEM gives a better
visualization of the terrain:
Open .
As the Output layer, browse to
exercise_data\forestry\lidar\and name the filehillshade.tif.Leave the rest of parameters with the default settings.
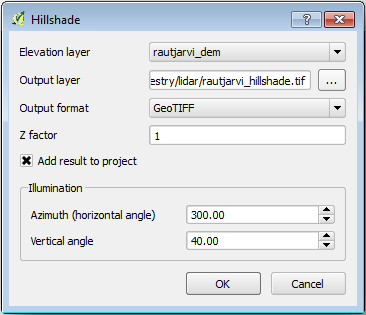
Select ETRS89 / ETRS-TM35FIN as the CRS when prompted.
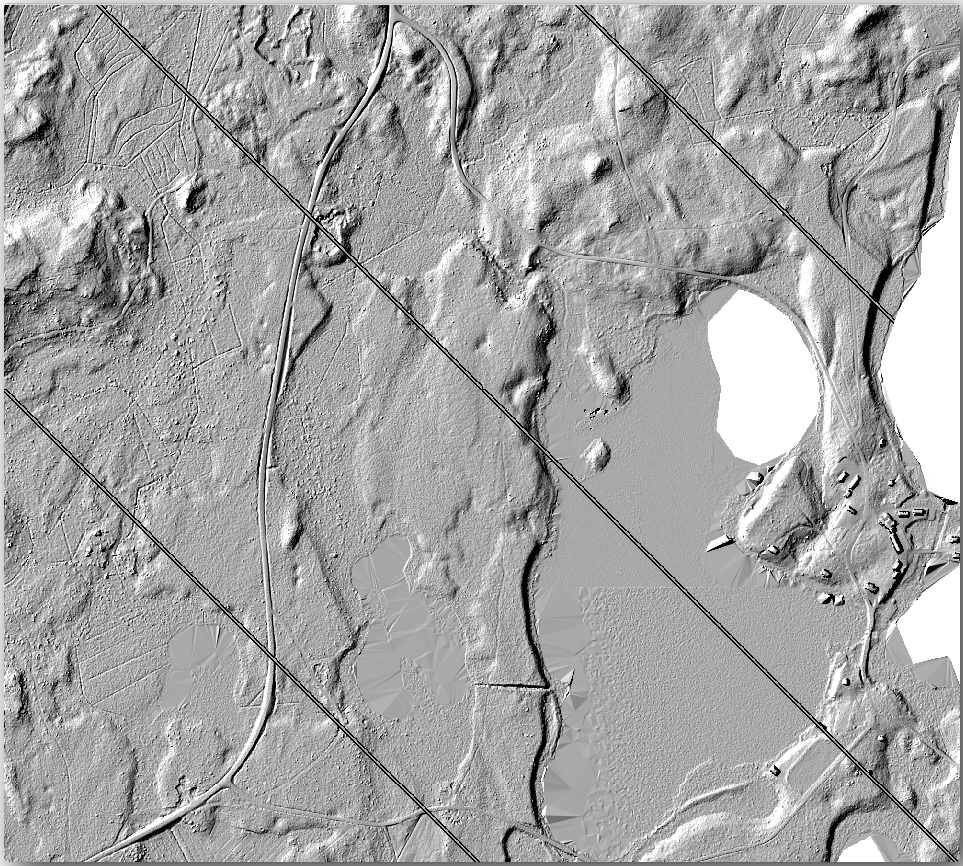
Despite the diagonal lines remaining in the hillshade raster result, you can clearly see an accurate relief of the area. You can even see the different soil drains that have been dug in the forests.
14.8.4. In Conclusion
Using LiDAR data to get a DEM, specially in forested areas, gives good results with not much effort. You could also use ready LiDAR derived DEMs or other sources like the SRTM 9m resolution DEMs. Either way, you can use them to create a hillshade raster to use in your map presentations.
14.8.5. What's Next?
In the next, and final step in this module, lesson you will use the hillshade raster and the forest inventory results to create a map presentation of the results.