18.3. Creating an Output
图 18.58 shows an example print layout including all the types of layout items described in the previous section.
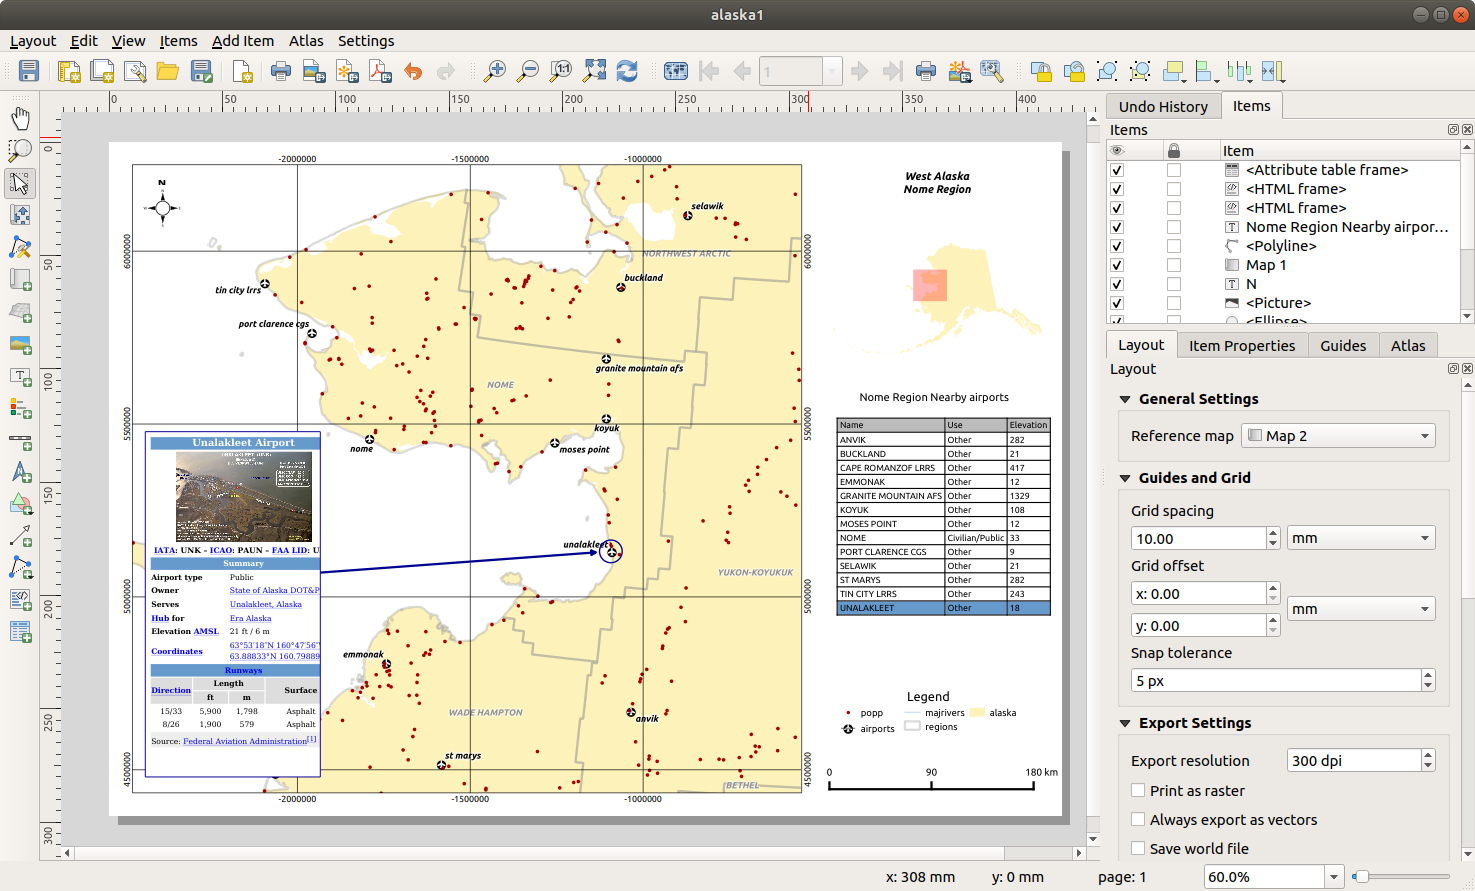
图 18.58 Print Layout with map view, legend, image, scale bar, coordinates, text and HTML frame added
From the menu or toolbar, you can output the print layout to different file formats, and it is possible to modify the resolution (print quality) and paper size:
The
 Print icon allows you to print the layout to a
connected printer or a PostScript file, depending on the installed printer
drivers.
Print icon allows you to print the layout to a
connected printer or a PostScript file, depending on the installed printer
drivers.The
 Export as image icon exports the print layout
image formats such as
Export as image icon exports the print layout
image formats such as PNG,BMP,TIF,JPG, and many others...The
 Export as SVG icon saves the print layout
as an
Export as SVG icon saves the print layout
as an SVG(Scalable Vector Graphic).The
 Export as PDF icon saves the defined print layout
directly as a
Export as PDF icon saves the defined print layout
directly as a PDF(Portable Document Format) file.
18.3.1. Export settings
Whenever you export a print layout, there are a selection of export settings QGIS needs to check in order to produce the most appropriate output. These configurations are:
The Export settings of the Layout panel, such as Export resolution, Print as raster Always export as vectors or Save world file
Exclude page from exports in the page item properties panel
Exclude item from exports in the item properties panel
18.3.2. Export as Image
To export a layout as an image:
Click the
Export as image iconSelect the image format, the folder and filename (e.g.
myill.png) to use. If the layout contains more than one page, each page will be exported to a file with the given filename with the page number appended (e.g.myill_2.png).In the next (Image Export Options) dialog:
You can override the print layout Export resolution and the exported page dimensions (as set in Layout panel).
Image rendering can also be improved with the Enable antialiasing option.
If you want to export your layout as a georeferenced image (e.g., to share with other projects), check the
 Generate
world file option, and an ESRI World File with the same name as the
exported image, but a different extension (
Generate
world file option, and an ESRI World File with the same name as the
exported image, but a different extension (.tfwfor TIFF,.pnwfor PNG,jgwfor JPEG, ...) will be created when exporting. This option can also be checked by default in the layout panel.备注
For multi-page output, only the page that contains the reference map will get a world file (assuming that the Generate world file option is checked).
By checking
 Crop to content option, the image output
by the layout will include the minimal area enclosing all the items (map,
legend, scale bar, shapes, label, image...) of each page of the composition:
Crop to content option, the image output
by the layout will include the minimal area enclosing all the items (map,
legend, scale bar, shapes, label, image...) of each page of the composition:If the composition includes a single page, then the output is resized to include EVERYTHING on the composition. The page can then be reduced or extended to all items depending on their position (on, above, below, left or right of the page).
In case of a multi-page layout, each page will be resized to include items in its area (left and right sides for all pages, plus top for the first page and bottom for the last page). Each resized page is exported to a separate file.
The Crop to content dialog also lets you add margins around the cropped bounds.
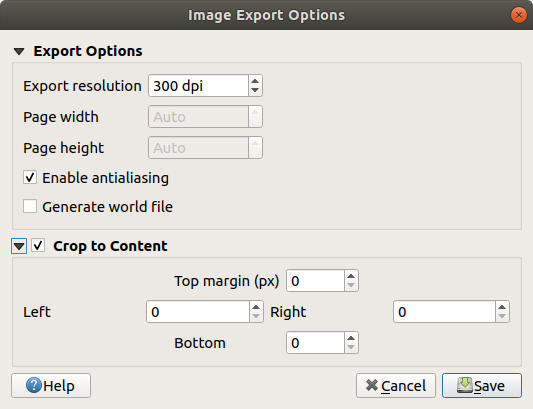
图 18.59 Image Export Options, output is resized to items extent
小技巧
Use image formats that support transparency when items extend beyond the paper extent
Layout items may be placed outside the paper extent. When exporting
with the Crop to content option, the resulting
image may therefore extend beyond the paper extent.
Since the background outside of the paper extent will be transparent,
for image formats that do not support transparency
(e.g. BMP and JPG) the transparent background will be
rendered as full black, "corrupting" the image.
Use transparency-compatible formats (e.g. TIFF and PNG)
in such cases.
备注
When supported by the format (e.g. PNG) and the
underlying Qt library, the exported image may include project
metadata (author, title, date, description...)
18.3.3. Export as SVG
To export a layout as SVG:
Click the
Export as SVG iconFill in the path and filename (used as a base name for all the files in case of multi-page composition, as for image export)
In the next SVG Export Options dialog, you can override the layout default export settings or configure new ones:
- Export map layers as SVG groups: exported items are
grouped within layers whose name matches the layer names from QGIS, making
it much easier to understand the contents of the document.
- Always export as vectors: some rendering options
require items to be rasterized for a better rendering. Check this option to
keep the objects as vectors with the risk that the appearance of the output
file may not match the print layout preview (for more details, see
Export settings).
- Export RDF metadata of the document such as the
title, author, date, description...
- Simplify geometries to reduce output file size: this
avoids exporting ALL geometry vertices, which can result in a ridiculously
complex and large export file size that could fail to load in other applications.
Geometries will be simplified while exporting the layout in order to remove
any redundant vertices which are not discernably different at the export
resolution (e.g. if the export resolution is
300 dpi, vertices that are less than1/600 inchapart will be removed). Set the Text export: controls whether text labels are exported as proper text objects (Always export texts as text objects) or as paths only (Always export texts as paths). If they are exported as text objects, they can be edited in external applications (e.g. Inkscape) as normal text. BUT the side effect is that the rendering quality is reduced, AND there are issues with rendering when certain text settings like buffers are in place. That’s why exporting as paths is recommended.
Apply
Crop to content option- Disable tiled raster layer exports: When exporting
files, QGIS uses a built-in raster layer tiled rendering that saves memory.
Sometimes, this can cause visible "seams" in the rasters
for generated files. Checking this option would fix that, at the cost of a
higher memory usage during exports.
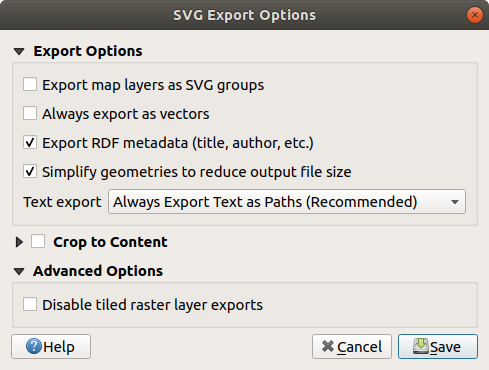
图 18.60 SVG Export Options
备注
Currently, the SVG output is very basic. This is not a QGIS problem, but a problem with the underlying Qt library. This will hopefully be sorted out in future versions.
18.3.4. Export as PDF
To export a layout as PDF:
Click the
Export as PDF iconFill in the path and filename: unlike for image and SVG export, all the pages in the layout are exported to a single PDF file.
In the next PDF Export Options dialog, you can override the layout default export settings or configure new ones:
- Always export as vectors: some rendering options
require items to be rasterized for a better rendering. Check this option to
keep the objects as vectors with the risk that the appearance of the output
file may not match the print layout preview (for more details, see
Export settings).
- Append georeference information: available only if
the reference map, from which the information is taken,
is on the first page.
- Export RDF metadata of the document such as the
title, author, date, description...
Set the Text export: controls whether text labels are exported as proper text objects (Always export texts as text objects) or as paths only (Always export texts as paths). If they are exported as text objects then they can be edited in external applications (e.g. Inkscape) as normal text. BUT the side effect is that the rendering quality is decreased, AND there are issues with rendering when certain text settings like buffers are in place. That’s why exporting as paths is recommended.
Control the PDF Image compression using:
Lossy (JPEG), which is the default compression mode
or Lossless, which creates bigger files in most cases, but is much more suitable for printing outputs or for post-production in external applications (requires Qt 5.13 or later).
- Create Geospatial PDF (GeoPDF):
Generate a georeferenced PDF file (requires GDAL version 3 or later).
- Disable tiled raster layer exports: When exporting
files, QGIS uses tiled based rendering that saves memory.
Sometimes, this can cause visible "seams" in the rasters for generated files.
Checking this option would fix that, at the cost of a higher memory usage
during exports.
- Simplify geometries to reduce output file size:
Geometries will be simplified while exporting the layout by removing
vertices that are not discernably different at the export resolution
(e.g. if the export resolution is
300 dpi, vertices that are less than1/600 inchapart will be removed). This can reduce the size and complexity of the export file (very large files can fail to load in other applications).
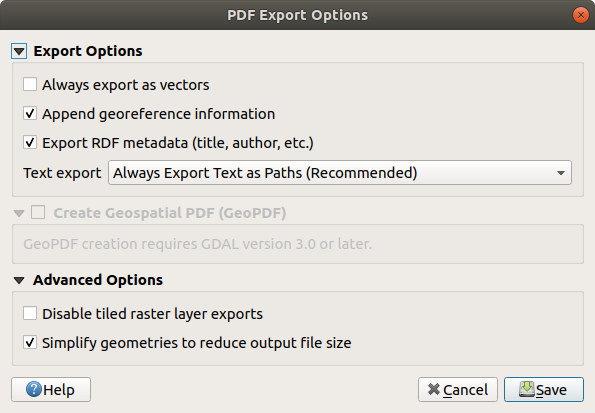
图 18.61 PDF Export Options
备注
Since QGIS 3.10, with GDAL 3, GeoPDF export is supported, and a number of GeoPDF specific options are available:
Format (GeoPDF format - there are some GeoPDF variations),
Include multiple map themes (specify map themes to include),
Include vector feature information (choose the layers and group them into logical PDF groups).
备注
Exporting a print layout to formats that supports georeferencing
(e.g. PDF and TIFF) creates a georeferenced output by default.
18.3.5. Generate an Atlas
Atlas functions allow you to create map books in an automated way. Atlas uses the features of a table or vector layer (Coverage layer) to create an output for each feature (atlas feature) in the table / layer. The most common usage is to zoom a map item to the current atlas feature. Further use cases include:
a map item showing, for another layer, only features that share the same attribute as the atlas feature or are within its geometry.
a label or HTML item whose text is replaced as features are iterated over
a table item showing attributes of associated parent or children features of the current atlas feature...
For each feature, the output is processed for all pages and items according to their exports settings.
小技巧
Use variables for more flexibility
QGIS provides a large panel of functions and variables, including atlas related ones, that you can use to manipulate the layout items, but also the symbology of the layers, according to atlas status. Combining these features gives you a lot of flexibility and helps you easily produce advanced maps.
To enable the generation of an atlas and access atlas parameters, refer to the Atlas panel. This panel contains the following (see 图 18.62):
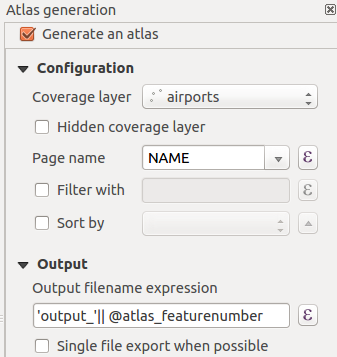
图 18.62 Atlas Panel
- Generate an atlas enables or disables atlas
generation.
Configuration
A Coverage layer
 combo box that allows you to
choose the table or vector layer containing the features to iterate over.
combo box that allows you to
choose the table or vector layer containing the features to iterate over.An optional
Hidden coverage layer that, if checked,
will hide the coverage layer (but not the other layers) during the generation.An optional Page name combo box to specify the name for the feature page(s). You can select a field of the coverage layer or set an expression. If this option is empty, QGIS will use an internal ID, according to the filter and/or the sort order applied to the layer.
An optional
Filter with text area that allows you
to specify an
expression for filtering features from the coverage layer. If the expression
is not empty, only features that evaluate to Truewill be processed.An optional
Sort by that allows you to
sort features of the coverage layer (and the output), using a field of the
coverage layer or an expression.
The sort order (either ascending or descending) is set by the two-state
Sort direction button that displays an up or a down arrow.
Output - this is where the output of the atlas can be configured:
An Output filename expression textbox that is used to generate a filename for each atlas feature. It is based on expressions. is meaningful only for rendering to multiple files.
A
Single file export when possible that allows you to
force the generation of a single file if this is possible with the chosen output
format (PDF, for instance). If this field is checked, the value of the Output filename expression field is meaningless.An Image export format drop-down list to select the output format when using the
Export atlas as Images... button.
18.3.5.1. Control map by atlas
The most common usage of atlas is with the map item, zooming to the current atlas feature, as iteration goes over the coverage layer. This behavior is set in the Controlled by atlas group properties of the map item. See Controlled by atlas for different settings you can apply on the map item.
18.3.5.2. Customize labels with expression
In order to adapt labels to the feature the atlas iterates over, you can
include expressions. Make sure that you place the expression part
(including functions, fields or variables) between [% and %] (see
The Label Item for more details).
For example, for a city layer with fields CITY_NAME and ZIPCODE,
you could insert this:
The area of [% concat( upper(CITY_NAME), ',', ZIPCODE, ' is ',
format_number($area/1000000, 2) ) %] km2
or, another combination:
The area of [% upper(CITY_NAME)%],[%ZIPCODE%] is
[%format_number($area/1000000,2) %] km2
The information
[% concat( upper(CITY_NAME), ',', ZIPCODE, ' is ', format_number($area/1000000, 2) ) %]
is an expression used inside the label.
Both expressions would result in the following type of label in the
generated atlas:
The area of PARIS,75001 is 1.94 km2
18.3.5.3. Explore Data-defined override buttons with atlas
There are several places where you can use a  Data defined override button to override the selected setting.
This is particularly useful with atlas generation.
See Data defined override setup for more details on this widget.
Data defined override button to override the selected setting.
This is particularly useful with atlas generation.
See Data defined override setup for more details on this widget.
For the following examples the Regions layer of the QGIS sample
dataset is used and selected as Coverage layer for
the atlas generation.
We assume that it is a single page layout containing a map item and
a label item.
When the height (north-south) of a region extent is greater than its
width (east-west), you should use Portrait instead of Landscape
orientation to optimize the use of paper.
With a Data Defined Override button you can
dynamically set the paper orientation.
Right-click on the page and select Page Properties to open the
panel. We want to set the orientation dynamically, using an expression
depending on the region geometry, so press the button of
field Orientation, select Edit... to open the
Expression string builder dialog and enter the following
expression:
CASE WHEN bounds_width(@atlas_geometry) > bounds_height(@atlas_geometry)
THEN 'Landscape' ELSE 'Portrait' END
Now if you preview the atlas, the paper orients itself
automatically, but item placements may not be ideal. For each Region you need to
reposition the location of the layout items as well. For the map item you can
use the button of its Width property to set it
dynamic using the following expression:
@layout_pagewidth - 20
Likewise, use the button of the Height property to
provide the following expression to constrain map item size:
@layout_pageheight - 20
To ensure the map item is centered in the page, set its Reference
point to the upper left radio button and enter 10 for its X
and Y positions.
Let's add a title above the map in the center of the page. Select the label
item and set the horizontal alignment to  Center.
Next move the label to the right position, choose the middle button for
the Reference point, and provide the following expression for
field X:
Center.
Next move the label to the right position, choose the middle button for
the Reference point, and provide the following expression for
field X:
@layout_pagewidth / 2
For all other layout items you can set the position in a similar way so they are correctly positioned both for portrait and landscape. You can also do more tweaks such as customizing the title with feature attributes (see Customize labels with expression example), changing images, resizing the number of legend columns number according to page orientation, ...
The information provided here is an update of the excellent blog (in English and Portuguese) on the Data Defined Override options Multiple_format_map_series_using_QGIS_2.6 .
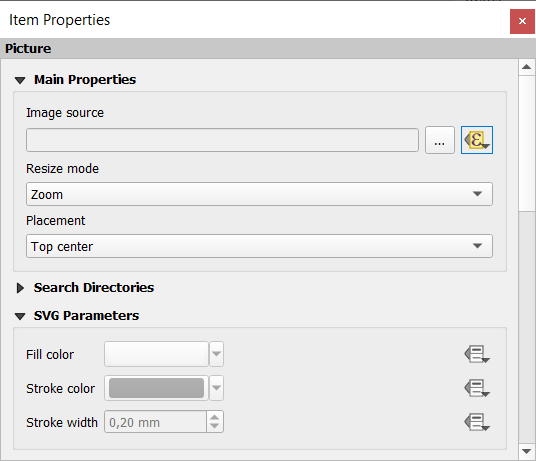
Another example for using data-defined override buttons is the usage of a dynamic
picture. For the following examples we use a geopackage layer containing a BLOB field
called logo with the field type binary (see Creating a new GeoPackage layer).
For every feature there is defined a different picture so that the atlas can iterate
over as described in Preview and generate an atlas.
All you need to do is add a picture in the print layout and go to its
Item properties in the atlas context. There you can find a
data-defined override button in the Image source section of the
Main Properties.
In the following window choose Edit so that the Expression String Builder
opens. From the Fields and values section you can find the BLOB field that
was defined in the geopackage layer. Double-click the field name logo and click OK.
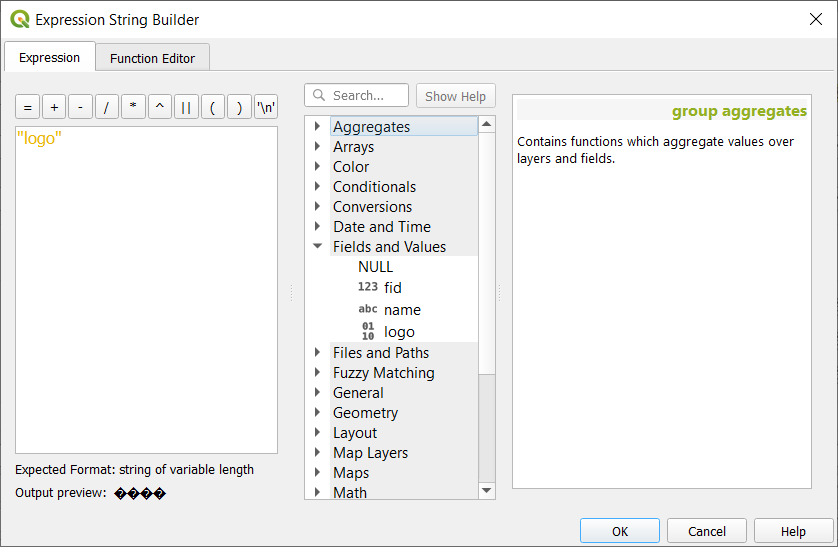
The atlas iterates over the entries in the BLOB field provided that you choose the geopackage layer as Coverage layer (further instructions you can find in Preview and generate an atlas).
These are just two examples of how you can use some advanced settings with atlas.
18.3.5.4. Preview and generate an atlas

图 18.63 Atlas Preview toolbar
Once the atlas settings have been configured, and layout items (map, table,
image...) linked to it, you can create a preview of all the pages by choosing
or clicking the
 Preview Atlas icon.
You can then use the arrows to navigate through all the features:
Preview Atlas icon.
You can then use the arrows to navigate through all the features:
 First feature
 Previous feature
 Next feature
 Last feature
You can also use the combo box to select and preview a specific feature. The combo box shows atlas feature names according to the expression set in the atlas Page name option.
As for simple compositions, an atlas can be generated in different ways (see Creating an Output for more information - just use tools from the menu or toolbar instead of the menu.
This means that you can directly print your compositions with
.
You can also create a PDF using :
You will be asked for a directory to save all the generated PDF files,
except if the Single file export when possible has been
selected. In that case, you'll be prompted to give a filename.
With or tool, you're also prompted to select a folder. Each page of each atlas feature composition is exported to the image file format set in Atlas panel or to SVG.
备注
With multi-page output, an atlas behaves like a layout in that only the page that contains the General settings will get a world file (for each feature output).
小技巧
Print a specific atlas feature
If you want to print or export the composition of only one feature of the atlas, simply start the preview, select the desired feature in the drop-down list and click on (or to any supported file format).
18.3.5.5. Use project defined relations for atlas creation
For users with HTML and Javascript knowledge it is possible to operate on GeoJSON objects and use project defined relations from the QGIS project. The difference between this approach and using expressions directly inserted into the HTML is that it gives you a full, unstructured GeoJSON feature to work with. This means that you can use existing Javascript libraries and functions that operate on GeoJSON feature representations.
The following code includes all related child features from the defined relation.
Using the JavaScript setFeature function it allows you to make flexible HTML
which represents relations in whatever format you like (lists, tables, etc).
In the code sample, we create a dynamic bullet list of the related child features.
// Declare the two HTML div elements we will use for the parent feature id
// and information about the children
<div id="parent"></div>
<div id="my_children"></div>

<script type="text/javascript">
   function setFeature(feature)
   {
     // Show the parent feature's identifier (using its "ID" field)
     document.getElementById('parent').innerHTML = feature.properties.ID;
     //clear the existing relation contents
     document.getElementById('my_children').innerHTML = '';
     feature.properties.my_relation.forEach(function(child_feature) {
     // for each related child feature, create a list element
     // with the feature's name (using its "NAME" field)
       var node = document.createElement("li");
       node.appendChild(document.createTextNode(child_feature.NAME));
       document.getElementById('my_children').appendChild(node);
     });
   }
</script>
During atlas creation there will be an iteration over the coverage layer containing the parent features. On each page, you will see a bullet list of the related child features following the parent's identifier.