10.2. Lesson: Web Feature Services
A Web Feature Service (WFS) provides its users with GIS data in formats that can be loaded directly in QGIS. Unlike a WMS, which provides you only with a map which you can’t edit, a WFS gives you access to the features themselves.
The goal for this lesson: To use a WFS and understand how it differs from a WMS.
10.2.1. ★☆☆ Follow Along: Loading a WFS Layer
Start a new map. This is for demo purposes and won’t be saved.
Click the
 Open Data Source Manager button.
Enable the
 WFS / OGC API - Features tab.
Click the New button.
In the dialog that appears, enter the Name as
nsidc.organd the URL ashttps://nsidc.org/cgi-bin/atlas_south?version=1.1.0.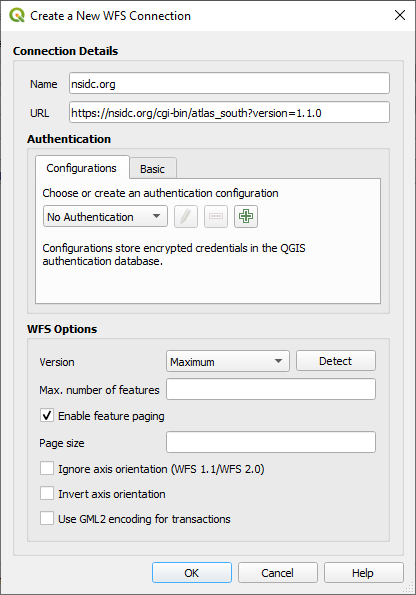
Click OK, and the new connection will appear in your Server connections.
Click the Connect. A list of the available layers will appear:
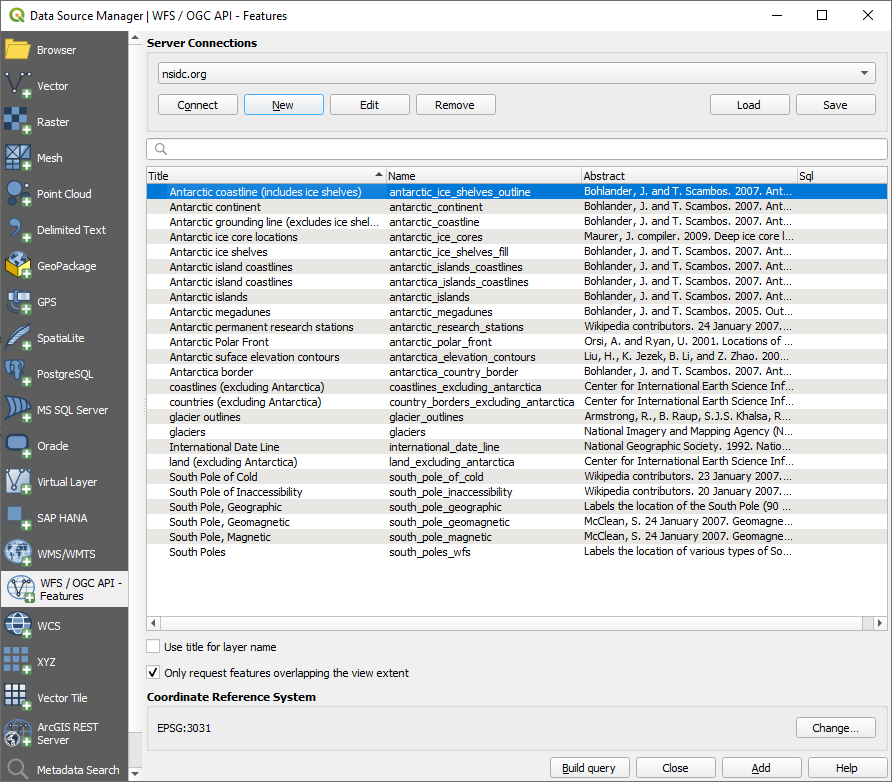
Uncheck the Only request features overlapping the view extent option below the layers list, since your current map canvas may not cover our area of interest: Antarctica.
Find the layer
antarctica_country_border. You can use the Filter box at the top.Click on the layer to select it:
Find and select also the layer
south_poles_wfs. You might need to hold Ctrl.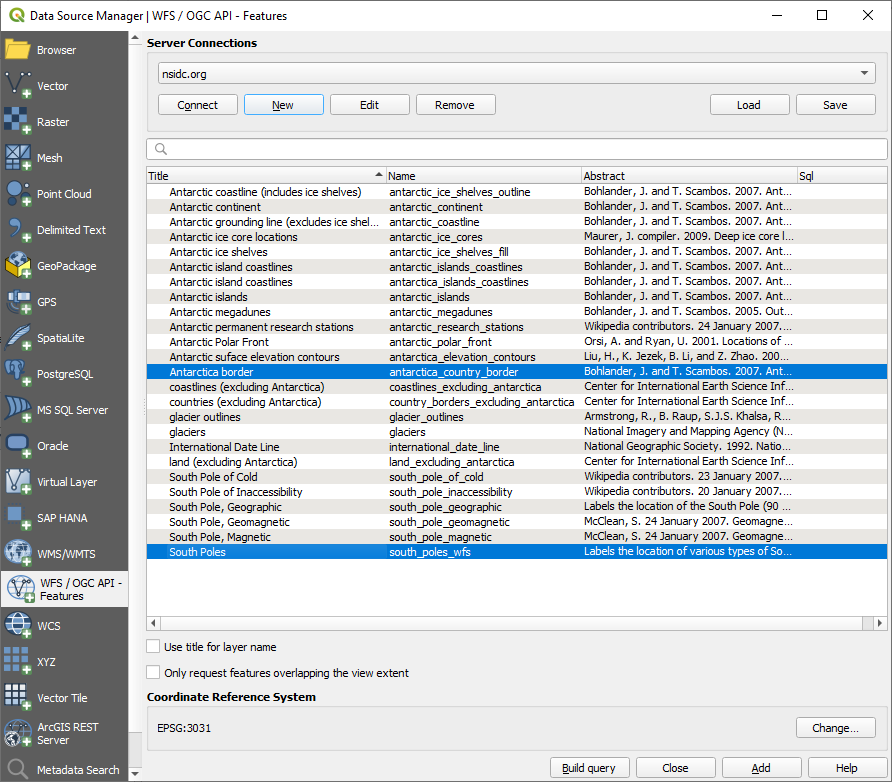
Click Add.
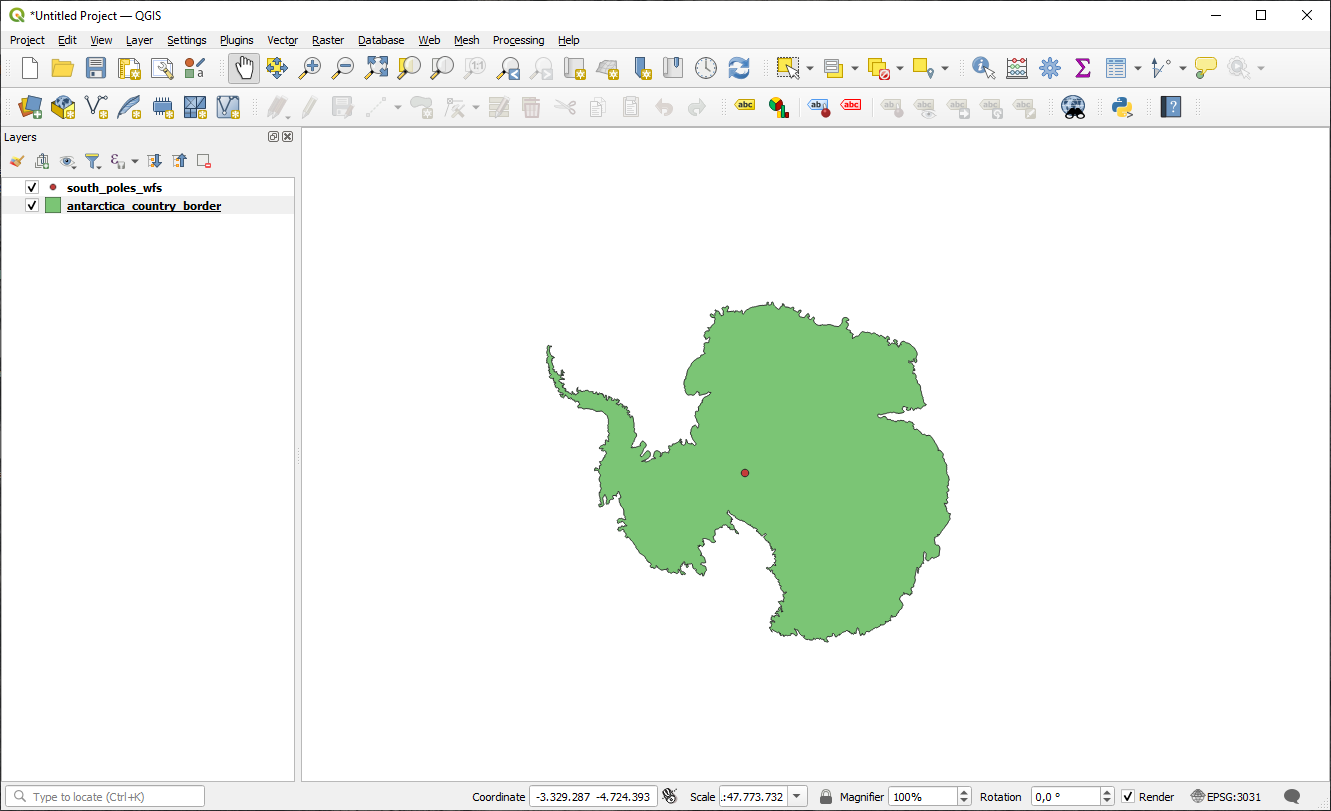
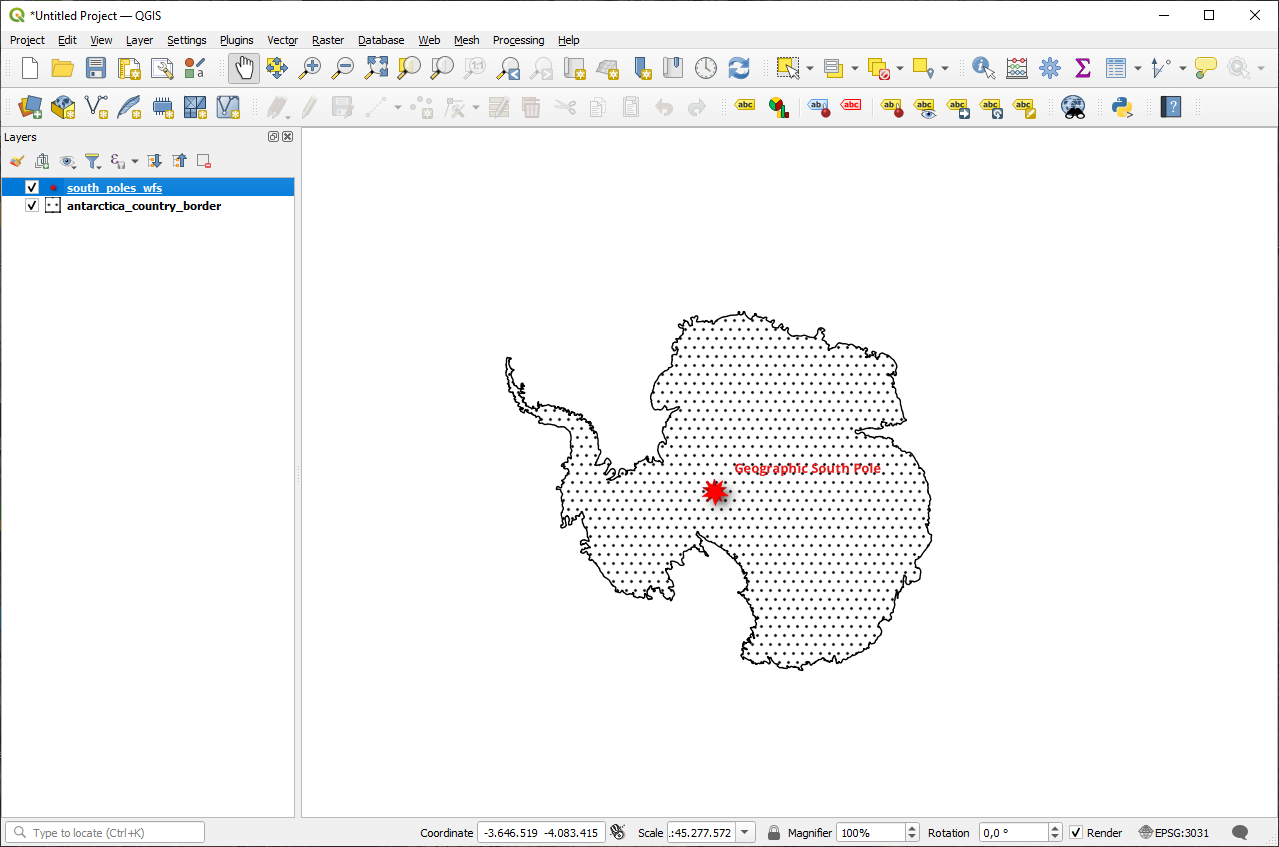
It may take a while to load the layers. When they are loaded, they will appear in the map, showing the outlines of Antarctica and a few points over.
How is this different from having a WMS layer?
Select any of the layers and you’ll notice that feature selection and attribute table tools are enabled. These are vector layers.
Select the
south_poles_wfslayer and open its attribute table. You should see this: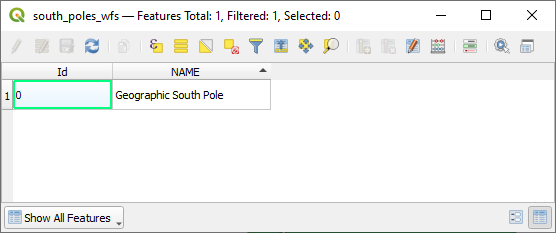
Since the points have attributes, we are able to label them, as well as change their symbology. Here’s an example:
Differences from WMS layers
A Web Feature Service returns the layer itself, not just a map rendered from it. This gives you direct access to the data, meaning that you can change its symbology and run analysis functions on it. However, this is at the cost of much more data being transmitted. This will be especially obvious if the layers you’re loading have complicated shapes, a lot of attributes, or many features; or even if you’re just loading a lot of layers. WFS layers typically take a very long time to load because of this.
10.2.2. ★★☆ Follow Along: Querying a WFS Layer
Although it is of possible to query a WFS layer after having loaded it, it’s often more efficient to query it before you load it. That way, you’re only requesting the features you want, meaning that you use far less bandwidth.
For example, on the WFS server we’re currently using, there is a layer called
countries (excluding Antarctica). Let’s say that we want to know
where South Africa is relative to the south_poles_wfs layer (and
perhaps also the antarctica_country_border layer) that’s already
been loaded.
There are two ways to do this. You can load the whole countries ...
layer, and then build a query as usual once it’s loaded. However, transmitting
the data for all the countries in the world and then only using the data for
South Africa seems a bit wasteful of bandwidth. Depending on your connection,
this dataset can take several minutes to load.
The alternative is to build the query as a filter before even loading the layer from the server.
Enable the WFS / OGC API Features tab in the Data Source Manager dialog
Connect to the server we used before and you should see the list of available layers.
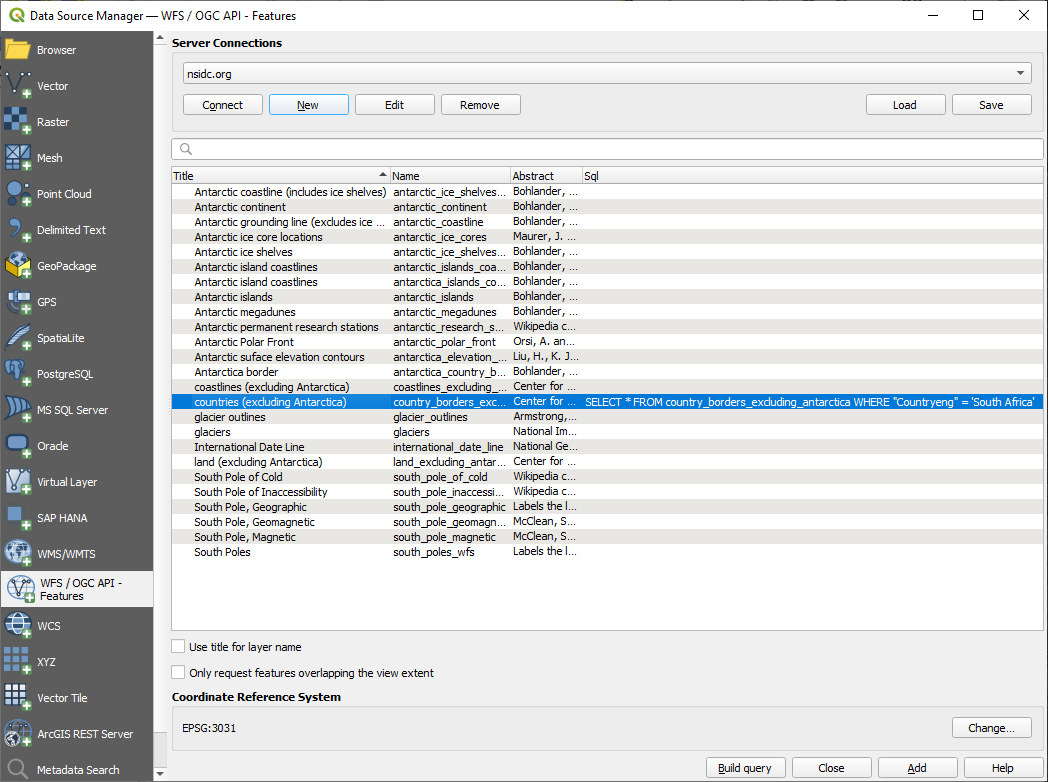
Find and double-click the
countries (excluding Antarctica)layer. The layer name iscountry_borders_excluding_antarctica. You can also select the layer and press Build query button at the bottom of the dialog: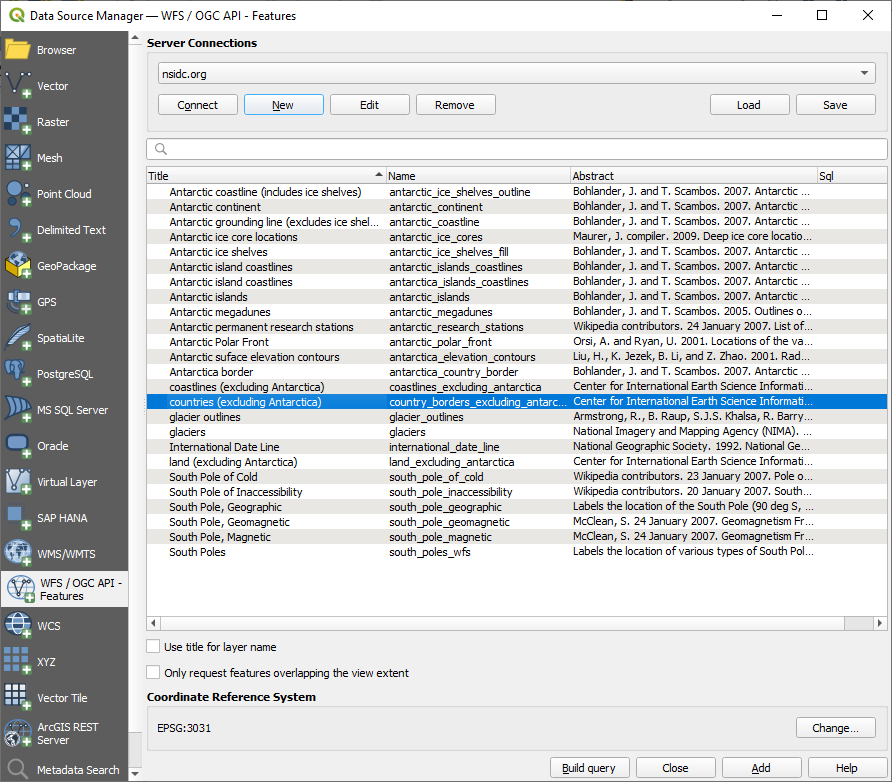
In the dialog that appears, type the following
SELECT * FROM country_borders_excluding_antarctica WHERE "Countryeng" = 'South Africa'query in the SQL Statement box.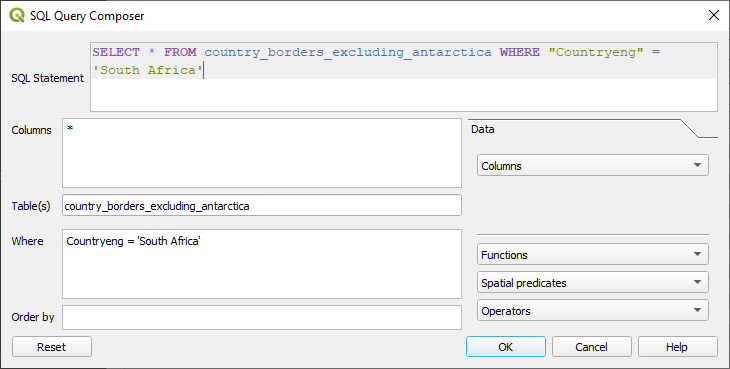
Press OK.
The expression used will appear as the Sql value of the target layer:
Click Add with the layer selected as above. Only the country with the
Countryengvalue ofSouth Africawill load from that layer: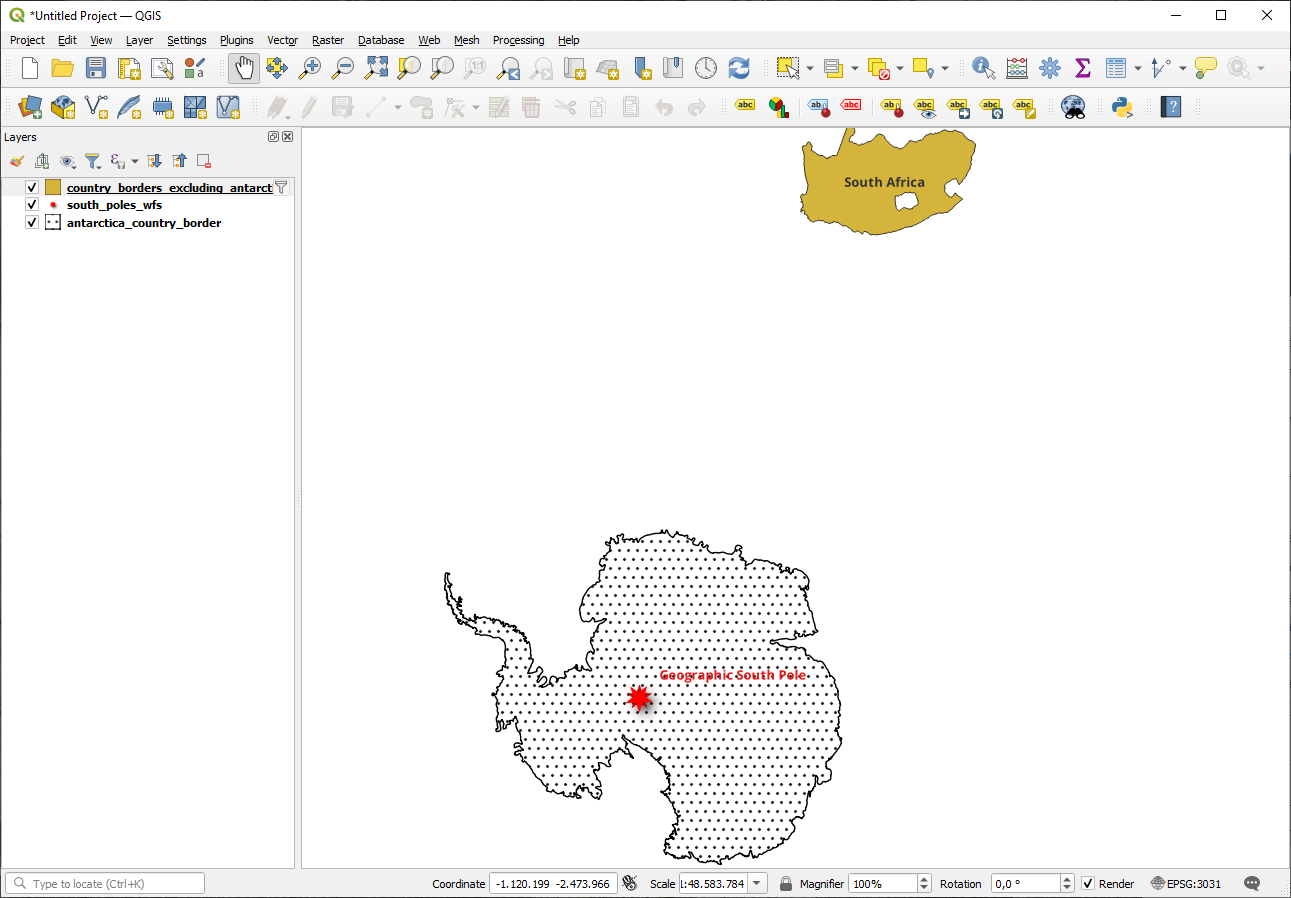
Did you notice the
 icon next to the
country_borders_excluding_antarcticalayer? It indicates that the loaded layer is filtered and does not display in the project all of its features.You don’t have to, but if you tried both methods, you’ll notice that this is a lot faster than loading all the countries before filtering them!
Notes on WFS availability
It is rare to find a WFS hosting features you need, if your needs are very specific. The reason why Web Feature Services are relatively rare is because of the large amounts of data that must be transmitted to describe a whole feature. It is therefore not very cost-effective to host a WFS rather than a WMS, which sends only images.
The most common type of WFS you’ll encounter will therefore probably be on a local network or even on your own computer, rather than on the Internet.
10.2.3. In Conclusion
WFS layers are preferable over WMS layers if you need direct access to the attributes and geometries of the layers. However, considering the amount of data that needs to be downloaded (which leads to speed problems and also a lack of easily available public WFS servers) it’s not always possible to use a WFS instead of a WMS.
10.2.4. What’s Next?
Next, you’ll see how to use QGIS Server to provide OGC services.