Wichtig
Übersetzen ist eine Gemeinschaftsleistung - Sie können mitmachen <https://qgis.org/en/site/getinvolved/translate.html#becoming-a-translator>`_. Diese Seite ist aktuell zu 54.79% übersetzt.
19. Arbeiten mit Vektorkacheln (Vector Tiles)
19.1. Was sind Vektorkacheln?
Bei Vektorkacheln handelt es sich um Pakete mit geographischen Daten, die in vordefinierte ungefähr quadratische „Kacheln“ gepackt wurden, um sie über das Internet zu übertragen. Sie kombinieren vorgerenderte Raster- und Vektorkartenkacheln. Der Vektorkachelserver schickt anstelle eines vorgerenderten Kartenbilds vektorbasierte Kartendaten, die auf die Grenzen der Kacheln zugeschnitten wurden. Die zugeschnittenen Kacheln stellen die Maßstabsebenen des Vektorkacheldienstes dar und werden über einen Pyramidenansatz abgeleitet. Mit dieser Datenstruktur wird die Menge der zu übertragenden Daten gegenüber einem ungekachelten Vektordatensatz verringert. Es müssen nämlich nur die Daten des aktuellen Kartenausschnitts im aktuellen Maßstab übermittelt werden. Gegenüber einem gekachelten Rasterdatensatz wird die Datenübertragungsrate auch erheblich reduziert, weil Vektordaten typischerweise deutlich kleiner als eine Bilddatei sind. Vektorkacheln haben keine Darstellungsinformationen, so dass QGIS einen Darstelllungsstil anwenden muss, um die Daten darzustellen.
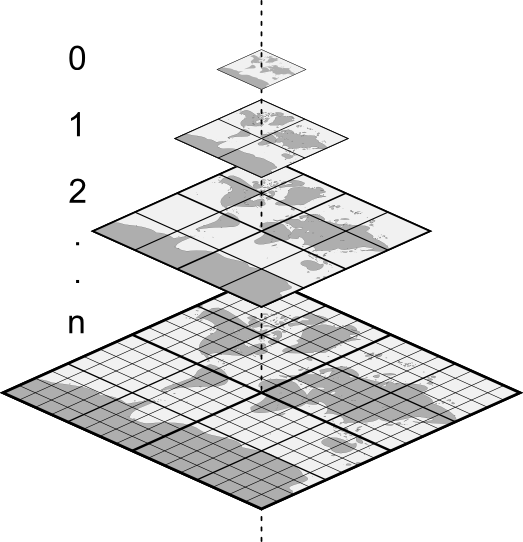
Abb. 19.1 Pyramidenstruktur eines Vektorkacheldatensatzes mit Maßstabsebenen
19.2. Unterstützte Formate
Vektorkacheln werden in folgenden Formaten unterstützt:
entfernte Quellen (HTTP/S) - im XYZ-Muster -
type=xyz&url=http://example.com/{z}/{x}/{y}.pbflokale Dateien - im XYZ-Muster - z.B.
type=xyz&url=file:///path/to/tiles/{z}/{x}/{y}.pbfeine lokale MBTile-Datenbank - z.B.
type=mbtiles&url=file:///path/to/file.mbtiles
Sie laden einen Vektorkacheldatensatz in QGIS über den Tab  Vector Tile im Dialog Datenquellenverwaltung . Lesen Sie Using Vector Tiles services wie Sie dabei im Detail vorgehen.
19.3. Eigenschaften von Vektorkacheldatensätzen
The vector tiles Layer Properties dialog provides the following sections:
|
||
|


[1] Auch im Bedienfeld Layergestalltung verfügbar
19.3.1. Eigenschaften Information
Der Tab Information kann nicht editiert werden und ist ein guter Platz, um schnell zusammengefasste Informationen und Metadaten des aktuellen Layers nachzuschlagen. Hier erhalten Sie folgende Informationen:
auf der Grundlage des Providers des Layers: Name, URI, Typ und Pfad der Datenquelle, Anzahl der Maßstabsebenen
das Koordinatenbezugssystem: Name, Einheiten, Methode, Genauigkeit, Referenz (d.h., ob es statisch oder dynamisch ist)
von dem was bei den Metadaten ausgefüllt wurde: Zugang, Ausdehnung, Links, Kontakt, Protokoll…
19.3.2. Eigenschaften Quelle
The  Source tab displays basic information about
the selected vector tile, including:
Source tab displays basic information about
the selected vector tile, including:
the Layer name to display in the Layers Panel;
the Coordinate Reference System: Displays the layer’s Coordinate Reference System (CRS). You can change the layer’s CRS, by selecting a recently used one in the drop-down list or clicking on the
 Select CRS button (see Coordinate Reference System Selector).
Use this process only if the layer CRS is wrong or not specified.
Select CRS button (see Coordinate Reference System Selector).
Use this process only if the layer CRS is wrong or not specified.
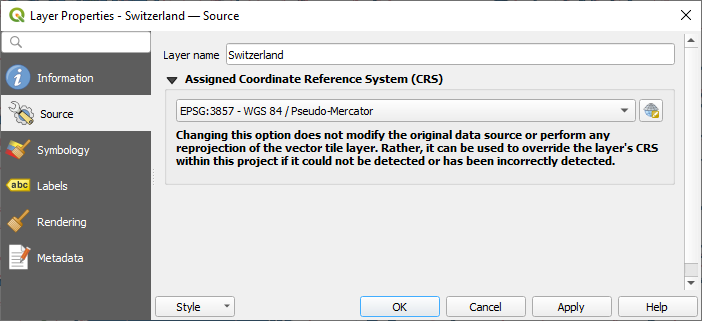
Abb. 19.2 Vector Tiles Properties - Source Dialog
19.3.3. Symbology and Labels Properties
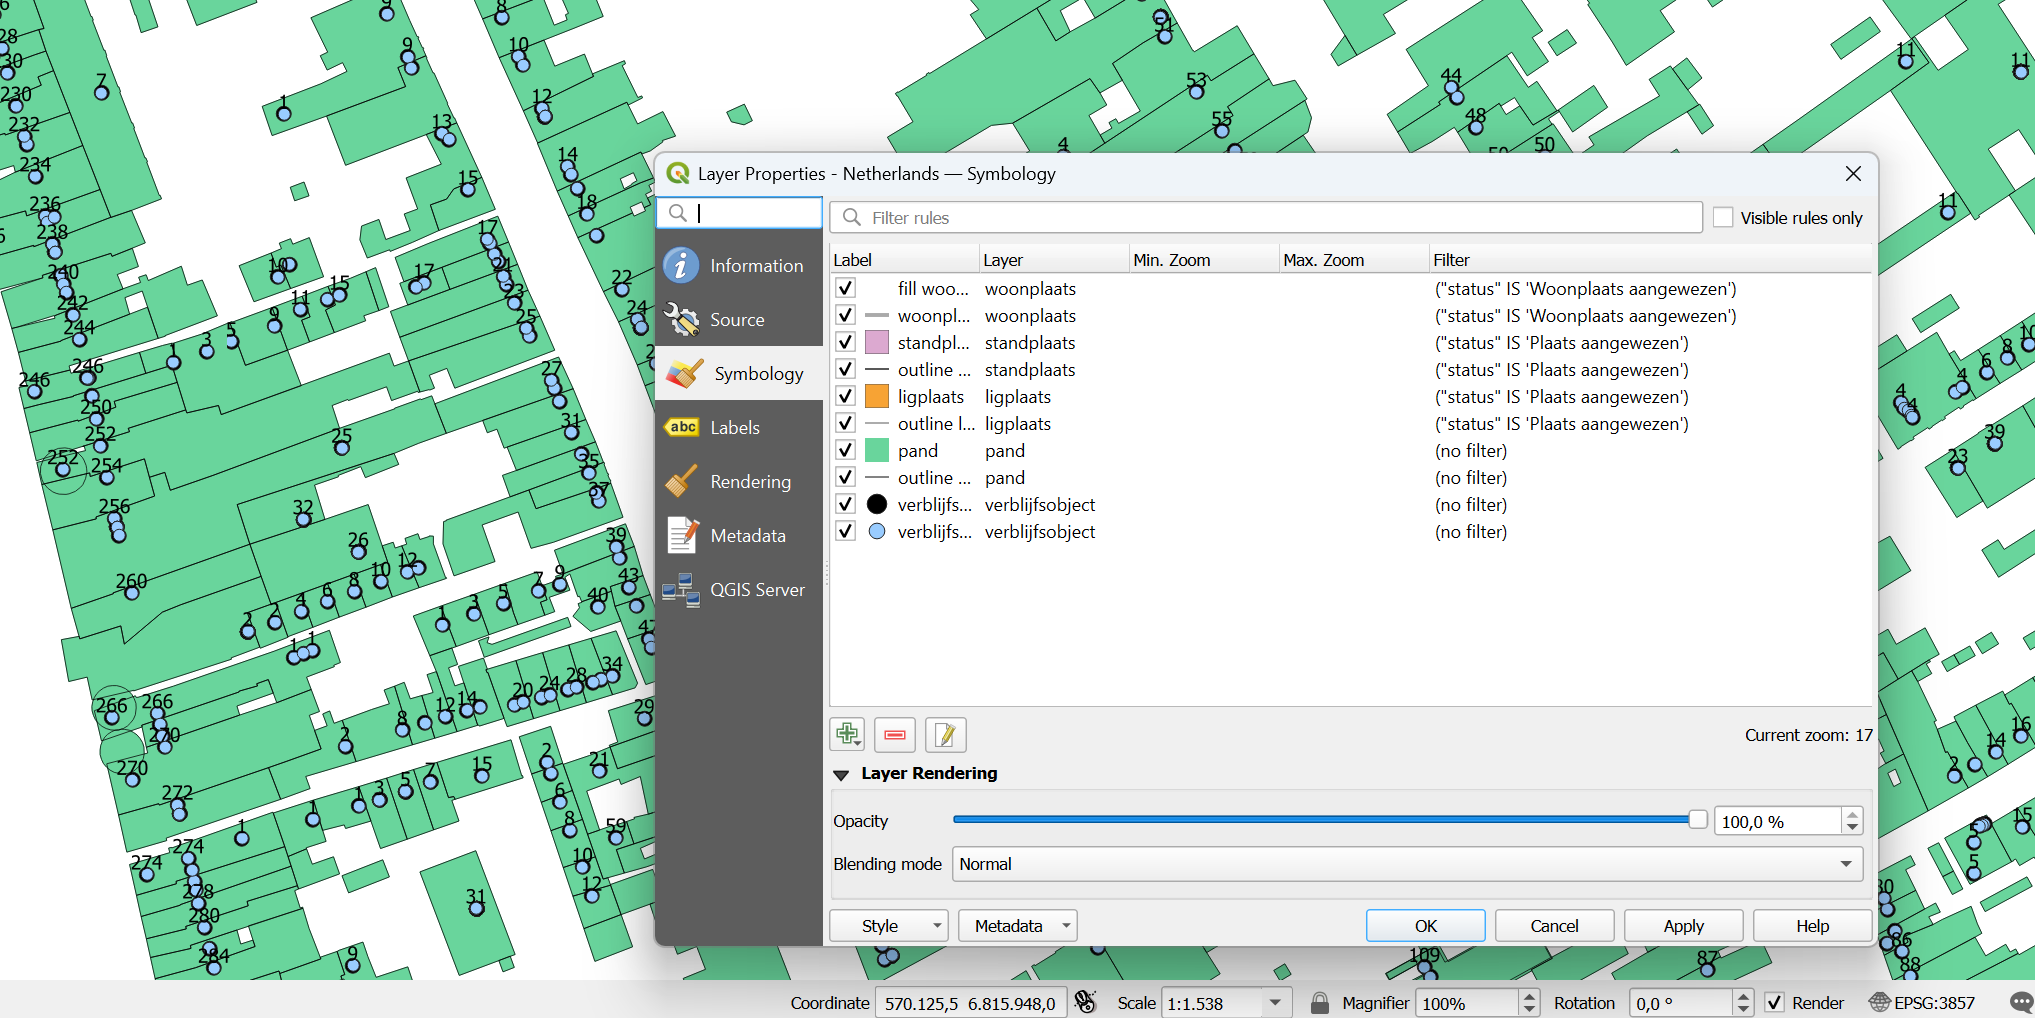
Abb. 19.3 Symbolisierung von Vektorkachellayern
19.3.3.1. Setting rules
As vector tiles consist of point, line and polygon geometries, the respective symbols are available. To apply a cartographic style (with symbology and/or labels), you can either:
Use a Style URL when creating the Vector Tiles Connection. The symbology will be shown immediately in the
 Symbology tab
after the layer is loaded in QGIS.
Symbology tab
after the layer is loaded in QGIS.Or build your own symbology and labeling in the corresponding tabs of the layer properties. By default, QGIS assigns an identical symbol to the features based on their geometry type.
In both cases, setting a style for a vector tile relies on a set of rules applied to the features, indicating:
a Label, a title for comprehensive identification of the rule
the name of a particular Layer the rule should apply to, if not applied to
(all layers)a Min. Zoom and a Max. Zoom, for the range of display. Symbology and labeling can be dependent on the zoom level.
a Filter, a QGIS expression to identify the features to apply the style to
Each rule is added pressing the  Add rule button
and selecting the type of symbols (Marker, Line, Fill)
corresponding to the features geometry type.
You can as well
Add rule button
and selecting the type of symbols (Marker, Line, Fill)
corresponding to the features geometry type.
You can as well  Remove selected rules or
  Edit current rule.
At the bottom the Current Zoom is shown.
Check the  Visible rules only option at the top of the dialog
to filter the list of rules to only those that are visible at the current zoom level.
This makes it easier to work with complex vector styling and to locate troublesome rules.
The
Visible rules only option at the top of the dialog
to filter the list of rules to only those that are visible at the current zoom level.
This makes it easier to work with complex vector styling and to locate troublesome rules.
The  Filter rules text box also helps you easily find a rule,
by searching the Label, Layer and Filter fields.
Filter rules text box also helps you easily find a rule,
by searching the Label, Layer and Filter fields.
In Abb. 19.3 we set up style for the OpenStreetMap landuse layer.
For better visibility most of the rules are deselected.
19.3.3.2. Layerdarstellung
From the Symbology tab, you can also set some options that invariably act on all features of the layer:
Opacity: You can make the underlying layer in the map canvas visible with this tool. Use the slider to adapt the visibility of your vector layer to your needs. You can also make a precise definition of the percentage of visibility in the menu beside the slider.
Blending mode: You can achieve special rendering effects with these tools that you may previously only know from graphics programs. The pixels of your overlaying and underlaying layers are mixed through the settings described in Mischmodi.
19.3.3.3. Styles
Available at the bottom of most of the tabs, the menu provides shortcuts to save, load, create, switch styles to apply to the vector tiles. Vector tiles can have their style saved from QGIS as QML files and they can be imported as:
QML Dateien (QML - Das QGIS-Stil-Dateiformat)
MapBox GL Json Stildateien
More details at Save and Share Layer Properties.
19.3.4. Eigenschaften Darstellung
Under Scale dependent visibility,
you can set the Maximum (inclusive)
and Minimum (exclusive) scales,
defining a range of scales in which features will be visible.
Out of this range, they are hidden.
The  Set to current canvas scale button helps you
use the current map canvas scale as boundary of the range visibility.
See Visibility Scale Selector for more information.
Set to current canvas scale button helps you
use the current map canvas scale as boundary of the range visibility.
See Visibility Scale Selector for more information.
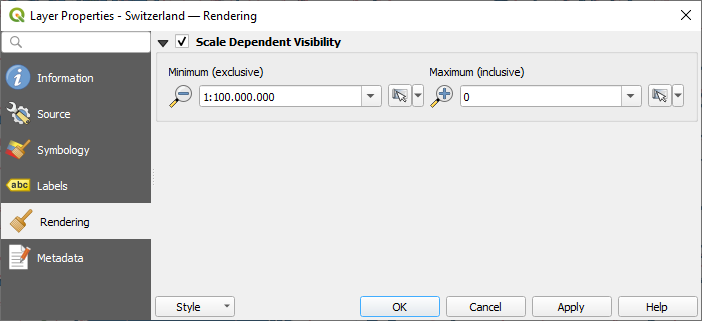
Abb. 19.4 Vector Tiles Properties - Rendering Dialog
19.3.5. Eigenschaften Metadaten
Der Tab  Metadaten ermöglicht es Ihnen, Metadaten für Ihren Layer zu erstellen oder zu editieren. Siehe Metadata für weitere Informationen.