18.13. HTML outputs
Примечание
In this lesson we learn how QGIS handles outputs in HTML format, which are used to produce text outputs and graphs.
All the outputs we have produced so far were layers (whether raster or vector). However, some algorithms generate outputs in the form of text and graphics. All this outputs are wrapped in HTML files and displayed in the so–called Results viewer, which is another element of the processing framework.
Let’s see one of those algorithms to understand how they work.
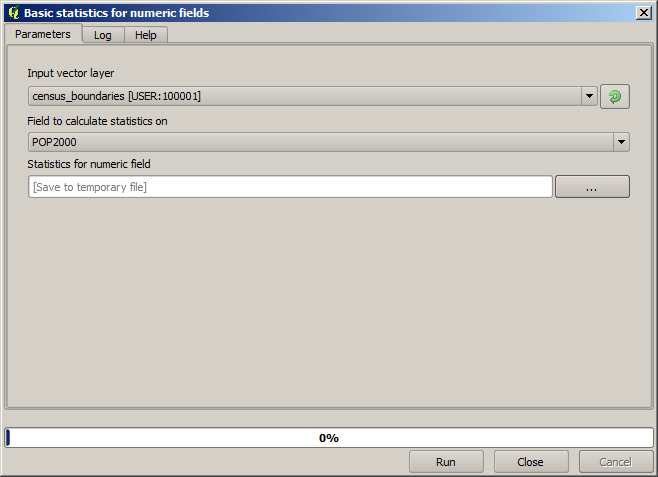
Open the project with the data to be used in this lesson and then open the Basic statistics for numeric fields algorithm.

The algorithm is rather simple, and you just have to select the layer to use and one of its field (a numeric one). The output is of type HTML, but the corresponding box works exactly like the one that you can find in the case of a raster or vector output. You can enter a filepath or leave it blank to save to a temporary file. In this case, however, only the html and htm extensions are allowed, so there is no way of altering the output format by using a different one.
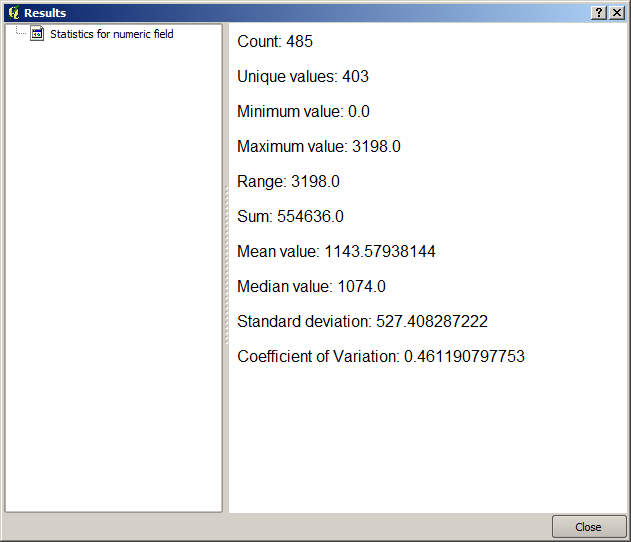
Run the algorithm selecting the only layer in the project as input, and the POP2000 field, and a new dialog like the one shown next will appear once the algorithm is executed and the parameters dialog is closed.

This is the Results viewer. It keeps all the HTML result generated during the current session, easily accessible, so you can check them quickly whenever you need it. As it happens with layers, if you have saved the output to a temporary file, it will be deleted once you close QGIS. If you have saved to a non-temporary path, the file will remain, but it will not appear in the Results viewer the next time you open QGIS.
Some algorithms generate text that cannot be divided into other more detailed outputs. That is the case if, for instance, the algorithm captures the text output from an external process. In other cases, the output is presented as text, but internally is divided into several smaller outputs, usually in the form of numeric values. The algorithm that we have just executed is one of them. Each one of those values is handled as a single output, and stored in a variable. This has no importance at all now, but once we move to the graphical modeler, you will see that it will allow us to use those values as numeric inputs for other algorithms.