13.2. Lesson: GRASS Tools
In this lesson we will present a selection of tools to give you an idea of the capabilities of GRASS.
13.2.1.  Follow Along: Set Raster Colors
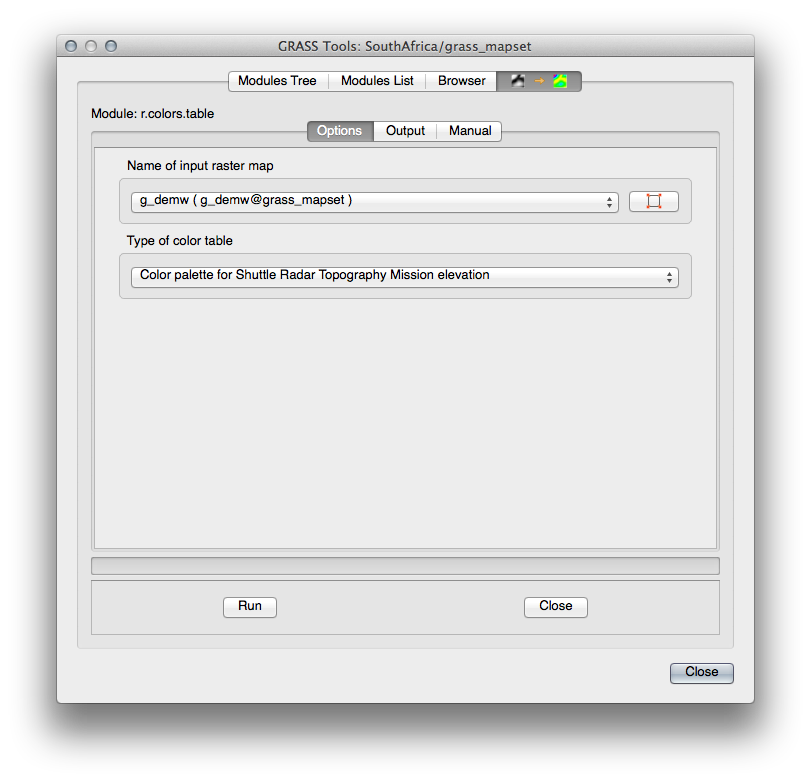
Open the GRASS Tools dialog.
Look for the r.colors.table module by searching for it in the Filter field of the Modules List tab.
Open the tool and set it up like this:
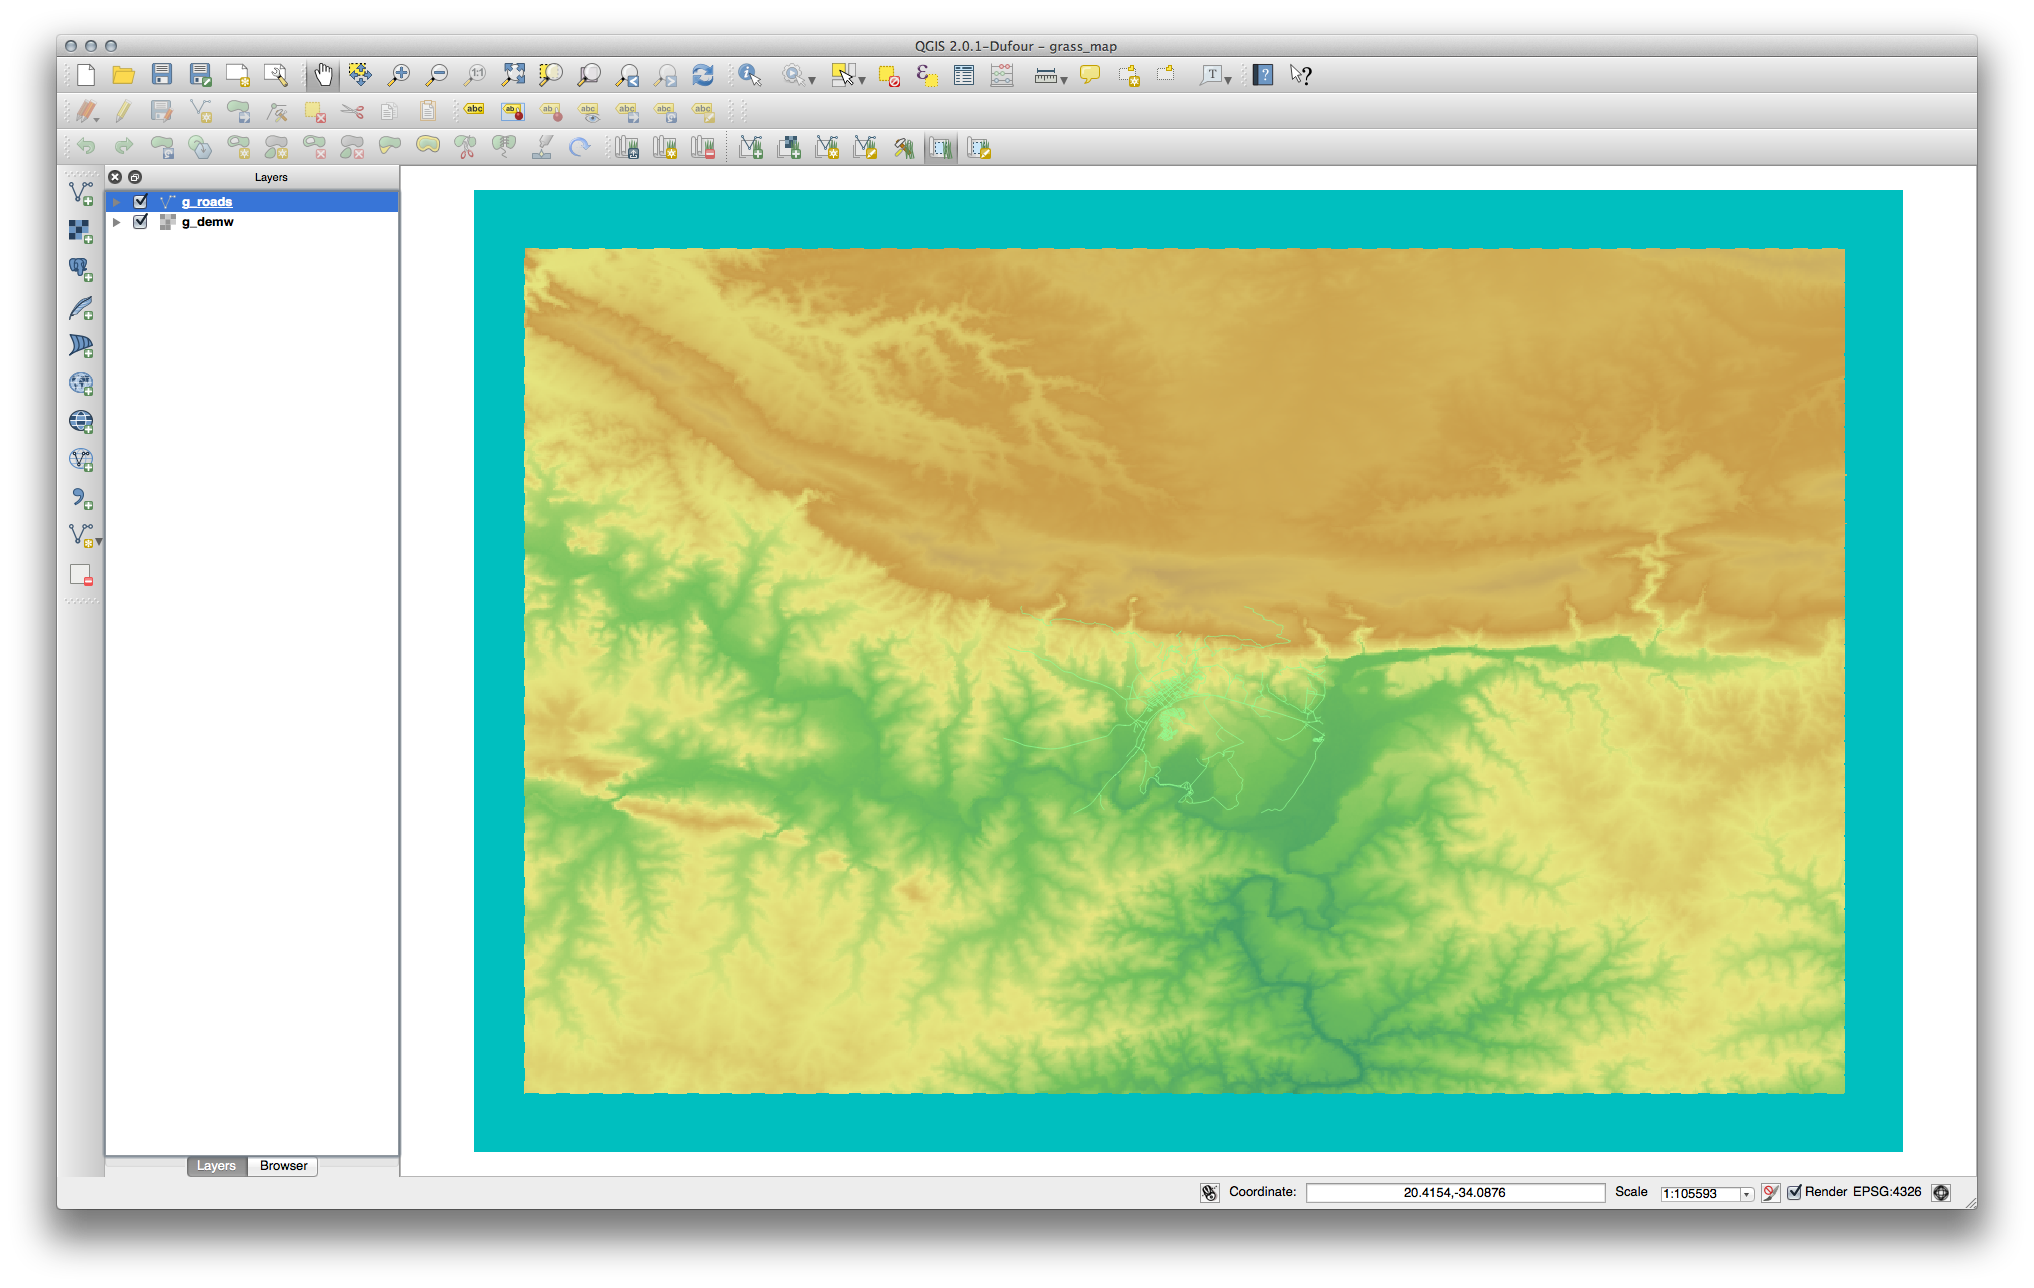
When you run the tool, it will recolor your raster:
13.2.2. Follow Along: Visualize Data in 3D
GRASS allows you to use a DEM to visualize your data in three dimensions. The tool you’ll use for this operates on the GRASS Region, which at the moment is set to the whole extent of South Africa, as you set it up before.
To redefine the extent to cover only our raster dataset, click this button:

When this tool is activated, your cursor will turn into a cross when over the QGIS map canvas.
Using this tool, click and drag a rectangle around the edges of the GRASS raster.
Click OK in the GRASS Region Settings dialog when done.
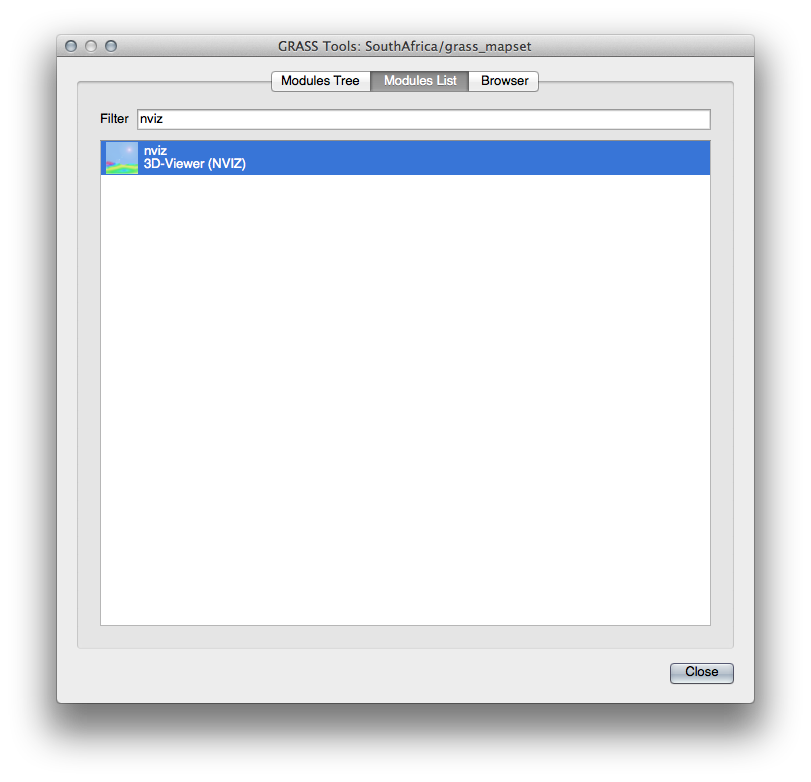
Search for the nviz tool:
Set it up as shown:
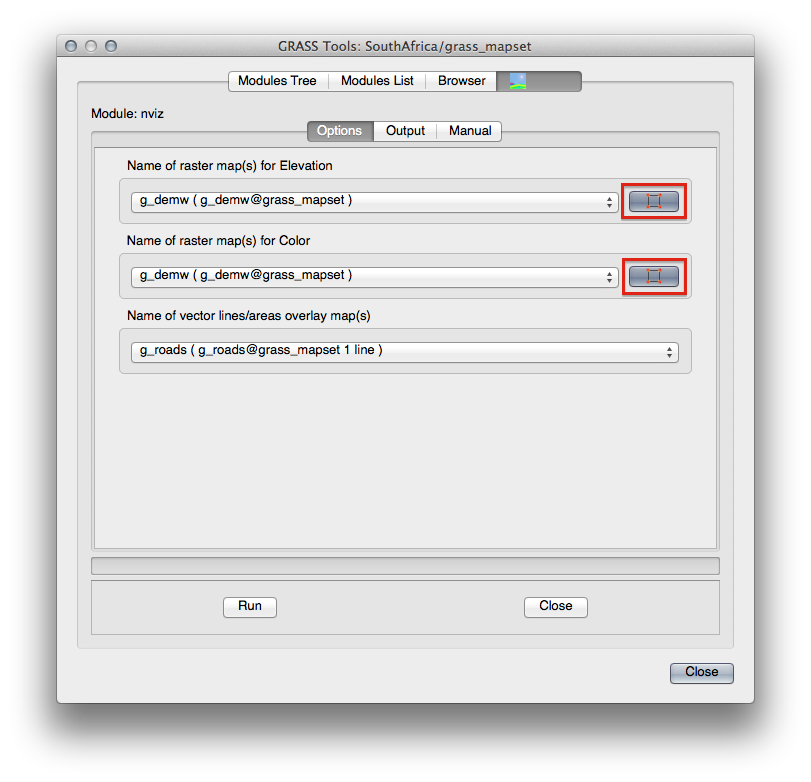
Remember to enable both Use region of this map buttons to the right of the two raster selection dropdown menus. This will allow NVIZ to correctly assess the resolution of the rasters.
Click the Run button.
NVIZ will set up a 3D environment using the raster and vector selected. This may take some time, depending on your hardware. When it’s done, you will see the map rendered in 3D in a new window:
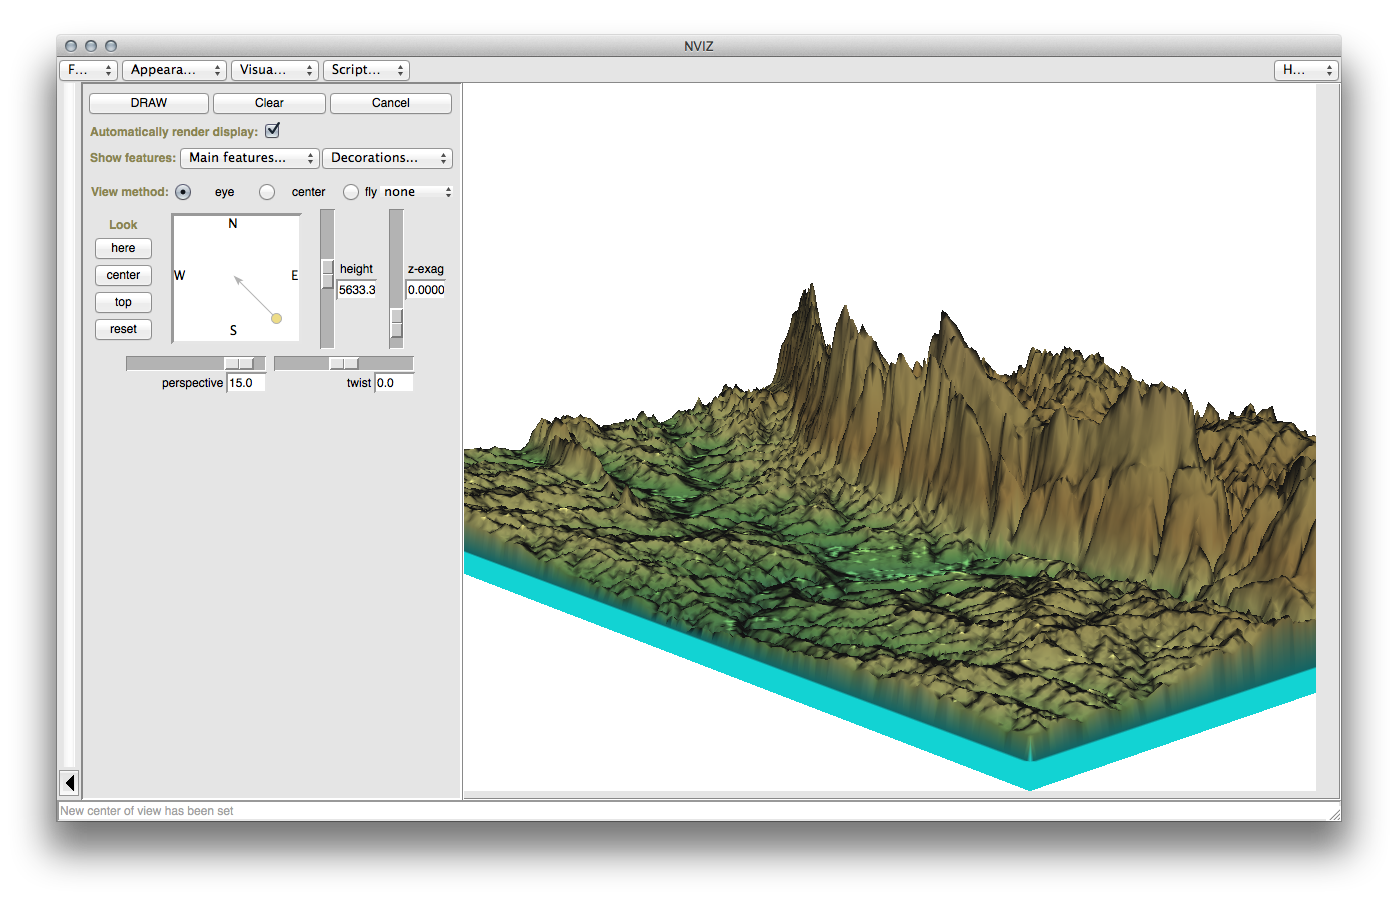
Experiment with the height, z-exag, and View method settings to change your view of the data. The navigation methods may take some getting used to.
After experimenting, close the NVIZ window.
13.2.3.  Follow Along: The Mapcalc Tool
- Open the GRASS Tools dialog’s Modules List tab and search for calc.
- From the list of modules, select r.mapcalc (not r.mapcalculator, which is more basic).
- Start the tool.
The Mapcalc dialog allows you to construct a sequence of analyses to be performed on a raster, or collection of rasters. You will use these tools to do so:
In order, they are:
- Add map: Add a raster file from your current GRASS mapset.
- Add constant value: Add a constant value to be used in functions.
- Add operator or function: Add an operator or function to be connected to inputs and outputs.
- Add connection: Connect elements. Using this tool, click and drag from the red dot on one item to the red dot on another item. Dots that are correctly connected to a connector line will turn gray. If the line or dot is red, it is not properly connected!
- Select item: Select an item and move selected items.
- Delete selected item: Removes the selected item from the current mapcalc sheet, but not from the mapset (if it is an existing raster).
Using these tools:
Construct the following algorithm:
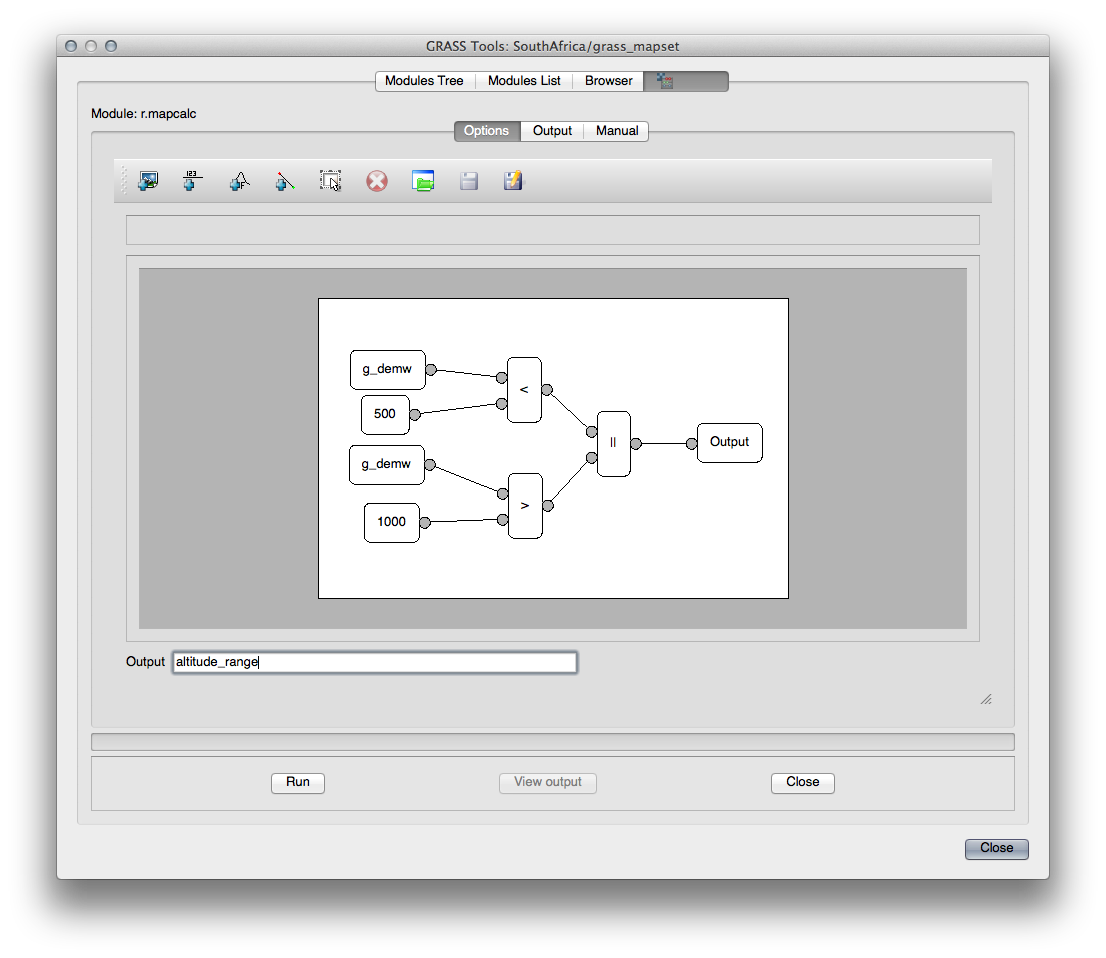
When you click Run, your output should look like this:
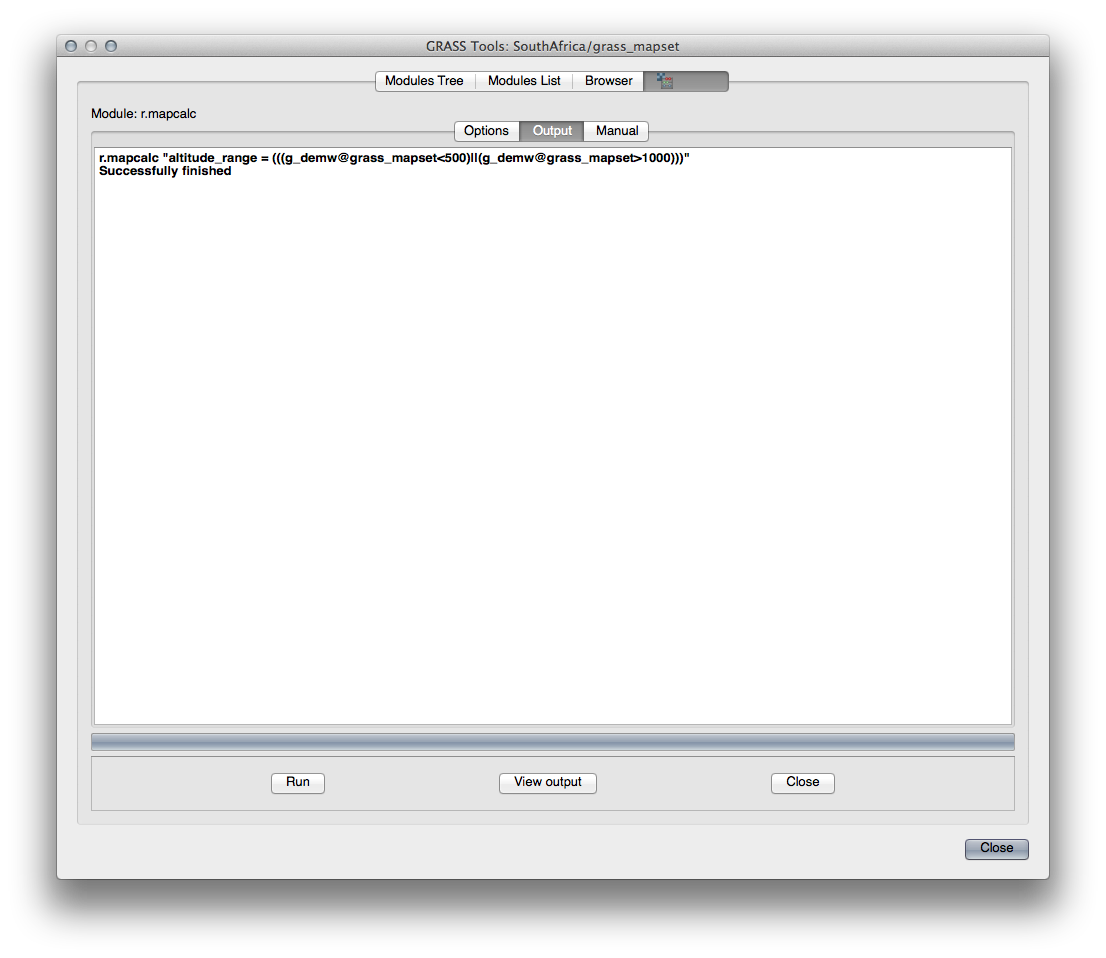
Click View output to see the output displayed in your map:
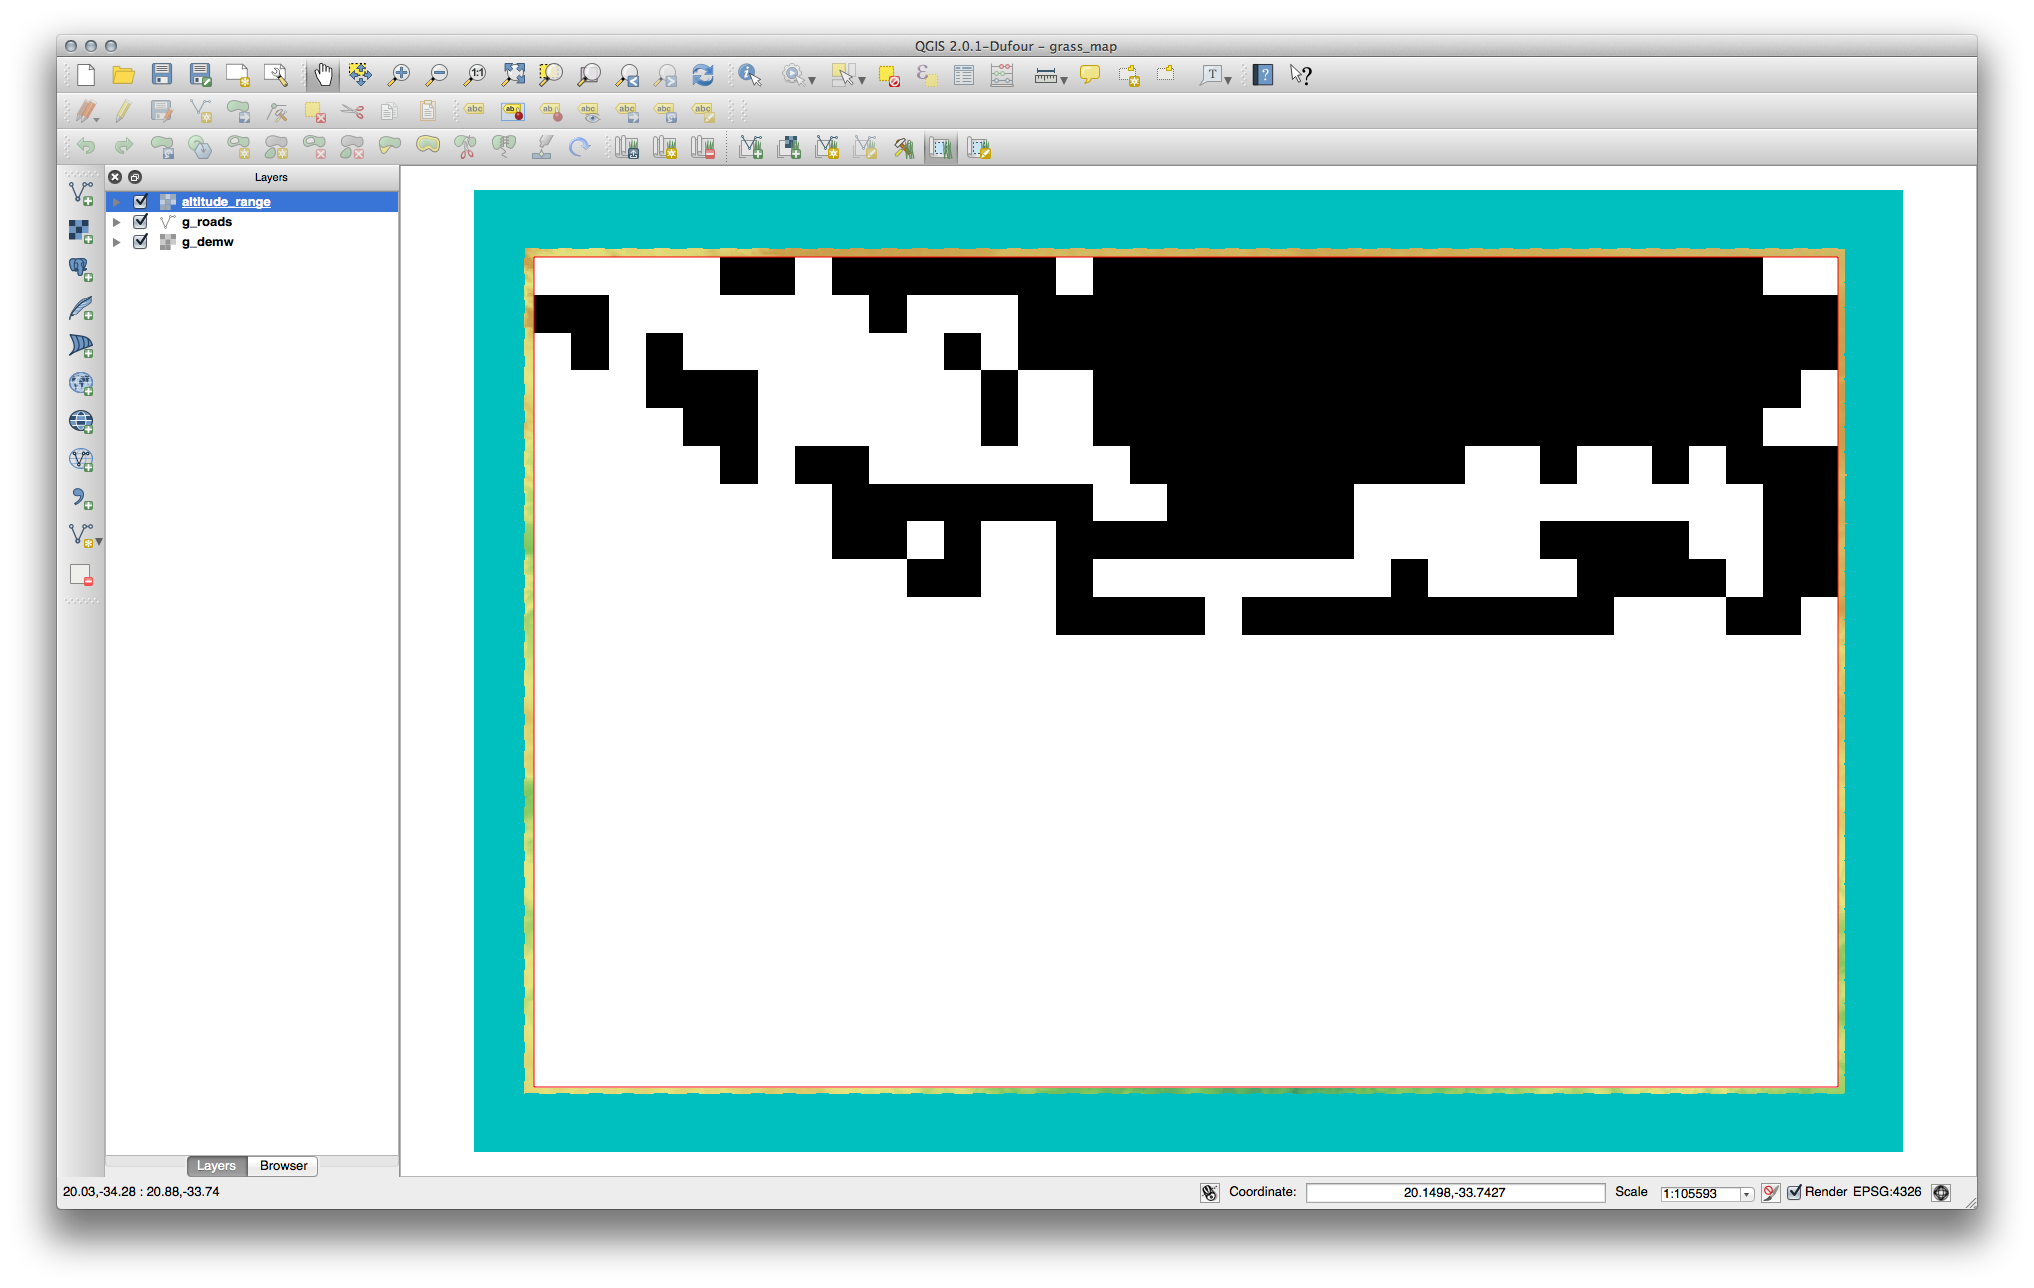
This shows all the areas where the terrain is lower than 500 meters or higher than 1000 meters.
13.2.4. In Conclusion
In this lesson, we have covered only a few of the many tools GRASS offers. To explore the capabilities of GRASS for yourself, open the GRASS Tools dialog and scroll down the Modules List. Or for a more structured approach, look under the Modules Tree tab, which organizes tools by type.