15.8. Lesson: LiDAR 데이터로 DEM 생성
다른 배경 이미지를 이용해서 맵의 외관을 향상시킬 수 있습니다. 기본 맵이나 이전에 사용했던 항공사진을 쓸 수도 있지만, 어떤 상황에서는 해당 지형의 음영기복도 래스터가 나을 수도 있습니다.
LAStools 를 이용해서 LiDAR 데이터셋으로부터 DEM을 추출한 다음, 맵 프리젠테이션에 사용할 음영기복도 래스터를 생성할 것입니다.
이 강의의 목표: LAStools를 설치하고 LiDAR 데이터로부터 DEM을 추출한 다음 음영기복도 래스터를 계산하기.
15.8.1.  Follow Along: LAStools 설치
Managing LiDAR data within QGIS is possible using the Processing framework and the algorithms provided by LAStools.
LiDAR 포인트 클라우드로부터 디지털 표고 모델(DEM)을 얻어 프리젠테이션을 위해 시각적으로 좀 더 직관적인 음영기복도 래스터를 생성할 수 있습니다. 먼저 LAStools를 제대로 다루기 위한 Processing 프레임워크를 설정해야 합니다.
QGIS가 실행되고 있다면 QGIS를 종료하십시오.
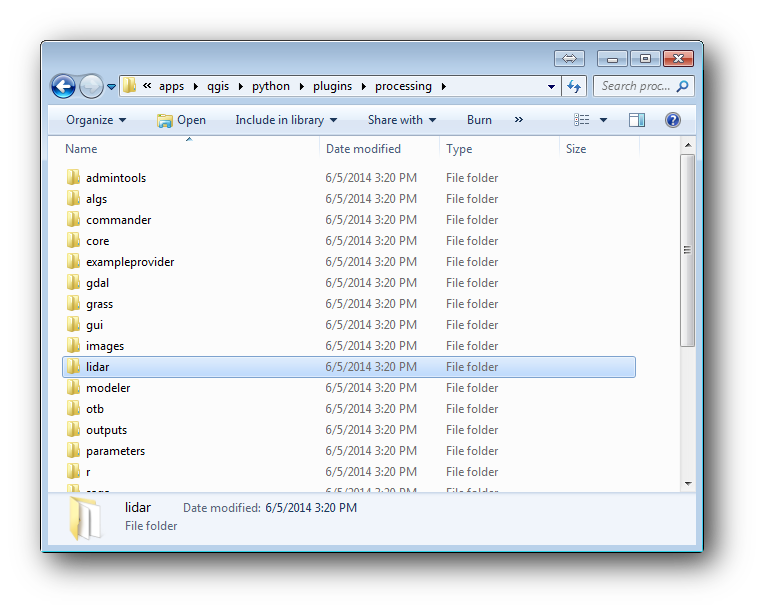
여러분의 시스템의 C:/Program Files/QGIS Valmiera/apps/qgis/python/plugins/processing/ 폴더에 LiDAR 플러그인의 이전 버전이 기본 설치되어 있을 수도 있습니다.
lidar 라는 이름의 폴더가 있다면 삭제하십시오. QGIS 2.2 및 2.4 버전 설치본에서 사용되는 폴더입니다.
- Go to the exercise_data\forestry\lidar\ folder, there you can find the file QGIS_2_2_toolbox.zip. Open it and extract the lidar folder to replace the one you just deleted.
- If you are using a different QGIS version, you can see more installation instructions in this tutorial.
Now you need to install the LAStools to your computer. Get the newest lastools version here and extract the content of the lastools.zip file into a folder in your system, for example, c:\lastools\. The path to the lastools folder cannot have spaces or special characters.
주석
lastools 폴더 안에 있는 LICENSE.txt 파일을 읽어보십시오. LAStools의 일부만이 오픈소스이며 나머지 부분은 클로즈드소스(closed source)로 대부분의 상업, 공공 목적 사용에는 라이선스가 필요합니다. 교육 및 평가 목적 사용이라면 여러분이 필요한 만큼 LAStools를 사용 및 테스트해볼 수 있습니다.
이제 플러그인 및 실제 알고리듬들을 여러분의 컴퓨터에 설치해서 사용할 준비가 거의 끝났습니다. 이 플러그인 및 실제 알고리듬들을 사용하려면 공간처리 프레임워크를 설정하기만 하면 됩니다.
QGIS를 실행해서 새 프로젝트를 여십시오.
프로젝트의 좌표계를 ETRS89 / ETRS-TM35FIN 으로 설정하십시오.
이 프로젝트를 forest_lidar.qgs 라는 이름으로 저장하십시오.
QGIS에서 LAStools를 설정해봅시다.
메뉴의 Processing ‣ Options and configuration 항목을 선택합니다.
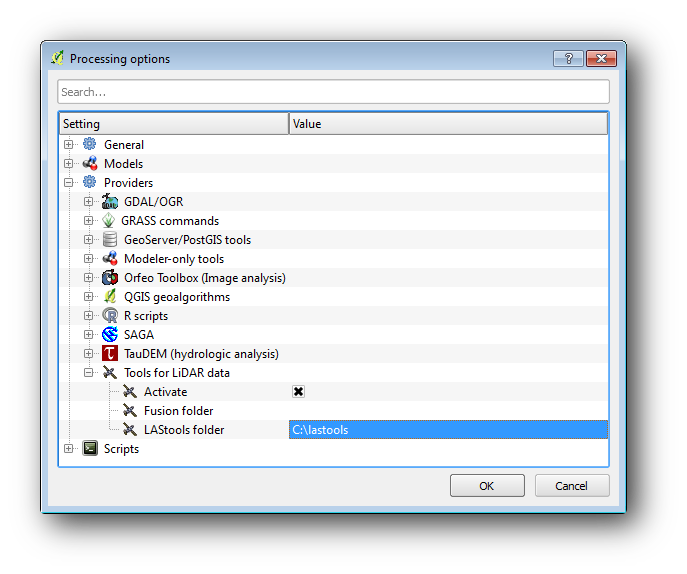
Processing options 대화 창에서 Providers 를 선택한 다음 Tools for LiDAR data 를 선택하십시오.
Activate 체크박스를 체크합니다.
LAStools folder 를 c:\lastools\ (또는 여러분이 LAStools를 압축 해제한 폴더)로 설정하십시오.
15.8.2. Follow Along: LAStools로 DEM 계산
여러분은 Lesson: 공간 통계 강의에서 몇몇 SAGA 알고리듬을 실행하기 위해 Processing 툴박스를 사용해본 경험이 있습니다. 이제 이 툴박스를 이용해서 LAStools 프로그램을 실행해봅시다.
메뉴에서 Processing ‣ Toolbox 를 클릭하십시오.
맨 아래의 드롭다운 메뉴에서 Advanced interface 를 선택하십시오.
Tools for LiDAR data 카테고리를 볼 수 있을 겁니다.
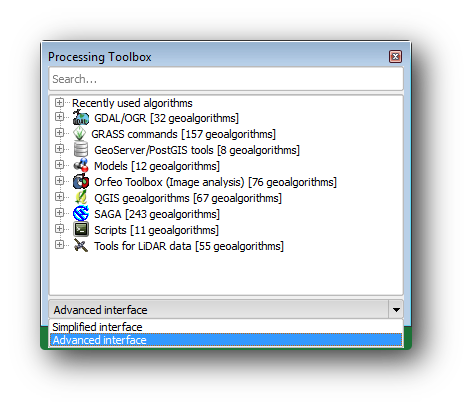
사용할 수 있는 도구가 보이도록 확장한 다음, LAStools 카테고리(알고리듬의 수는 변할 수 있습니다)도 확장하십시오.
lasview 알고리듬이 보일 때까지 스크롤한 뒤, 해당 알고리듬을 더블클릭하십시오.
- At Input LAS/LAZ file, browse to exercise_data\forestry\lidar\ and select the rautjarvi_lidar.laz file.
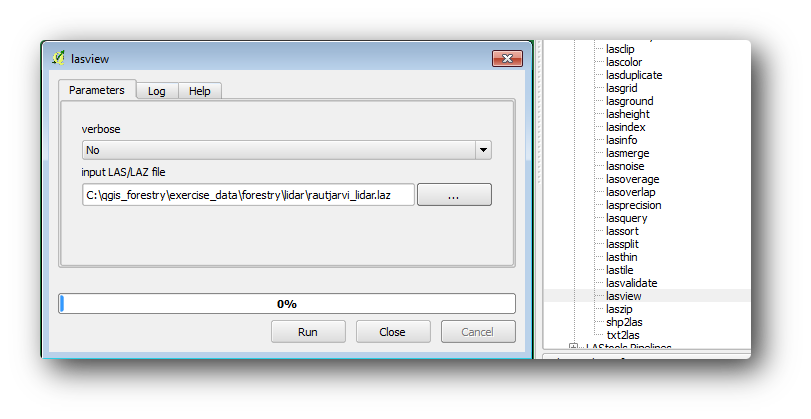
Run 을 클릭합니다.
이제 just a little LAS and LAZ viewer 대화 창에서 LiDAR 데이터를 볼 수 있습니다.
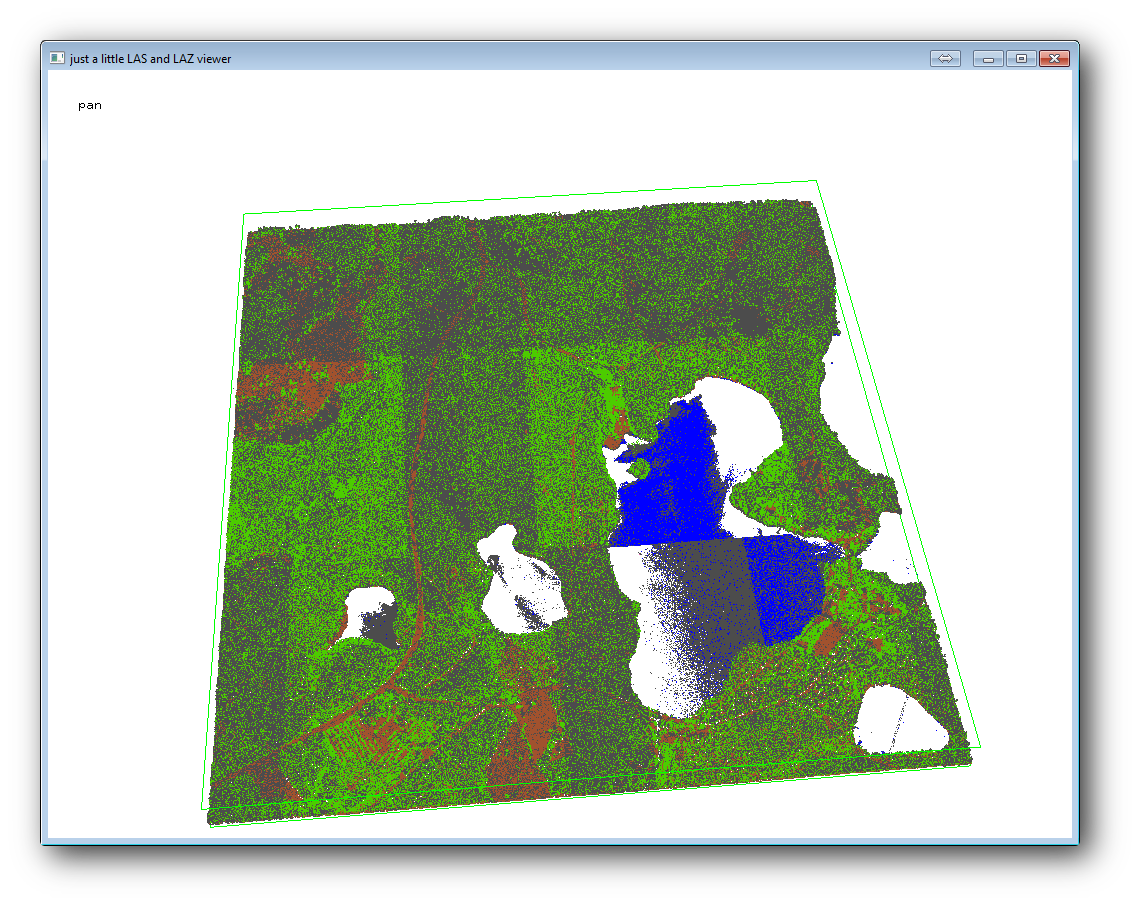
이 뷰어 안에서 할 수 있는 작업은 많지만, 지금은 뷰어 상에서 LiDAR 데이터 클라우드를 클릭&드래그해서 이동시키면서 어떻게 이루어져 있는지 살펴보십시오.
주석
If you want to know further details on how the LAStools work, you can read the README text files about each of the tools, in the C:\lastools\bin\ folder. Tutorials and other materials are available at the Rapidlasso webpage.
준비가 끝나면 뷰어를 닫으십시오.
LAStools로 DEM을 생성하는 작업은 두 단계로 이루어집니다. 먼저 포인트 클라우드를 ground 와 no ground 포인트로 분류한 다음, ground 포인트만으로 DEM을 생성하는 것입니다.
다시 Processing Toolbox 로 이동합니다.
Search... 란을 찾아 lasground 라고 입력하십시오.
더블클릭해서 lasground 도구를 열고 다음 그림처럼 설정하십시오.
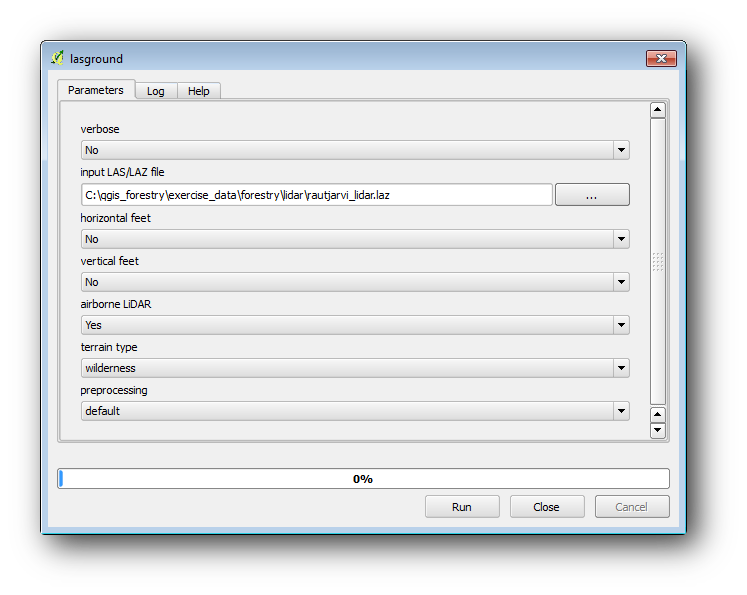
- The output file is saved to the same folder where the rautjarvi_lidar.laz is located and it is named rautjarvi_lidar_1.las.
산출물을 확인하고 싶을 경우 lasview 로 열어볼 수 있습니다.
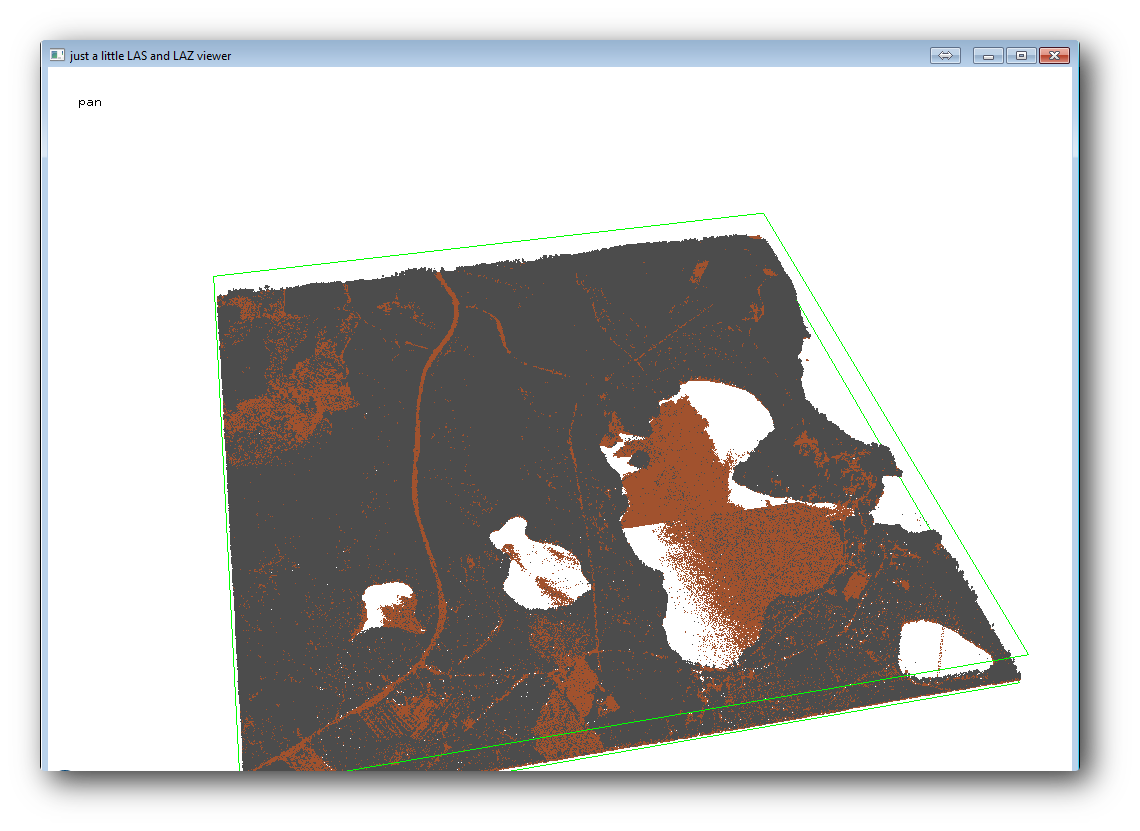
The brown points are the points classified as ground and the gray ones are the rest, you can click the letter g to visualize only the ground points or the letter u to see only the unclassified points. Click the letter a to see all the points again. Check the lasview_README.txt file for more commands. If you are interested, also this tutorial about editing LiDAR points manually will show you different operations within the viewer.
다시 뷰어를 닫으십시오.
Processing Toolbox 에서 las2dem 을 검색하십시오.
las2dem 도구를 실행한 다음 다음 그림처럼 설정하십시오.

산출된 DEM이 기본 명칭 Output raster file 로 맵에 추가됩니다.
주석
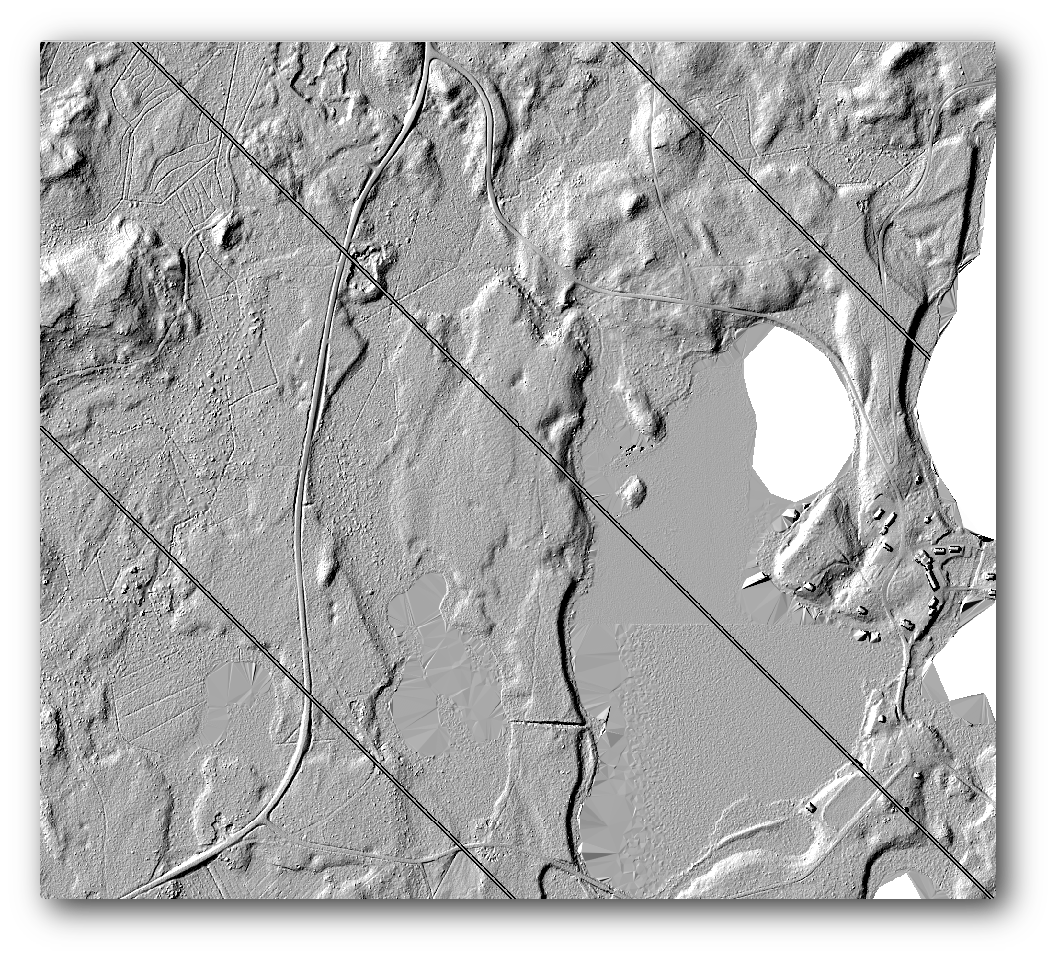
lasground 와 las2dem 도구에는 라이선스가 필요합니다. 라이선스 파일에 나와 있는 대로 라이선스 없이 도구를 사용할 수도 있지만, 산출된 이미지에 사선이 표출될 것입니다.
15.8.3. Follow Along: 지형 음영기복도 생성
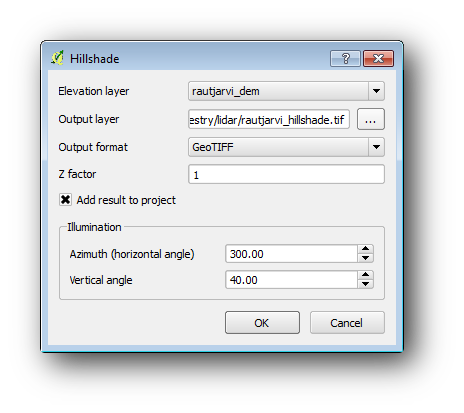
For visualization purposes, a hillshade generated from a DEM gives a better visualization of the terrain:
메뉴에서 Raster ‣ Terrain analysis ‣ Hillshade 를 클릭하십시오.
- As the Output layer, browse to exercise_data\forestry\lidar\ and name the file hillshade.tif.
나머지 파라미터는 기본 설정대로 내버려둡니다.
CRS 대화 창이 뜨면 ETRS89 / ETRS-TM35FIN 좌표계를 선택합니다.
래스터 산출물에 여전히 사선이 보이긴 하지만, 해당 지역의 정확한 기복을 뚜렷이 볼 수 있습니다. 심지어 삼림 내부에 패인 여러 토양 배수로(soil drain)도 볼 수 있을 겁니다.
15.8.4. In Conclusion
Using LiDAR data to get a DEM, specially in forested areas, gives good results with not much effort. You could also use ready LiDAR derived DEMs or other sources like the SRTM 9m resolution DEMs. Either way, you can use them to create a hillshade raster to use in your map presentations.
15.8.5. What’s Next?
마지막 강의에서는, 음영기복도 래스터와 삼림 목록화 작업 결과를 이용해서 결과물의 맵 프리젠테이션을 생성할 것입니다.