11.1. Lesson: Web Mapping Services
Un Web Mapping Service (WMS) è un servizio ospitato su un server remoto. Simile a un sito Web, è possibile accedervi se si dispone di una connessione al server. Con QGIS, è possibile caricare un WMS direttamente nella vostra mappa.
Nell’esercitazione sui plugin è stata spiegata come caricare una nuova immagine raster da Google. Tuttavia, questa è una operazione una tantum: una volta scaricata l’immagine, non ci saranno eventuali aggiornamenti futuri. Il caso del WMS è diverso in quanto si tratta di un servizio in tempo reale, che si aggiorna automaticamente.
Lo scopo di questa esercitazione Come usare un WMS e i suoi limiti.
11.1.1.  Follow Along: Caricare un raster WMS
In questo esercizio, puoi utilizzare la mappa di base che hai fatto all’inizio del corso, o fare una nuova mappa e caricare alcuni vettori. In questo esempio, abbiamo creato una nuova mappa e caricato i vettori places e landuse e impostata la simbologia:
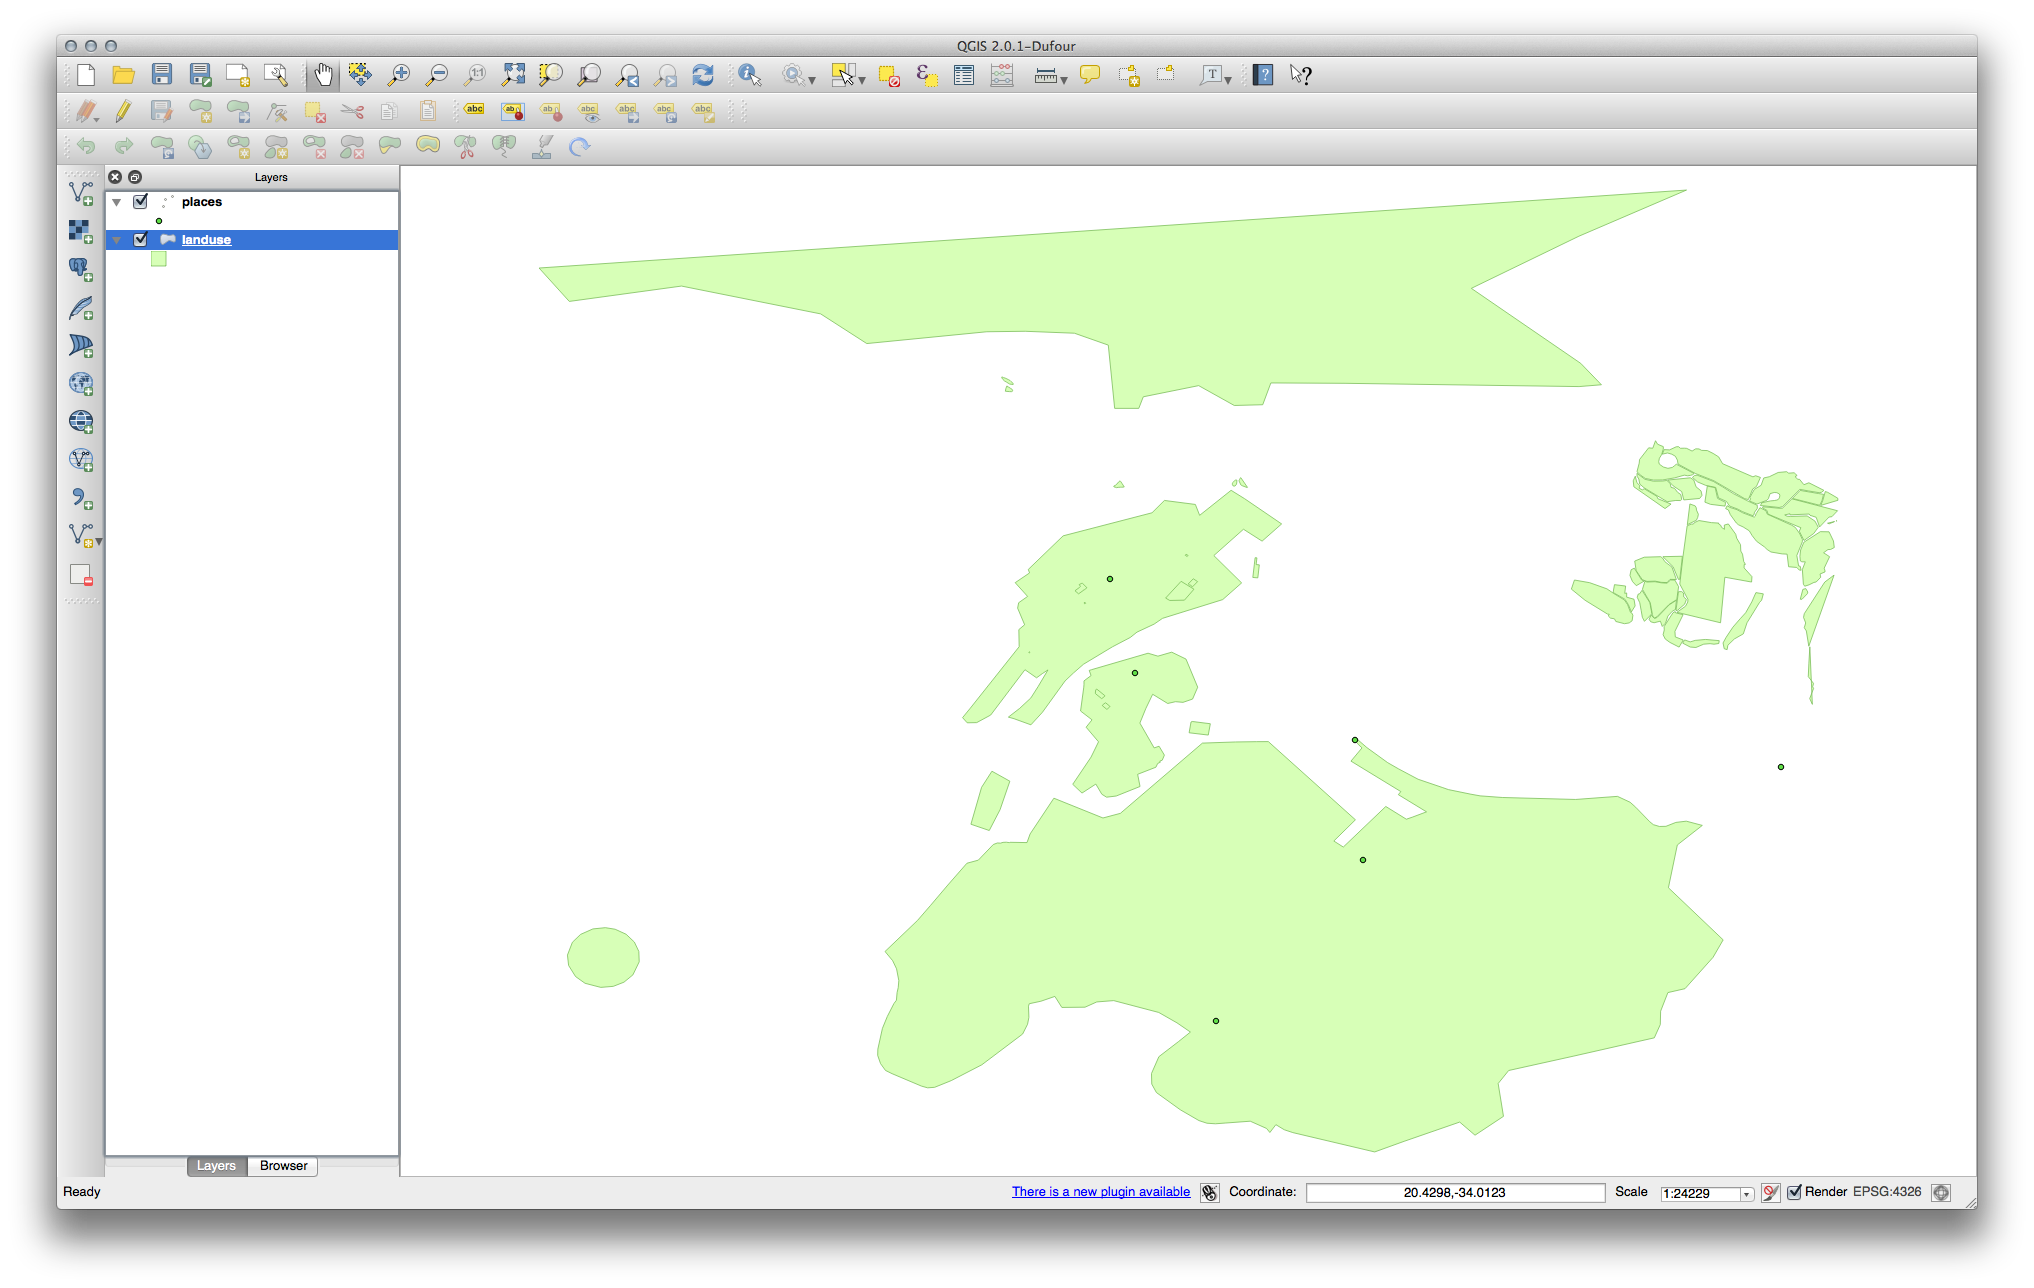
Carica questi vettori su una mappa nuova o esistente, con solo questi vettori visibili:
Before starting to add the WMS layer, first deactivate “on the fly” projection. This may cause the layers to no longer overlap properly, but don’t worry: we’ll fix that later.
To add WMS layers, click on the Add WMS Layer button:

Remember how you connected to a SpatiaLite database at the beginning of the course. The landuse, places, and water layers are in that database. To use those layers, you first needed to connect to the database. Using a WMS is similar, with the exception that the layers are on a remote server.
- To create a new connection to a WMS, click on the New button.
You’ll need a WMS address to continue. There are several free WMS servers available on the Internet. One of these is terrestris, which makes use of the OpenStreetMap dataset.
To make use of this WMS, set it up in your current dialog, like this:
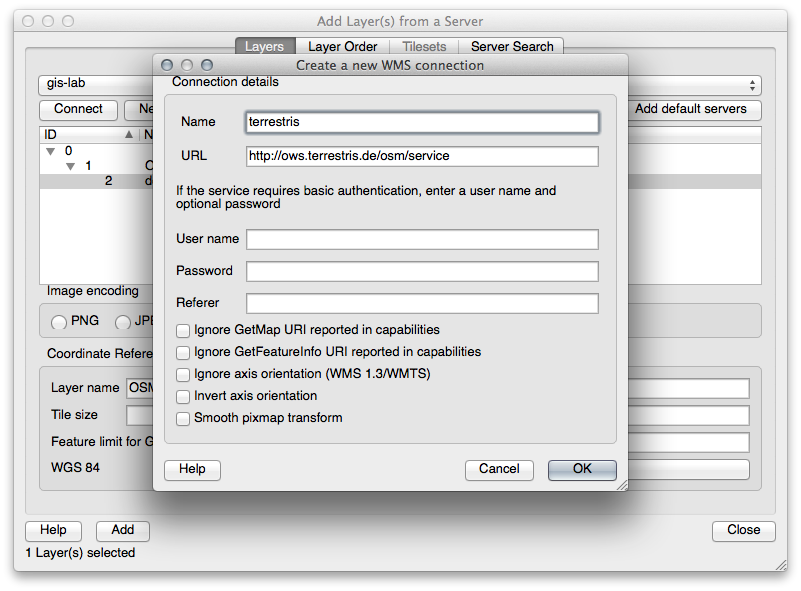
The value of the Name field should be terrestris.
The value of the URL field should be http://ows.terrestris.de/osm/service.
Click OK. You should see the new WMS server listed:
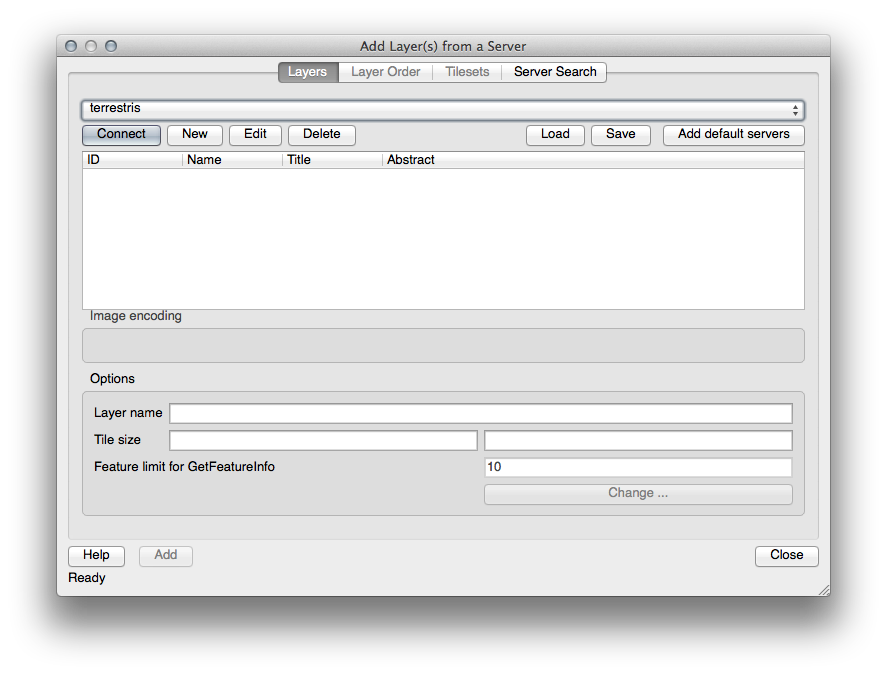
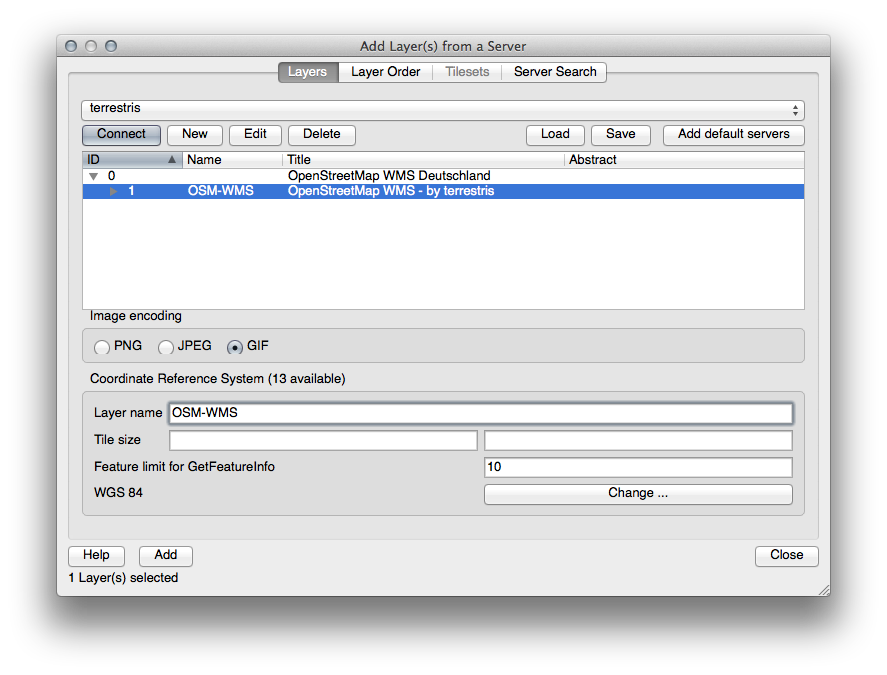
Click Connect. In the list below, you should now see these new entries loaded:
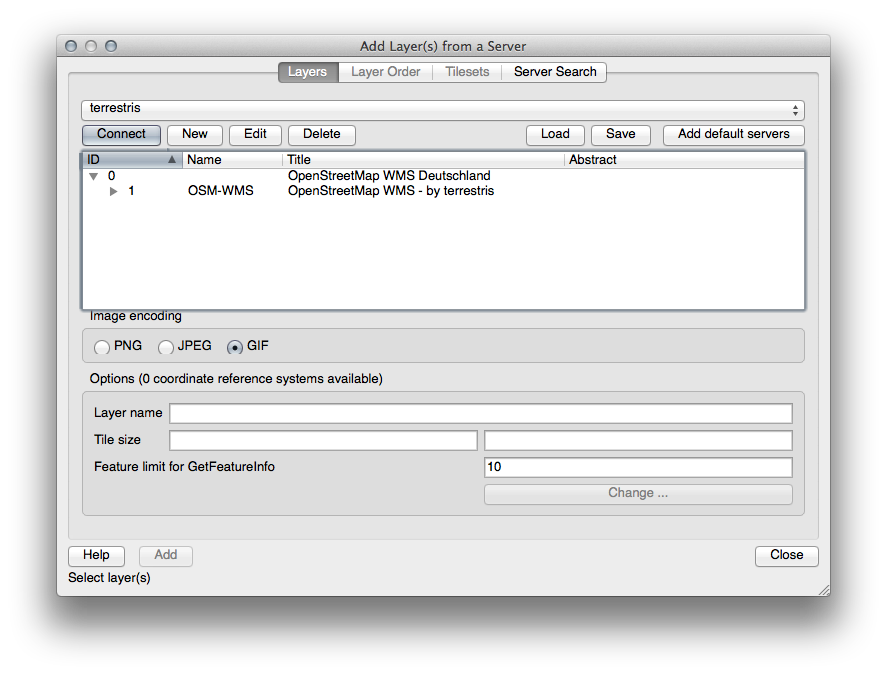
These are all the layers hosted by this WMS server.
Click once on the OSM-WMS layer. This will display its Coordinate Reference System:
Since we’re not using WGS 84 for our map, let’s see all the CRSs we have to choose from.
Click the Change button. You will see a standard Coordinate Reference System Selector dialog.
We want a projected CRS, so let’s choose WGS 84 / Pseudo Mercator.
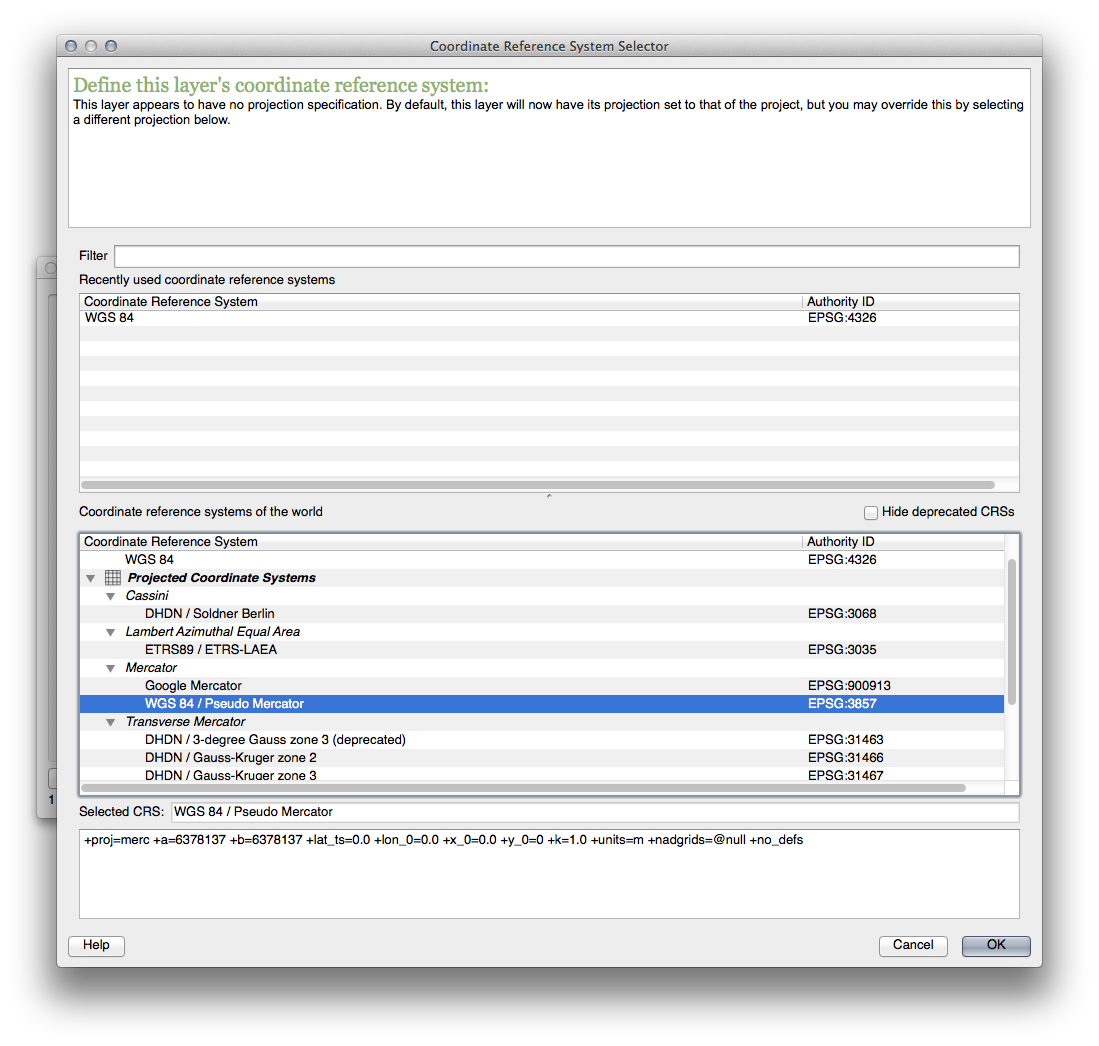
Click OK.
Click Add and the new layer will appear in your map as OSM-WMS.
In the Layers list, click and drag it to the bottom of the list.
You will notice that your layers aren’t located correctly. This is because “on the fly” projection is disabled. Let’s enable it again, but using the same projection as the OSM-WMS layer, which is WGS 84 / Pseudo Mercator.
Enable “on the fly” projection.
In the CRS tab (Project Properties dialog), enter the value pseudo in the Filter field:
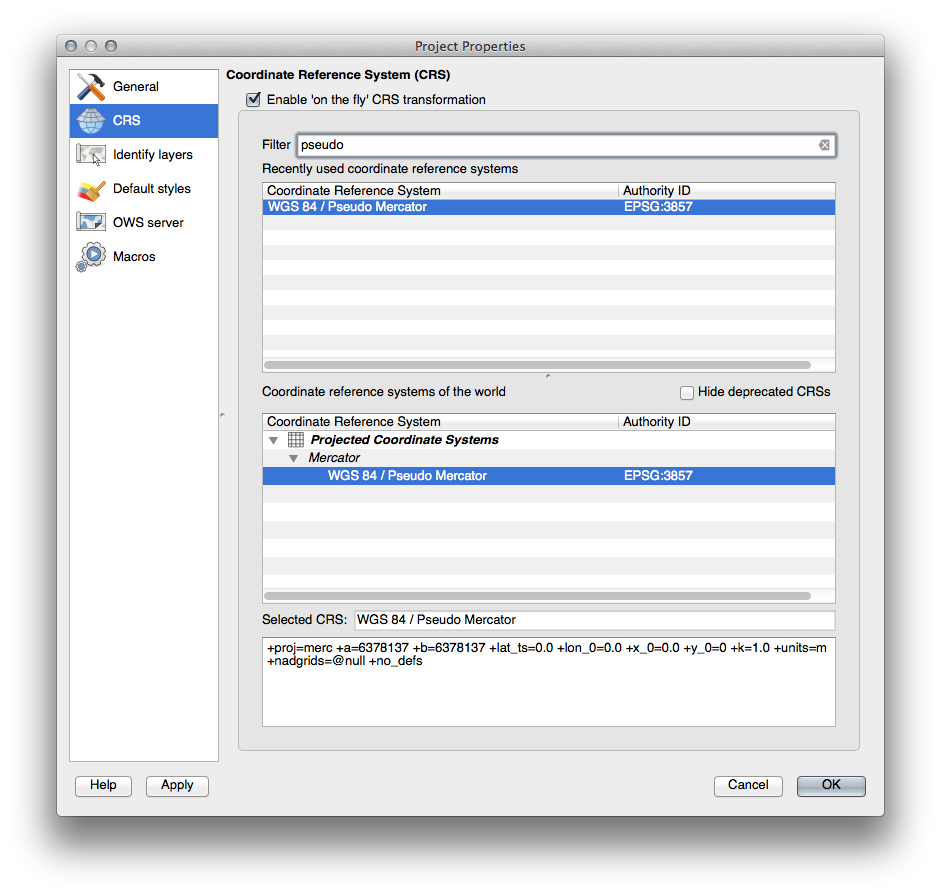
Choose WGS 84 / Pseudo Mercator from the list.
Click OK.
Now right-click on one of your own layers in the Layers list and click Zoom to layer extent. You should see the Swellendam area:
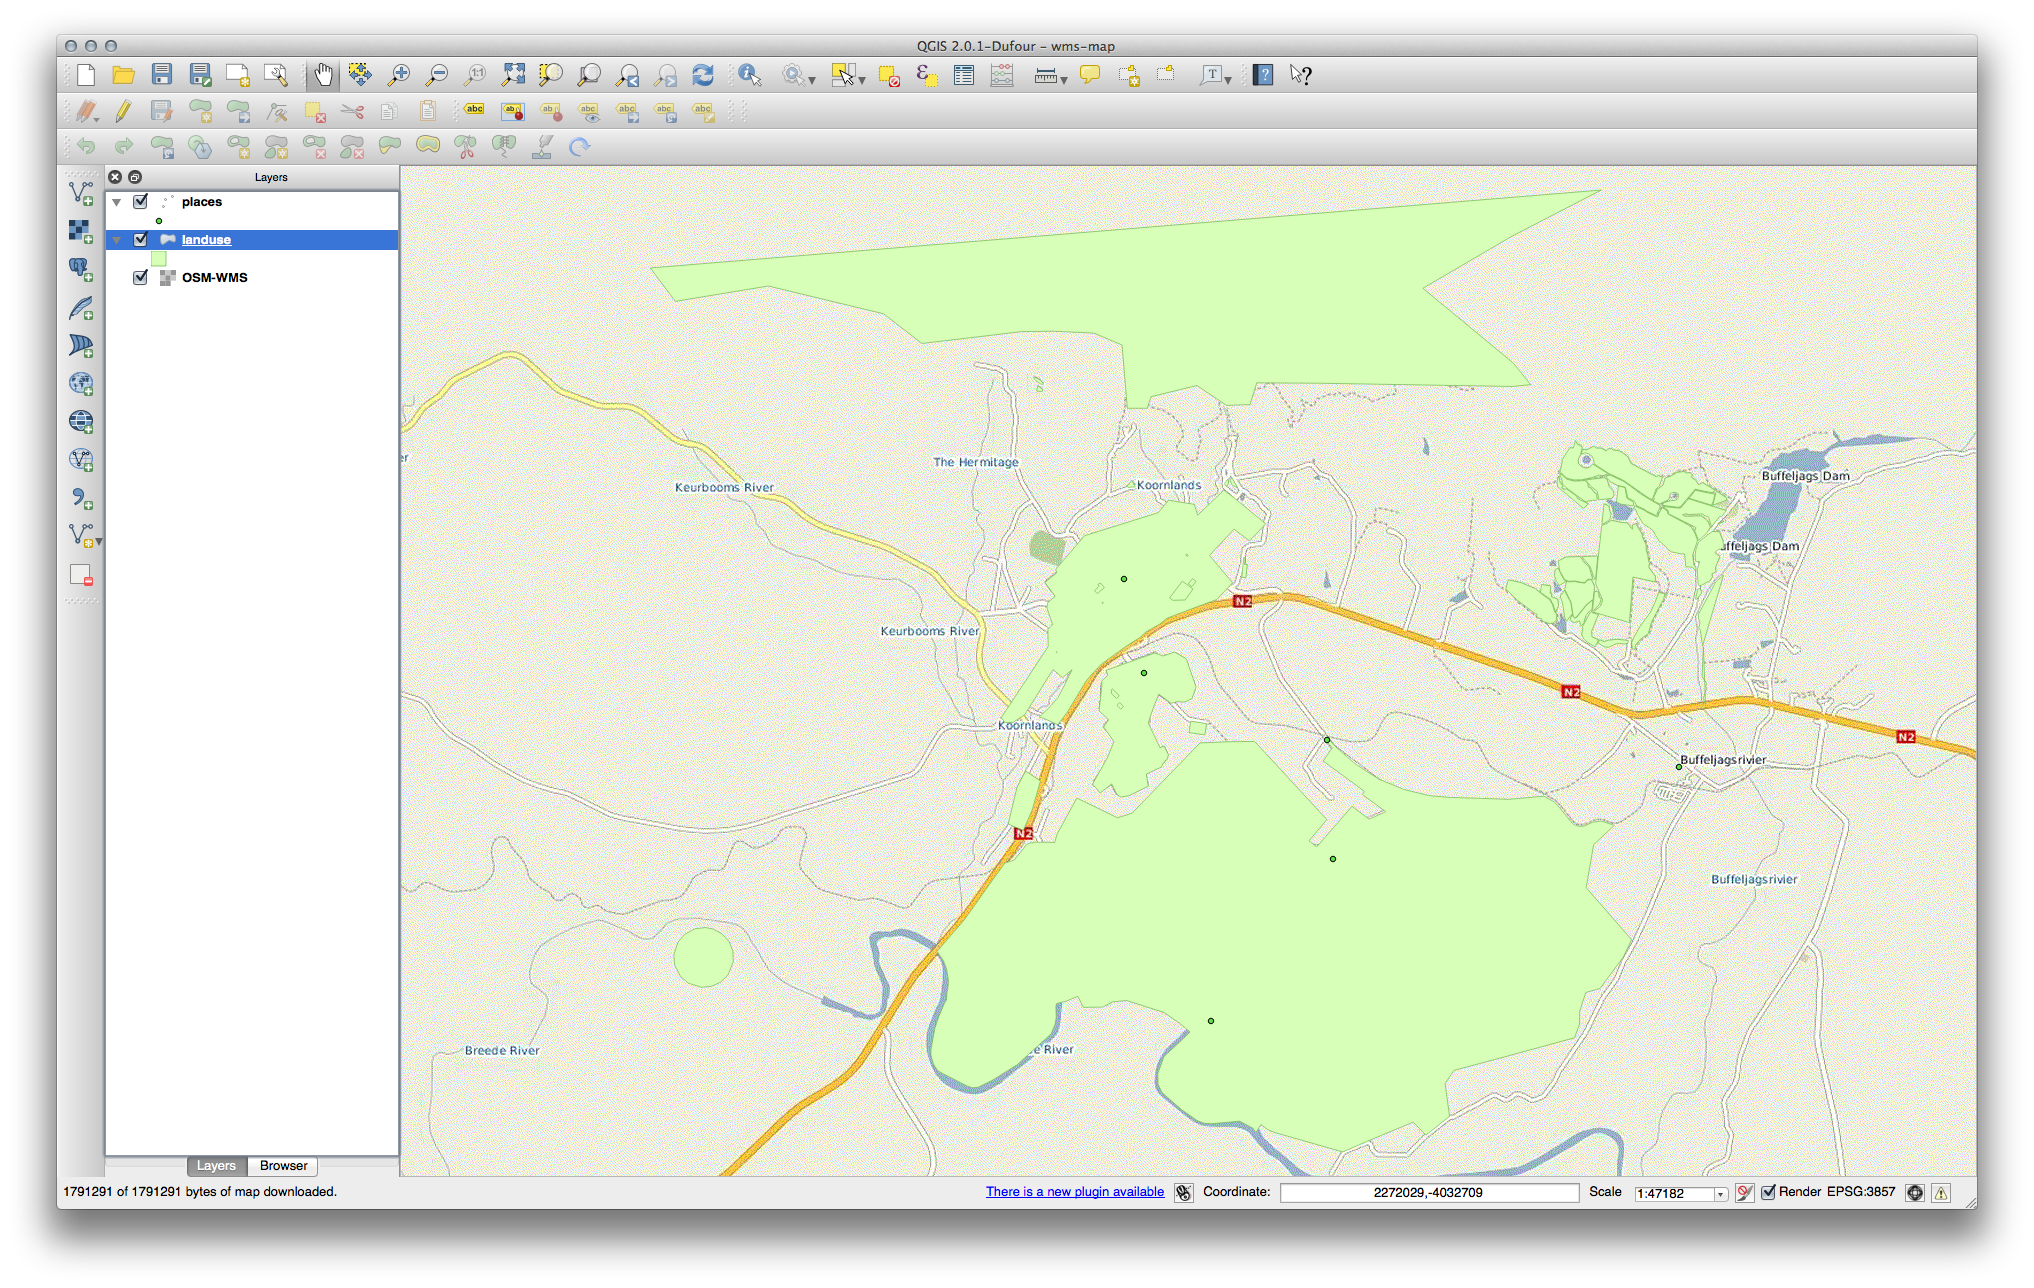
Note how the WMS layer’s streets and our own streets overlap. That’s a good sign!
11.1.1.1. The nature and limitations of WMS
By now you may have noticed that this WMS layer actually has many features in it. It has streets, rivers, nature reserves, and so on. What’s more, even though it looks like it’s made up of vectors, it seems to be a raster, but you can’t change its symbology. Why is that?
This is how a WMS works: it’s a map, similar to a normal map on paper, that you receive as an image. What usually happens is that you have vector layers, which QGIS renders as a map. But using a WMS, those vector layers are on the WMS server, which renders it as a map and sends that map to you as an image. QGIS can display this image, but can’t change its symbology, because all that is handled on the server.
This has several advantages, because you don’t need to worry about the symbology. It’s already worked out, and should be nice to look at on any competently designed WMS.
On the other hand, you can’t change the symbology if you don’t like it, and if things change on the WMS server, then they’ll change on your map as well. This is why you sometimes want to use a Web Feature Service (WFS) instead, which gives you vector layers separately, and not as part of a WMS-style map.
This will be covered in the next lesson, however. First, let’s add another WMS layer from the terrestris WMS server.
11.1.2. |base| Try Yourself
Hide the OSM-WSM layer in the Layers list.
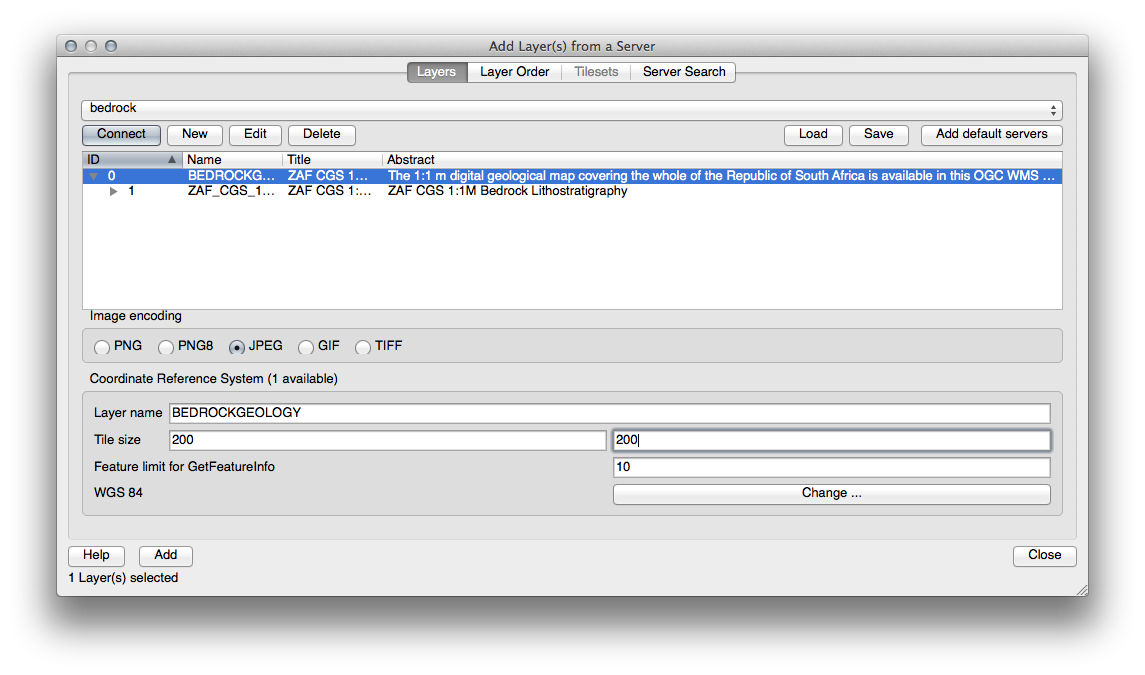
Add the “ZAF CGS 1M Bedrock Lithostratigraphy” WMS server at this URL: http://196.33.85.22/cgi-bin/ZAF_CGS_Bedrock_Geology/wms
Load the BEDROCKGEOLOGY layer into the map (use the Add WMS Layer button as before). Remember to check that it’s in the same WGS 84 / World Mercator projection as the rest of your map!
You might want to set its Encoding to JPEG and its Tile size option to 200 by 200, so that it loads faster:
11.1.3.  Try Yourself
- Hide all other WMS layers to prevent them rendering unnecessarily in the background.
- Add the “OGC” WMS server at this URL: http://ogc.gbif.org:80/wms
- Add the bluemarble layer.
11.1.4.  Try Yourself
Part of the difficulty of using WMS is finding a good (free) server.
Find a new WMS at directory.spatineo.com (or elsewhere online). It must not have associated fees or restrictions, and must have coverage over the Swellendam study area.
Remember that what you need in order to use a WMS is only its URL (and preferably some sort of description).
11.1.5. In Conclusion
Using a WMS, you can add inactive maps as backdrops for your existing map data.
11.1.6. Further Reading
11.1.7. What’s Next?
Now that you’ve added an inactive map as a backdrop, you’ll be glad to know that it’s also possible to add features (such as the other vector layers you added before). Adding features from remote servers is possible by using a Web Feature Service (WFS). That’s the topic of the next lesson.