Importante
A tradução é um esforço comunitário você pode contribuir. Esta página está atualmente traduzida em 65.67%.
17.33. Usar linhas do código R em Processamento
Módulo foi contribuição de Matteo Ghetta - financiado por Scuola Superiore Sant’Anna
Processing (with the Processing R Provider plugin) makes it possible to write and run R scripts inside QGIS.
Aviso
R has to be installed on your computer and the PATH has to be correctly set up. Moreover Processing just calls the external R packages, it is not able to install them. So be sure to install external packages directly in R. See the related chapter in the user manual.
Nota
Se você tiver problemas com pacote, isso pode estar relacionado à falta de pacotes obrigatórios requeridos pelo Processamento, como sp, rgdal e raster.
17.33.1. Adicionar linhas de código
Adding a script is simple.
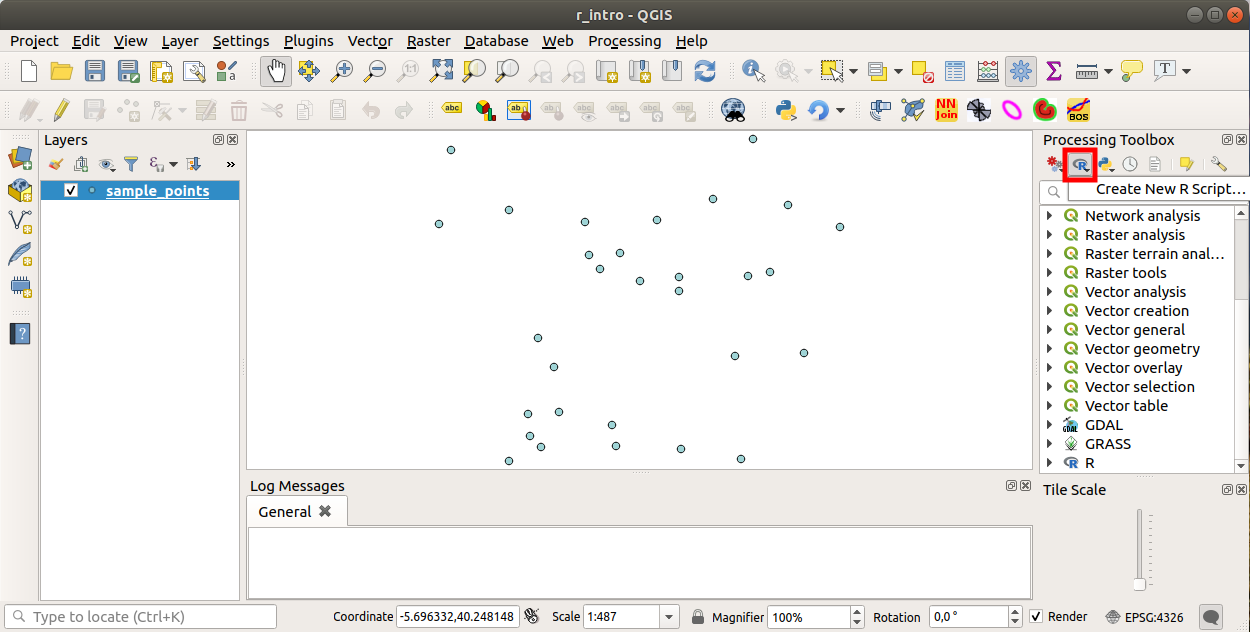
The easiest way is to open the Processing toolbox and choose
Create new R script… from the R menu (labelled with an
R icon) at the top of the Processing Toolbox.
You can also create the script in for instance a text editor and save it in
your R scripts folder (processing/rscripts).
When it has been saved there, it will be available for editing by
right-clicking on the script name in the processing toolbox and then choose
Edit Script…).
Nota
Si no puedes ver R en Processinf, tienes que activarlo en
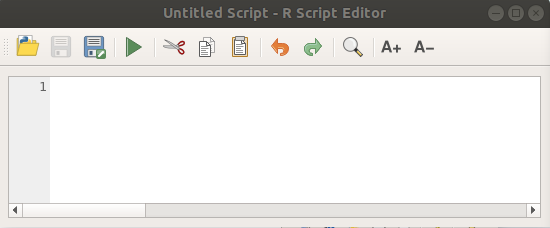
It opens a R Script Editor in which you have to specify some parameters before you can add the script body.
17.33.2. Criar parcelas
En este tutorial vamos a crear una “caja de parcelas” de un campo de capas vectoreales.
Open the r_intro.qgs QGIS project under the
exercise_data/processing/r_intro/ folder.
Parametros de linea de codigo
Abrir el editor y comenzar a escribir al inicio.
“Tienes” que especofocar algunso parametros “antes” del cuerpo de codigo de lineas;
The name of the group (plots in this case) in which you want to put your script (if the group does not exist, it will be created):
##plots=groupYou will find your script in the plots R group in the Processing toolbox.
You have to tell Processing that you want to display a plot (in this example):
##showplotsYou will then find a link to the plot in the Result Viewer panel (can be turned on / off in and with ).
You also need to tell Processing about your input data. In this example we want to create a plot from a field of a vector layer:
##Layer=vectorO processamento agora sabe que a entrada é um vetor. O nome Camada não é importante, o que importa é o parâmetro vetor.
Finalmente, você deve especificar o campo de entrada da camada vetorial (usando o nome que você forneceu acima - Camada):
##X=Field LayerO processamento agora sabe que você precisa de um campo de Camada e que você o chamará de X.
Também é possível definir o nome do seu script usando
nome:##My box plot script=nameSe não for definido, o nome do arquivo será usado como o nome do script.
Cuerpo de lineas de codigo
Ahora que tienes la “cabecera” de las lineas de codigo puedes agregar las funciones;
boxplot(Layer[[X]])
boxplot is the name of the R function, the parameter Layer is the name that you have defined for the input dataset and X is the name you have defined for the field of that dataset.
Aviso
O parâmetro X deve estar entre colchetes duplos ([[]]).
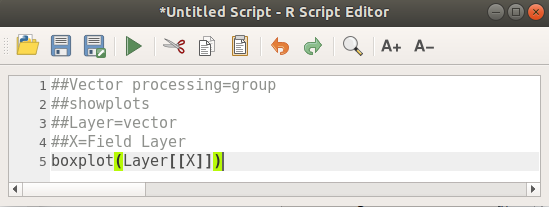
El codigo final se ve asi:
##Vector processing=group
##showplots
##Layer=vector
##X=Field Layer
boxplot(Layer[[X]])
Save the script in the default path suggested by Processing (processing/rscripts).
If you have not defined a name in the script heading, the file name you
choose will become the name of the script in the Processing toolbox.
Nota
Você pode salvar o script onde quiser, mas o Processamento não poderá incluí-lo na caixa de ferramentas de processamento automaticamente, então você terá que carregá-lo manualmente.
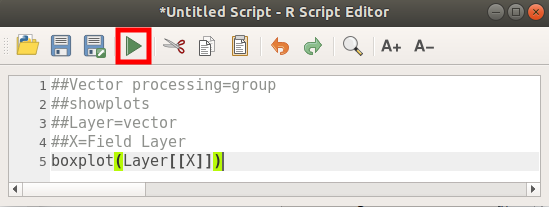
Ahora puedes correrlo usando el botón en la parte superior de la ventana de edición:
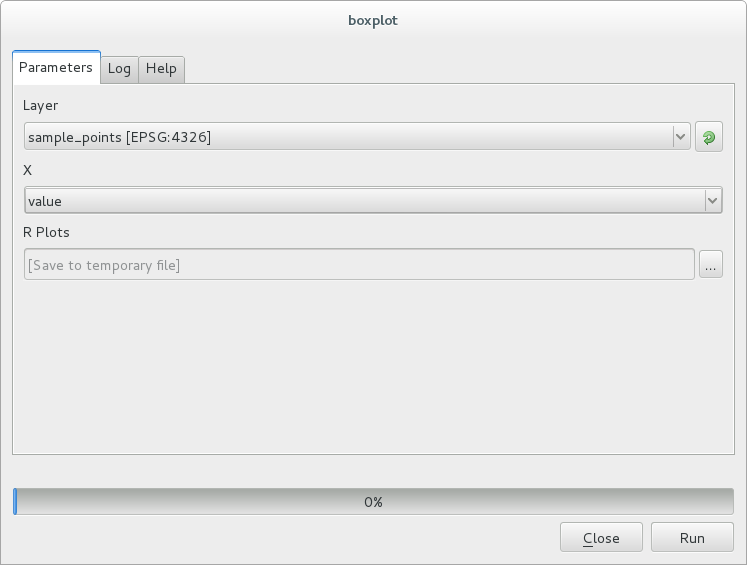
Once the editor window has been closed, use the text box of Processing to find your script:
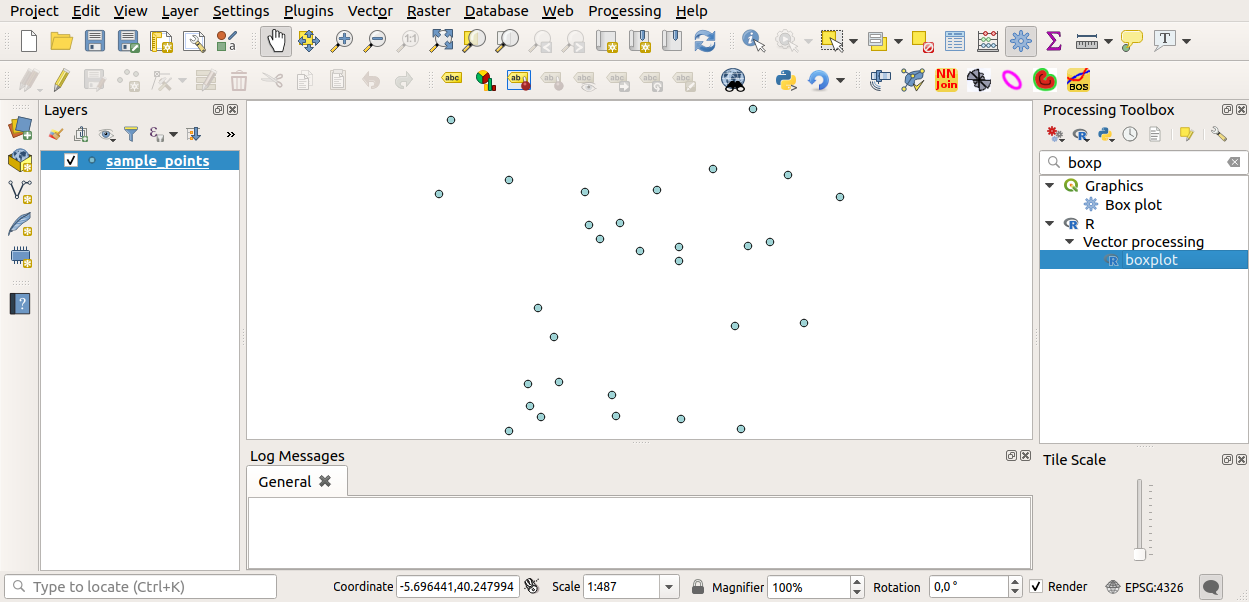
Agora você pode preencher os parâmetros necessários na janela de processamento do algoritmo:
for Layer choose
sample_pointsfor the X field choose
value
Click on Run.
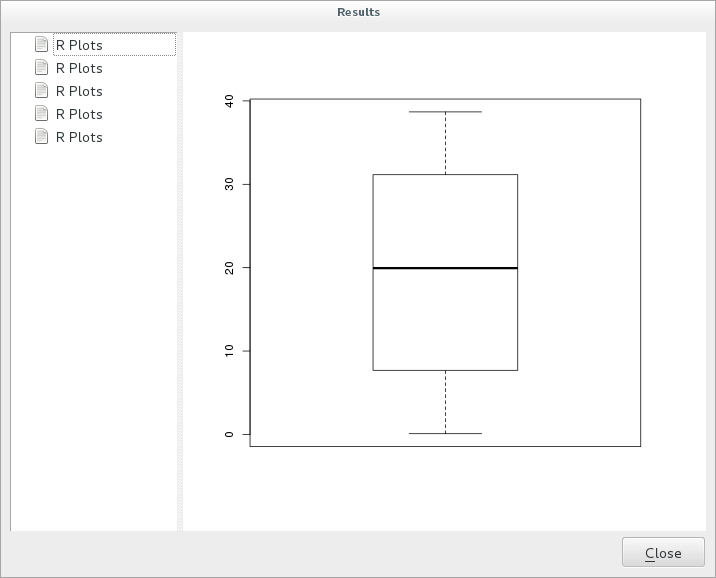
La “Ventana de Resultados” se debe abrir automaticamente, si no, solo hacer click en .
Clique no link no visualizador e você verá:
Nota
You can open, copy and save the image by right clicking on the plot.
17.33.3. Crear un vector
Você também pode criar uma camada vetorial e carregá-la automaticamente no QGIS.
The following example has been taken from the Random sampling grid
script that can be found in the online collection of R scripts
(the scripts in this online collection can be found in
https://github.com/qgis/QGIS-Processing/tree/master/rscripts).
The aim of this exercise is to create a random point vector layer
using an input vector layer to restrict the extent using the spsample
function of the sp package.
Parametros de linea de codigo
Igual que aneriormente hay que poner parametros antes del cuerpo del codigo:
Especifique o nome do grupo no qual deseja colocar seu script, neste caso Análise de padrão de pontos:
##Point pattern analysis=groupDefina um parâmetro de entrada (uma camada vetorial) que restringirá o posicionamento dos pontos aleatórios:
##Layer=vectorDefina um parâmetro de entrada para o número de pontos que serão criados (
Tamanho, com um valor padrão de10):##Size=number 10Nota
Como um valor padrão (
10) está definido, o usuário pode alterar este número ou pode deixar o parâmetro sem número.Especifique que existe uma camada vetorial de saída (chamada
Saída):##Output=output vector
Cuerpo de lineas de codigo
Ahora que puedes agregar el cuerpo de la funcion:
Use the
spsamplefunction:pts=spsample(Layer, Size, type="random")
The function uses the Layer to constrain the placement of the points (if it is a line layer, a points will have to be on one of the lines in the layer, if it is a polygon layer, a point will have to be within a polygon). The number of points is taken from the Size parameter. The sampling method is random.
Generate the output (the
Outputparameter):Output=SpatialPointsDataFrame(pts, as.data.frame(pts))
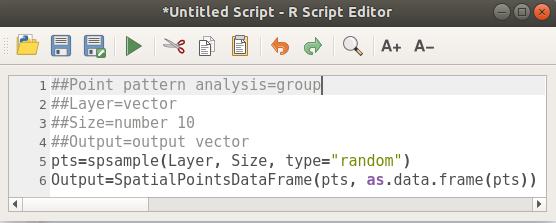
El codigo final se ve asi:
##Point pattern analysis=group
##Layer=vector
##Size=number 10
##Output=output vector
pts=spsample(Layer, Size, type="random")
Output=SpatialPointsDataFrame(pts, as.data.frame(pts))
Salve e execute, clicando no botão executar.
En la ventana nueva escriba los parámetros correctos:
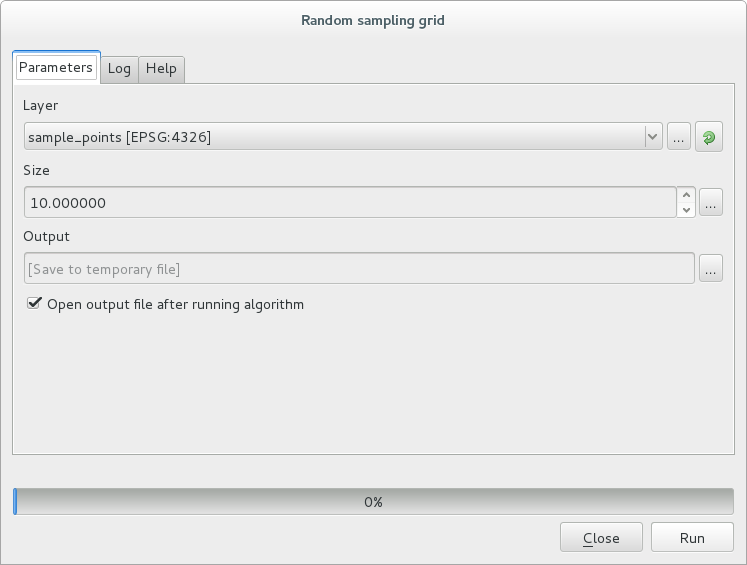
haga click en ejecutar.
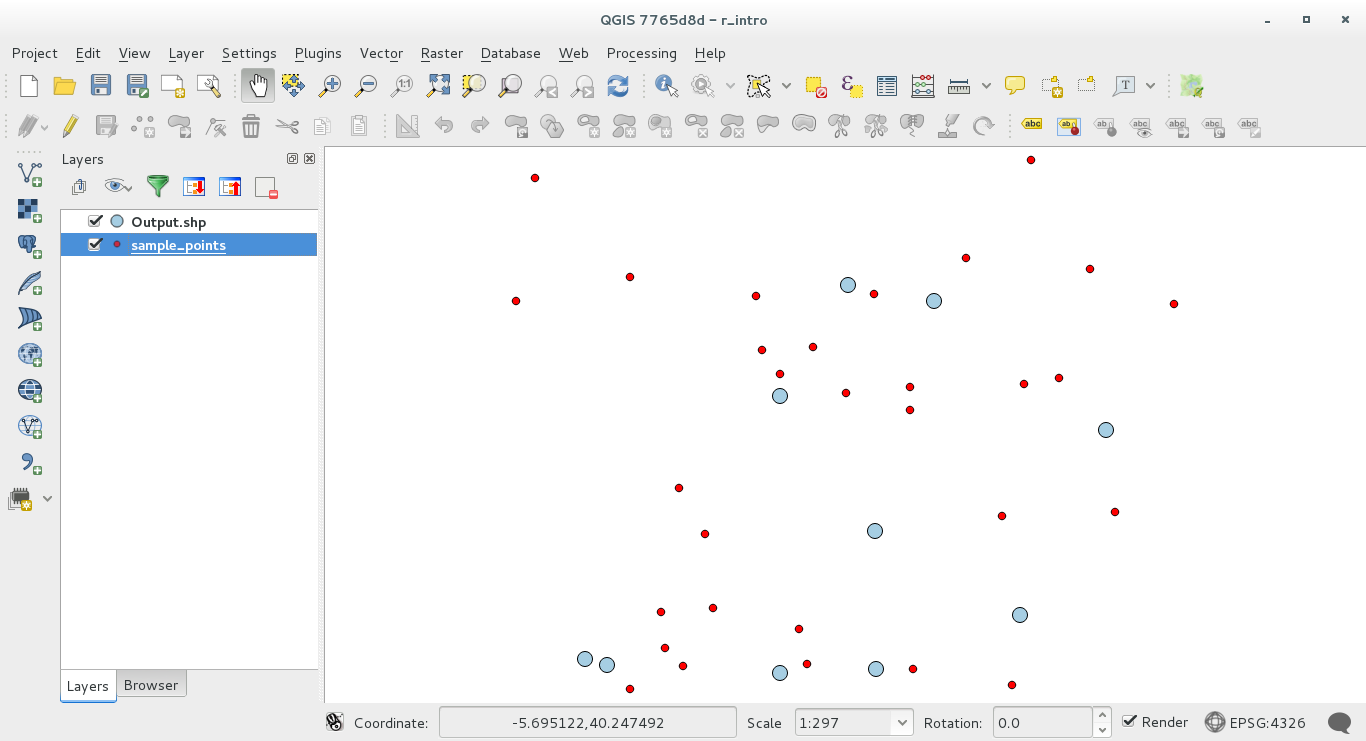
A camada de resultado será adicionada ao índice e seus pontos serão exibidos na tela do mapa:
17.33.4. Saída de texto e gráfico de R - sintaxe
O processamento (com o “Plugin fornecedor de Processamento R”) utiliza uma sintaxe especial para obter os resultados do R:
>antes de su comand, como>lillie.test(Layer[[Field]])significa que el resultado se debe enviar a la salida de R (Result viewer)+after a plot enables overlay plots. For exampleplot(Layer[[X]], Layer[[Y]]) + abline(h=mean(Layer[[X]]))