Important
Traducerea este un efort al comunității, la care puteți să vă alăturați. În prezent, această pagină este tradusă 30.95%.
3.3. Lesson: Classification
Labels are a good way to communicate information such as the names of
individual places, but they can’t be used for everything.
For example, let us say that someone wants to know what each
landuse area is used for.
Using labels, you would get this:
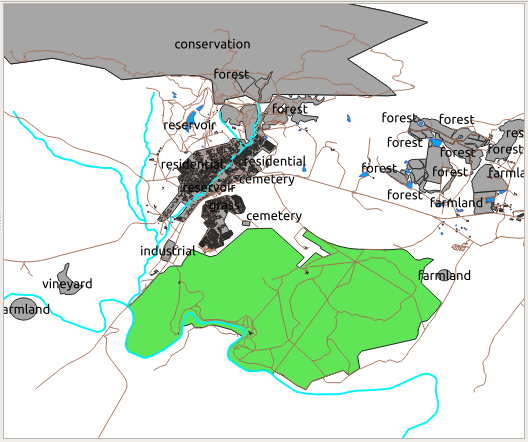
Acest lucru face etichetarea hărții dificil de înțeles, și chiar copleșitoare atunci când există suprafețe de teren cu numeroase utilizări.
Scopul acestei lecții: De a afla cum se pot clasifica în mod eficient datele vectoriale.
3.3.1. ★☆☆ Procedați în mod similar: Clasificarea Datelor Nominale
Open the Layer Properties dialog for the
landuselayerGo to the Symbology tab
Faceți clic, în meniul cu derulare verticală, pe Simbol Unic și schimbați-l în Categorisit:
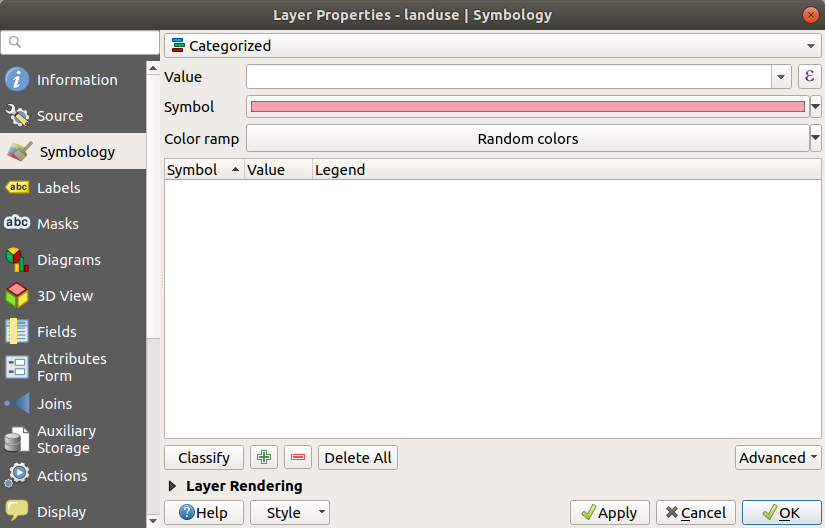
In the new panel, change the Value to
landuseand the Color ramp to Random colorsClick the button labeled Classify
Clic pe OK
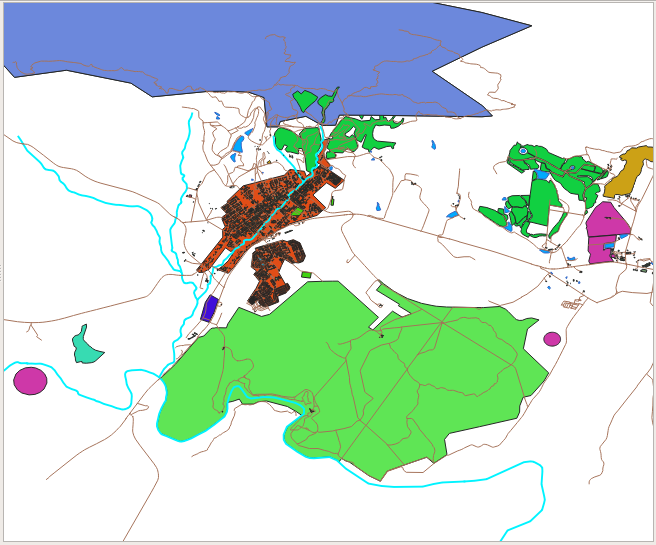
Veți vedea ceva de genul următor:
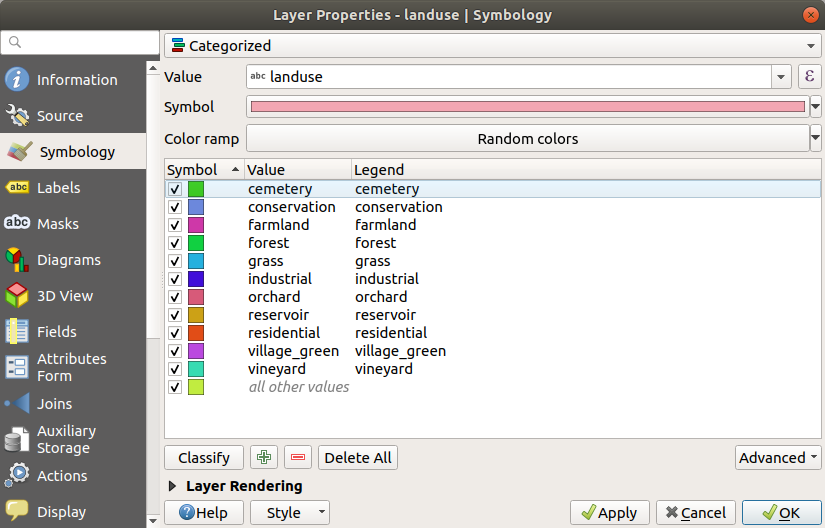
Click the arrow (or plus sign) next to
landusein the Layers panel, you’ll see the categories explained: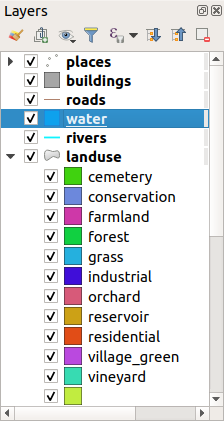
Now our landuse polygons are colored and are classified so that areas with the same land use are the same color.
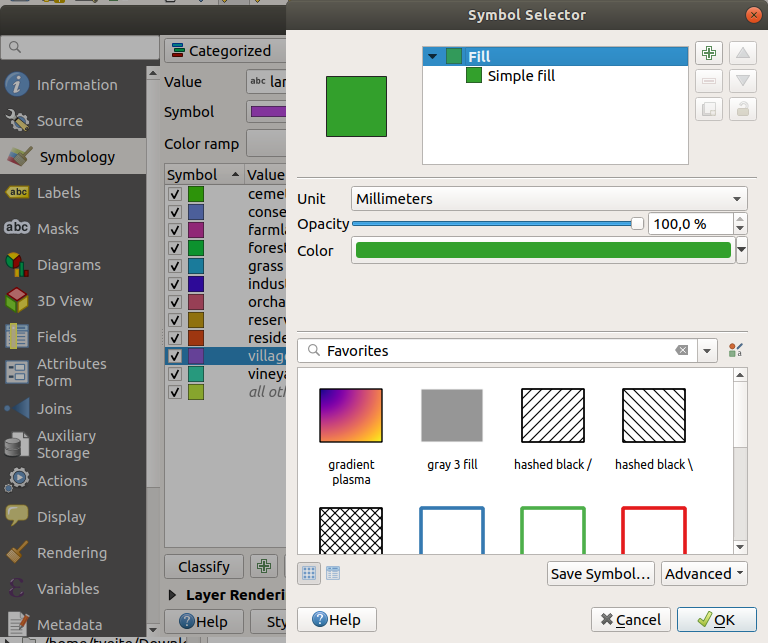
If you wish to, you can change the symbol of each landuse area by double-clicking the relevant color block in the Layers panel or in the Layer Properties dialog:
Observați că există o categorie necompletată:
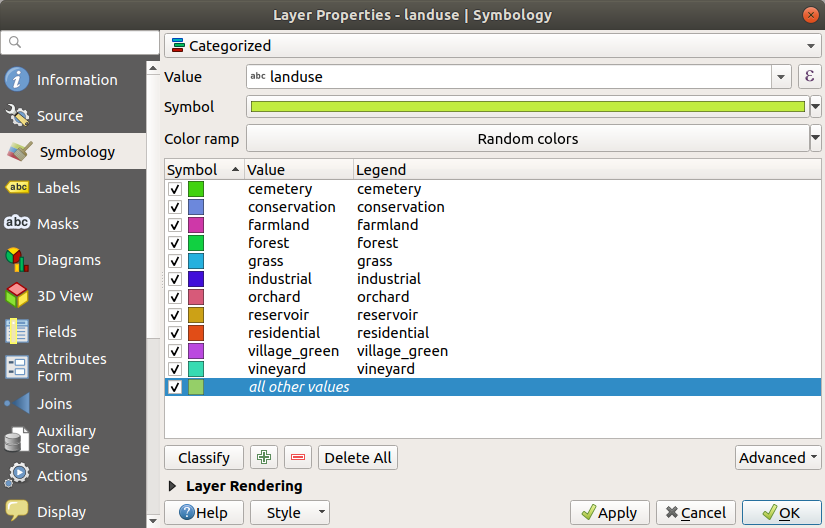
This empty category is used to color any objects which do not have a landuse value defined or which have a NULL value. It can be useful to keep this empty category so that areas with a NULL value are still represented on the map. You may like to change the color to more obviously represent a blank or NULL value.
Amintiți-vă să salvați harta dvs. acum, astfel încât să nu pierdeți toate modificările greu efectuate!
3.3.2. ★☆☆ Încercați și dvs.: Mai multă Clasificare
Use the knowledge you gained above to classify the buildings layer.
Set the categorisation against the building field and use the
Spectral color ramp.
Notă
Amintiți-vă să focusați într-o zonă urbană, pentru a vedea rezultatele.
3.3.3. ★★☆ Follow Along: Ratio Classification
Există patru tipuri de clasificare: nominal, ordinal, interval și raport.
In nominal classification, the categories that objects are classified into are name-based; they have no order. For example: town names, district codes, etc. Symbols that are used for nominal data should not imply any order or magnitude.
For points, we can use symbols of different shape.
For polygons, we can use different types of hatching or different colours (avoid mixing light and dark colours).
For lines, we can use different dash patterns, different colours (avoid mixing light and dark colours) and different symbols along the lines.
In ordinal classification, the categories are arranged in a certain order. For example, world cities are given a rank depending on their importance for world trade, travel, culture, etc. Symbols that are used for ordinal data should imply order, but not magnitude.
For points, we can use symbols with light to dark colours.
For polygons, we can use graduated colours (light to dark).
For lines, we can use graduated colours (light to dark).
In interval classification, the numbers are on a scale with positive, negative and zero values. For example: height above/below sea level, temperature in degrees Celsius. Symbols that are used for interval data should imply order and magnitude.
For points, we can use symbols with varying size (small to big).
For polygons, we can use graduated colours (light to dark) or add diagrams of varying size.
For lines, we can use thickness (thin to thick).
In ratio classification, the numbers are on a scale with only positive and zero values. For example: temperature above absolute zero (0 degrees Kelvin), distance from a point, the average amount of traffic on a given street per month, etc. Symbols that are used for ratio data should imply order and magnitude.
For points, we can use symbols with varying size (small to big).
For polygons, we can use graduated colours (light to dark) or add diagrams of varying size.
For lines, we can use thickness (thin to thick).
In the example above, we used nominal classification to color each
record in the landuse layer based on its landuse attribute.
Now we will use ratio classification to classify the records by area.
We are going to reclassify the layer, so existing classes will be lost if not saved. To store the current classification:
Open the layer’s properties dialog
Click the Save Style … button in the Style drop-down menu.
Select Rename Current…, enter
land usageand press OK.The categories and their symbols are now saved in the layer’s properties.
Click now on the Add… entry of the Style drop-down menu and create a new style named
ratio. This will store the new classification.Close the Layer Properties dialog
We want to classify the landuse areas by size, but there is a problem: they don’t have a size field, so we’ll have to make one.
Open the Attributes Table for the
landuselayer.Enter edit mode by clicking the
 Toggle editing
button
Toggle editing
buttonAdd a new column of decimal type, called
AREA, using the New field button:
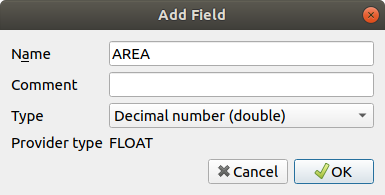
Clic pe OK
The new field will be added (at the far right of the table; you may need to scroll horizontally to see it). However, at the moment it is not populated, it just has a lot of NULL values.
To solve this problem, we will need to calculate the areas.
Open the field calculator with the
 button.
You will get this dialog:
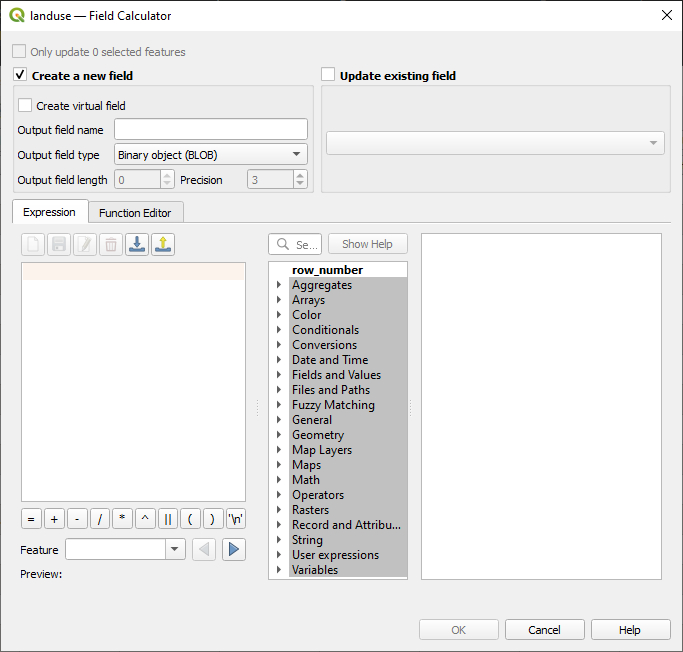
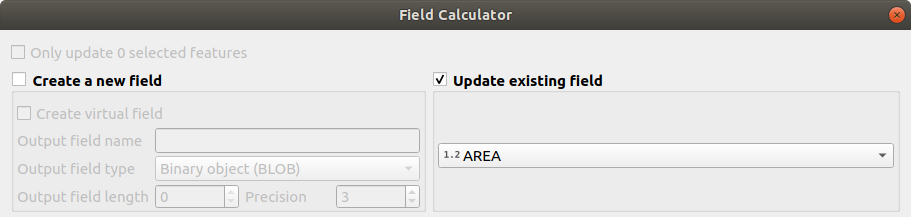
Check the
 Update existing fields
Select AREA in the fields drop-down menu
Under the Expression tab, expand the Geometry functions group in the list and find
Double-click on it so that it appears in the Expression field
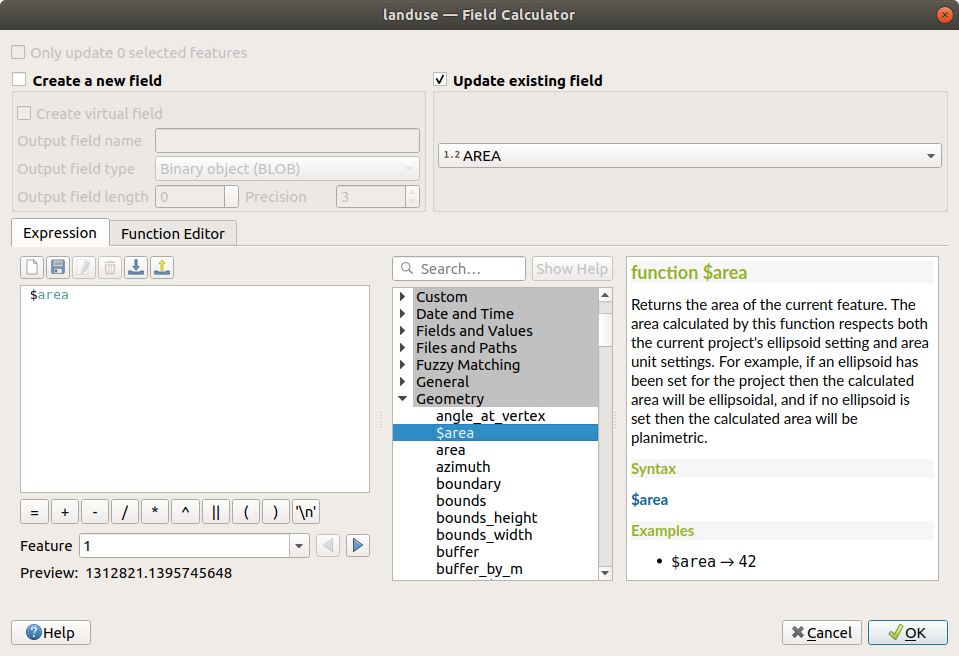
Clic pe OK
Scroll to the
AREAfield in the attribute table and you will notice that it is populated with values (you may need to click the column header to refresh the data).
Notă
These areas respect the project’s area unit settings, so they may be in square meters or square degrees.
Press
 to save the edits and exit the edit mode with
Toggle editing
to save the edits and exit the edit mode with
Toggle editingClose the attribute table
Now that we have the data, let’s use them to render the landuse layer.
Open the Layer properties dialog’s Symbology tab for the
landuselayerChange the classification style from Categorized to Graduated
Change the Value to
AREAUnder Color ramp, choose the option Create New Color Ramp…:
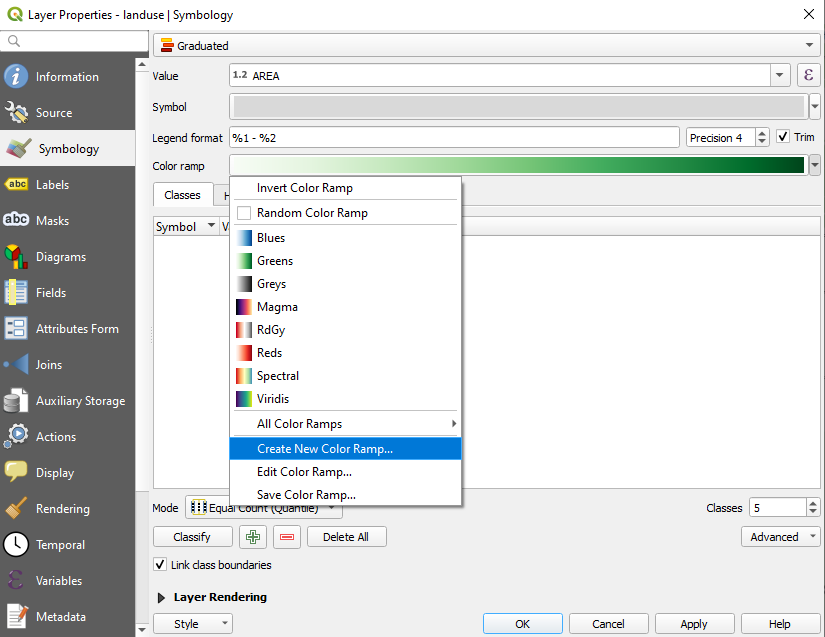
Choose Gradient (if it’s not selected already) and click OK. You will see this:
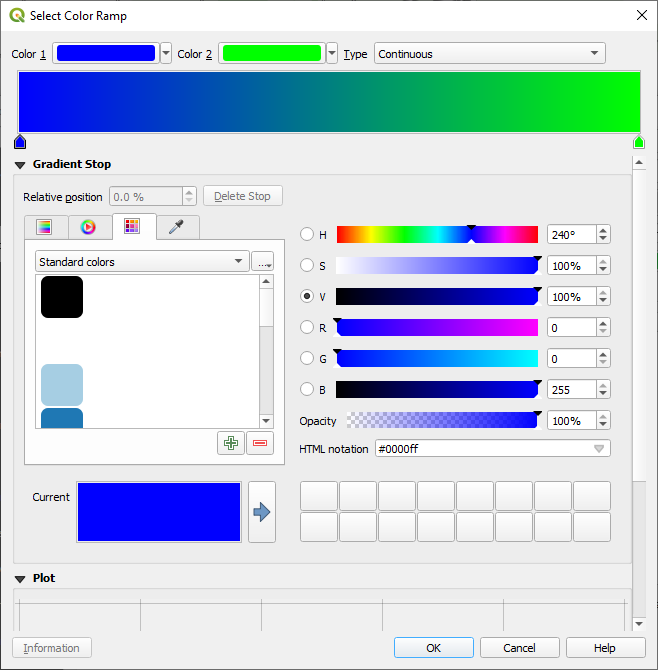
Veți folosi acest lucru pentru a desemna Color 1 pentru suprafețele mici și Color 2 pentru suprafețele mari.
Choose appropriate colors
În acest exemplu, rezultatul arată în felul următor:
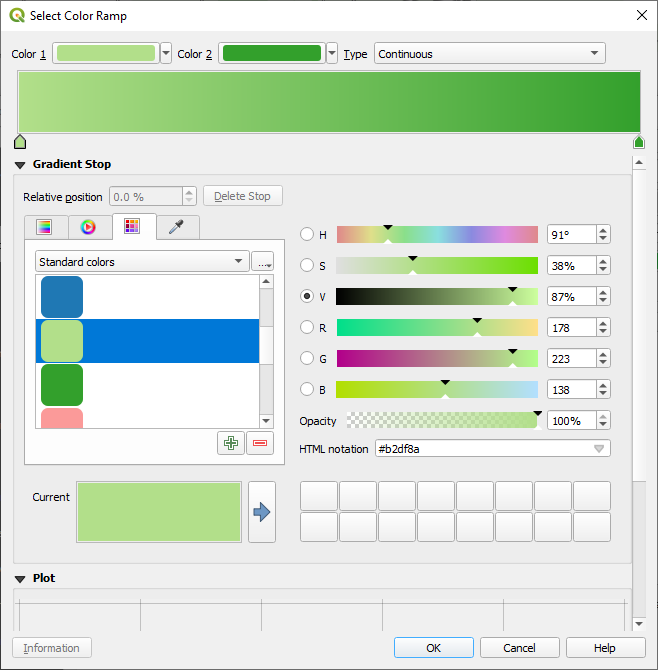
Clic pe OK
You can save the colour ramp by selecting Save Color Ramp… under the Color ramp tab. Choose an appropriate name for the colour ramp and click Save. You will now be able to select the same colour ramp easily under All Color Ramps.
Under Mode choose
 Equal Count (Quantile) .
Click Classify
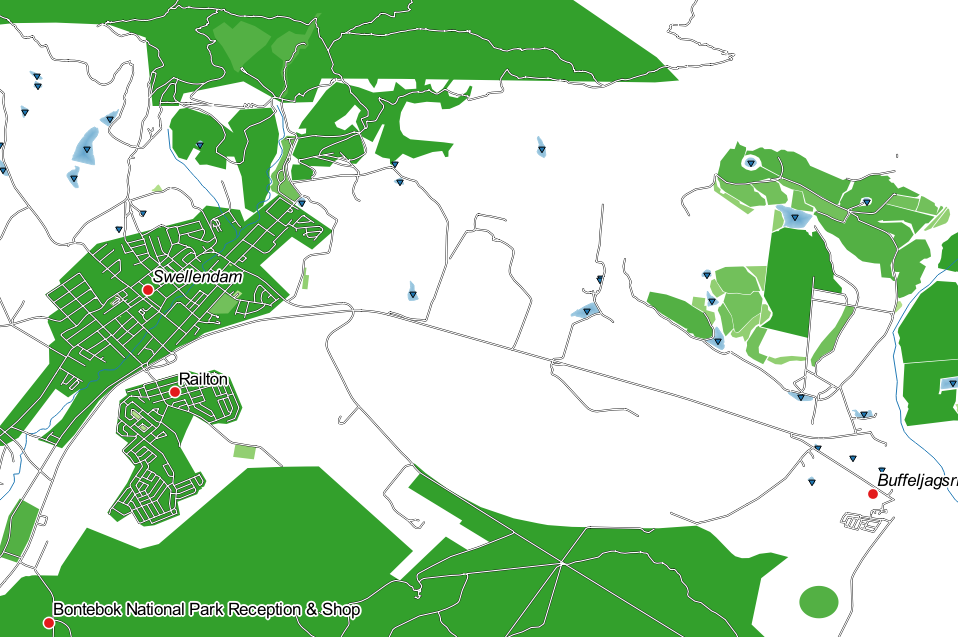
Now you will have something like this:
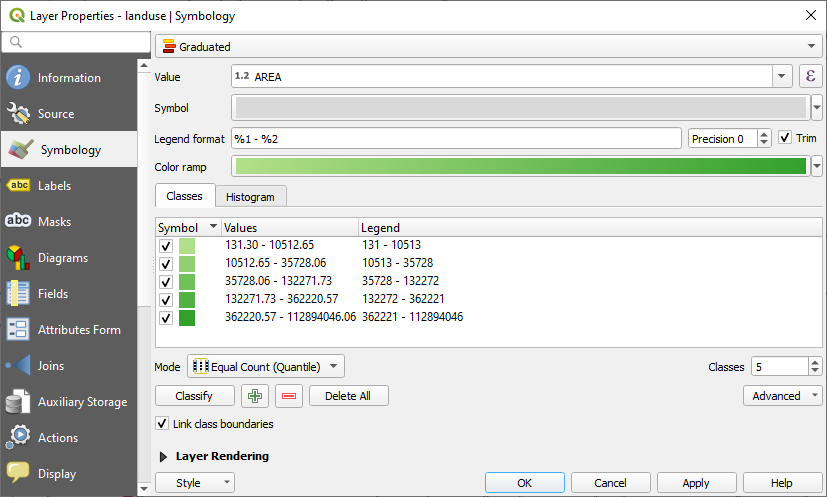
Lăsați totul așa cum este.
Clic pe OK
3.3.4. ★★☆ Try Yourself: Refine the Classification
Modificați valorile pentru Mod și Clase până când veți obține o clasificare care are sens.
Răspuns
The settings you used might not be the same, but with the values
Classes = 6 and Mode = Natural Breaks
(Jenks) (and using the same colors, of course), the map will look like this:
3.3.5. ★★★ Follow Along: Rule-based Classification
Adesea este utilă combinarea mai multor criterii pentru o clasificare, dar, din păcate, clasificarea normală ia în considerare doar un singur atribut. Acesta este cazul în care este utilă clasificarea bazată pe reguli.
In this lesson, we will represent the landuse layer in a way to
easily identify Swellendam city from the other residential area,
and from the other types of landuse (based on their area).
Open the Layer Properties dialog for the
landuselayerSwitch to the Symbology tab
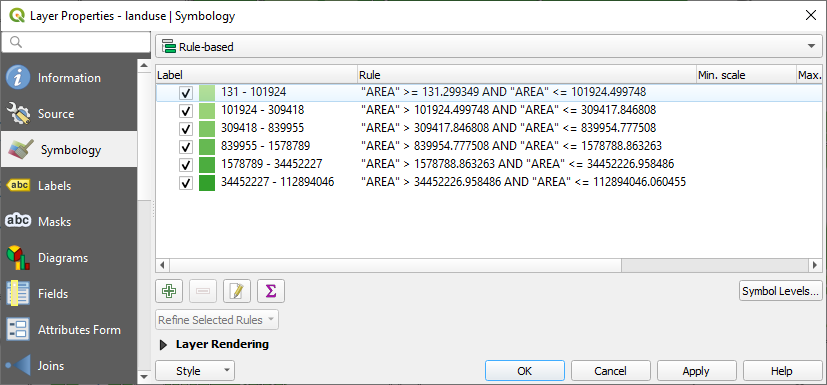
Switch the classification style to Rule-based
QGIS will automatically show the rules that represent the current classification implemented for this layer. For example, after completing the exercise above, you may see something like this:
Click and drag to select all the rules
Use the
 Remove selected rules button to remove
all of the existing rules
Remove selected rules button to remove
all of the existing rules
Let’s now add our custom rules.
Click the
 Add rule button
The Edit rule dialog then appears
Enter
Swellendam cityas LabelClick the
 button next to the Filter text
area to open the Expression String Builder
button next to the Filter text
area to open the Expression String BuilderEnter the criterion
"name" = 'Swellendam'and validate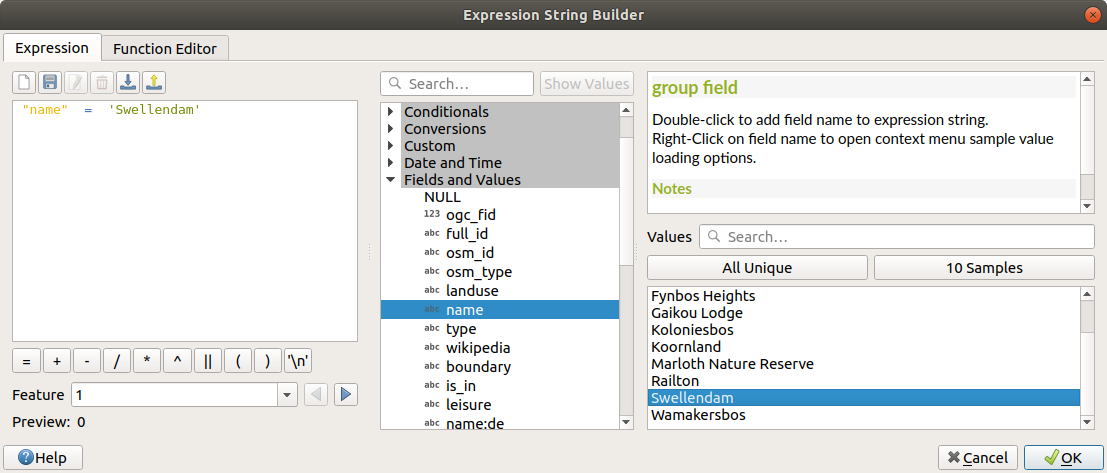
Back to the Edit rule dialog, assign it a darker grey-blue color in order to indicate the town’s importance in the region and remove the border
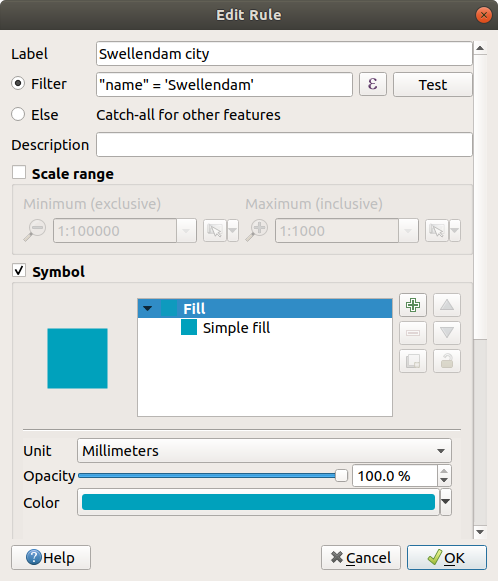
Apăsați pe OK
Repeat the steps above to add the following rules:
Other residential label with the criterion
"landuse" = 'residential' AND "name" <> 'Swellendam'. Choose a pale blue-grey Fill colorBig non residential areas label with the criterion
"landuse" <> 'residential' AND "AREA" >= 605000. Choose a mid-green color.
These filters are exclusive, in that they exclude areas on the map (non-residential areas which are smaller than 605000 (square meters) are not included in any of the rules).
We will catch the remaining features using a new rule labeled Small non residential areas. Instead of a filter expression, Check the
 Else.
Give this category a suitable pale green color.
Else.
Give this category a suitable pale green color.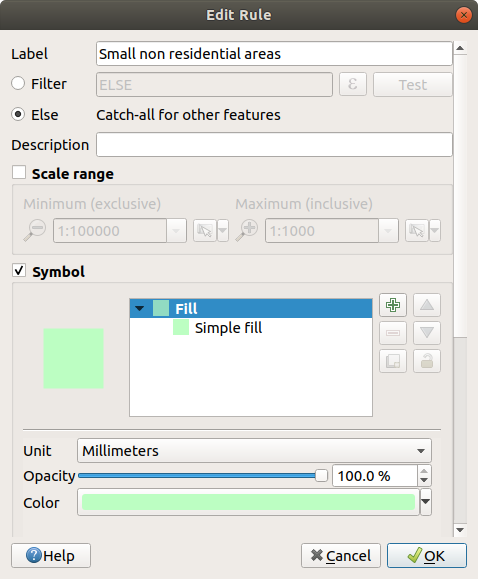
Your rules should now look like this:
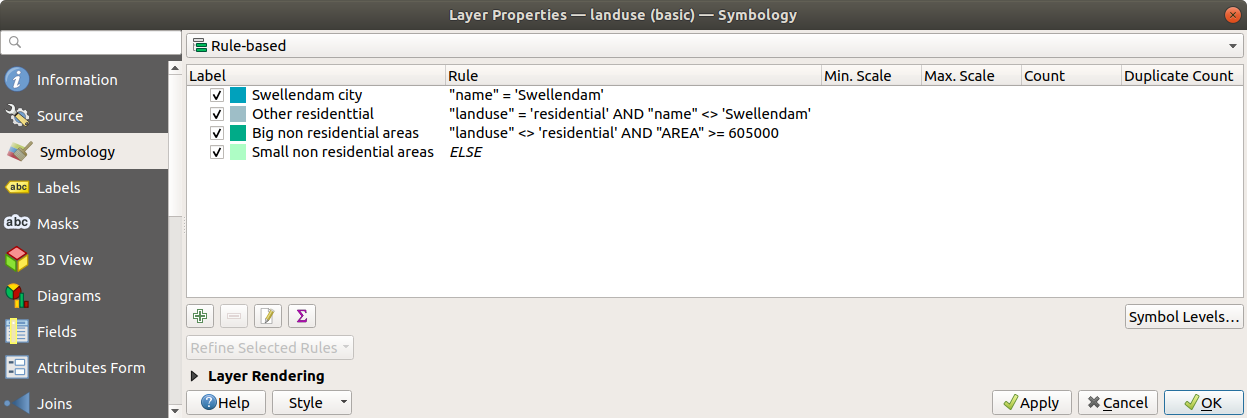
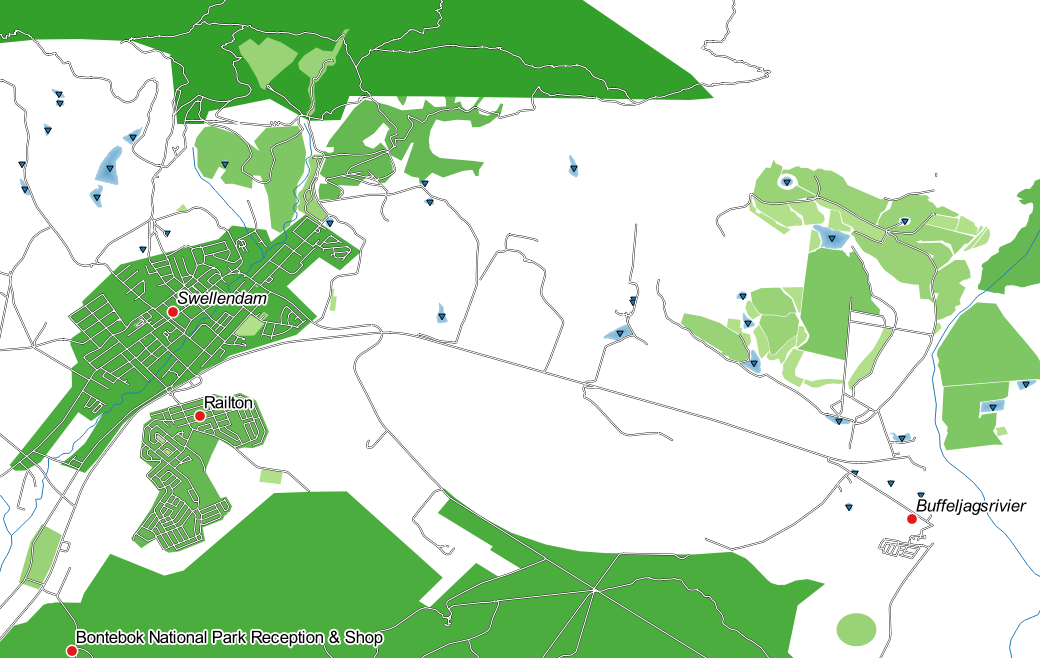
Apply this symbology
Harta dvs. va arăta în felul următor:
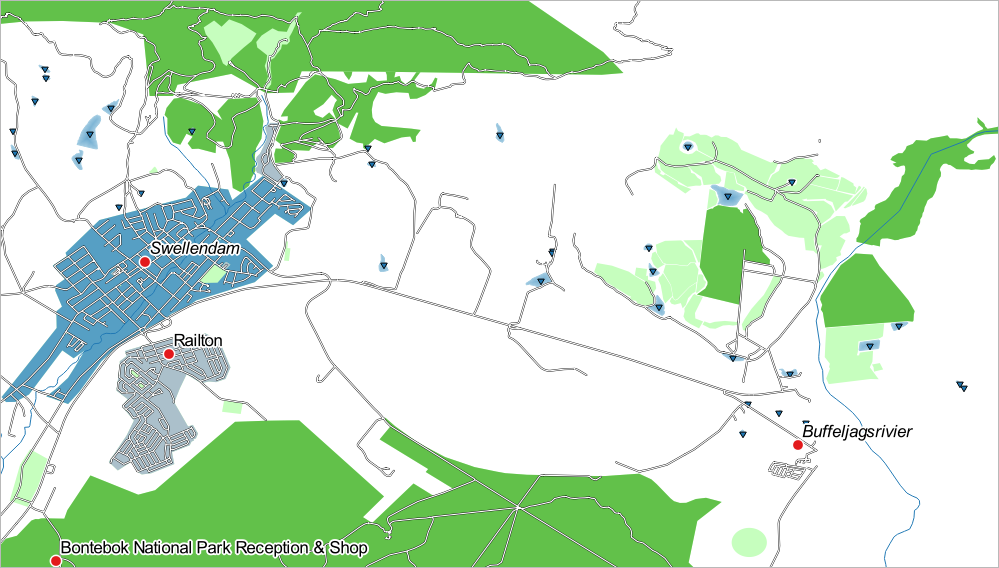
Acum aveți o hartă cu cele mai notabile zone rezidențiale din Swellendam și cu alte zone, non-rezidențiale, colorate în funcție de dimensiunea lor.
3.3.6. În concluzie
Simbologia ne permite să reprezentăm atributele unui strat într-un mod ușor de citit. Ne facilitează atât nouă, cât și utilizatorului hărții, înțelegerea semnificației entităților, utilizând atributele relevante alese. În funcție de problemele cu care ne confruntăm, vom aplica diferite tehnici de clasificare pentru a le rezolva.
3.3.7. Ce urmează?
Acum avem o hartă cu un aspect plăcut, dar oare cum o vom exporta din QGIS, într-un format tipăribil, ca imagine sau ca PDF? Asta e tema următoarei lecții!