Important
Traducerea este un efort al comunității, la care puteți să vă alăturați. În prezent, această pagină este tradusă 30.43%.
6.1. Lesson: Reprojecting and Transforming Data
Let us talk about Coordinate Reference Systems (CRSs) again. We have touched on this briefly before, but haven’t discussed what it means practically.
Scopul acestei lecții: De a reproiecta și transforma seturile de date vectoriale.
6.1.1. ★☆☆ Follow Along: Projections
The CRS that all the data, as well as the map itself are in right now is called WGS84. This is a very common Geographic Coordinate System (GCS) for representing data. But there’s a problem, as we will see.
Save your current map
Then open the map of the world which you will find under
exercise_data/world/world.qgsZoom in to South Africa by using the
 Zoom In tool
Try setting a scale in the Scale field, which is in the Statusbar along the bottom of the screen. While over South Africa, set this value to
1:5 000 000(one to five million).Pan around the map while keeping an eye on the Scale field
Notice the scale changing? That’s because you are moving away from the
one point that you zoomed into at 1:5 000 000, which was at the
center of your screen.
All around that point, the scale is different.
Pentru a înțelege de ce, gândiți-vă la un glob al Pământului. Acesta are linii care pornesc de la Nord înspre Sud. Aceste linii longitudinale sunt situate departe una de alta la ecuator, dar se întâlnesc la poli.
In a GCS, you are working on this sphere, but your screen is flat. When you try to represent the sphere on a flat surface, distortion occurs, similar to what would happen if you cut open a tennis ball and tried to flatten it out. What this means on a map is that the longitude lines stay equally far apart from each other, even at the poles (where they are supposed to meet). This means that, as you travel away from the equator on your map, the scale of the objects that you see gets larger and larger. What this means for us, practically, is that there is no constant scale on our map!
To solve this, let’s use a Projected Coordinate System (PCS) instead. A PCS „projects” or converts the data in a way that makes allowance for the scale change and corrects it. Therefore, to keep the scale constant, we should reproject our data to use a PCS.
6.1.2. ★☆☆ Follow Along: „On the Fly” Reprojection
By default, QGIS reprojects data „on the fly”. What this means is that even if the data itself is in another CRS, QGIS can project it as if it were in a CRS of your choice.
You can change the CRS of the project by clicking on the
 Current projection button in the bottom
right corner of QGIS.
Current projection button in the bottom
right corner of QGIS.
In the dialog that appears, type the word
globalinto the Filter field. A few CRSs should appear in the Predefined Reference Systems field below.Select WGS 84 / NSIDC EASE-Grid 2.0 Global | EPSG:6933 entry by clicking on it, and then click OK.
Observați modul în care forma Africii de Sud se schimbă. Toate proiecțiile lucrează prin schimbarea formelor aparente ale obiectelor de pe Terra.
Zoom to a scale of
1:5 000 000again, as before.Deplasați un pic harta.
Observați că scara rămâne la fel!
Reproiectarea „din zbor” este folosită, de asemenea, pentru a combina seturile de date aflate în diverse CRS-uri
Add another vector layer to your map which has the data for South Africa only. You will find it as
exercise_data/world/RSA.shp.Load it. A quick way to see its CRS is by hovering the mouse over the layer in the legend. It is
EPSG:3410.Ce observați?
The layer is visible even if it has a different CRS from the
continentsone.
6.1.3. ★★☆ Follow Along: Saving a Dataset to Another CRS
Sometimes you need to export an existing dataset with another CRS. As we will see in the next lesson, if you need to make distance calculations on layer, it is always better to have the layer in a projected coordinate system.
Be aware that the «on the fly» reprojection is related to the project and not to single layers. This means that a layer can have a different CRS from the project even if you see it in the correct position.
You can easily export the layer with another CRS.
Add the
buildingsdataset fromtraining_data.gpkgRight-click on the
buildingslayer in the Layers panelSelect in the menu that appears. You will be shown the Save Vector Layer as… dialog.
Click on the Browse button next to the File name field
Navigate to
exercise_data/and specify the name of the new layer asbuildings_reprojected.shp.Change the value of the CRS. Only the recent CRSs used will be shown in the drop-down menu. Click on the
 Select projection button next
to the drop-down menu.
Select projection button next
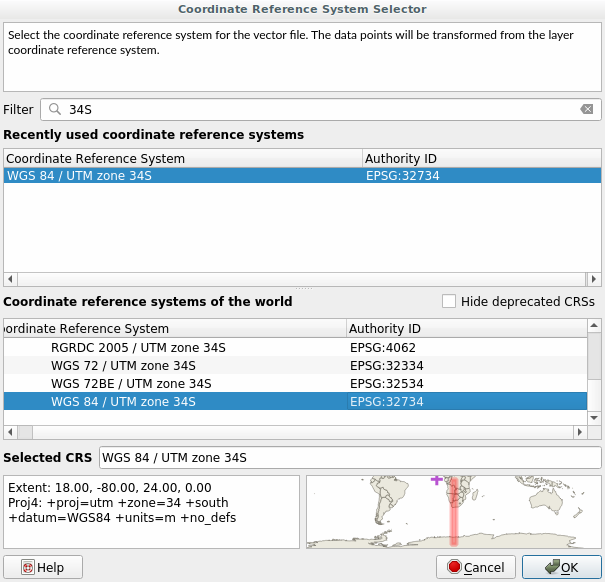
to the drop-down menu.The Coordinate Reference System Selector dialog will appear. In its Filter field, search for
34S.Select WGS 84 / UTM zone 34S | EPSG:32734 from the list
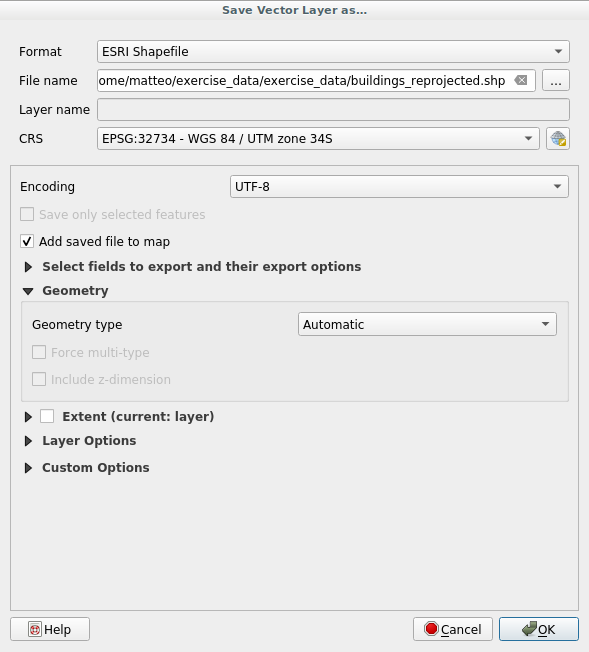
Leave the other options unchanged. The Save Vector Layer as… dialog now looks like this:
Clic pe OK
You can now compare the old and new projections of the layer and see that they are in two different CRS but they are still overlapping.
6.1.4. ★★★ Follow Along: Creating Your Own Projection
Există mai multe proiecții decât cele incluse în QGIS în mod implicit. De asemenea, puteți crea propriile proiecții.
Start a new map
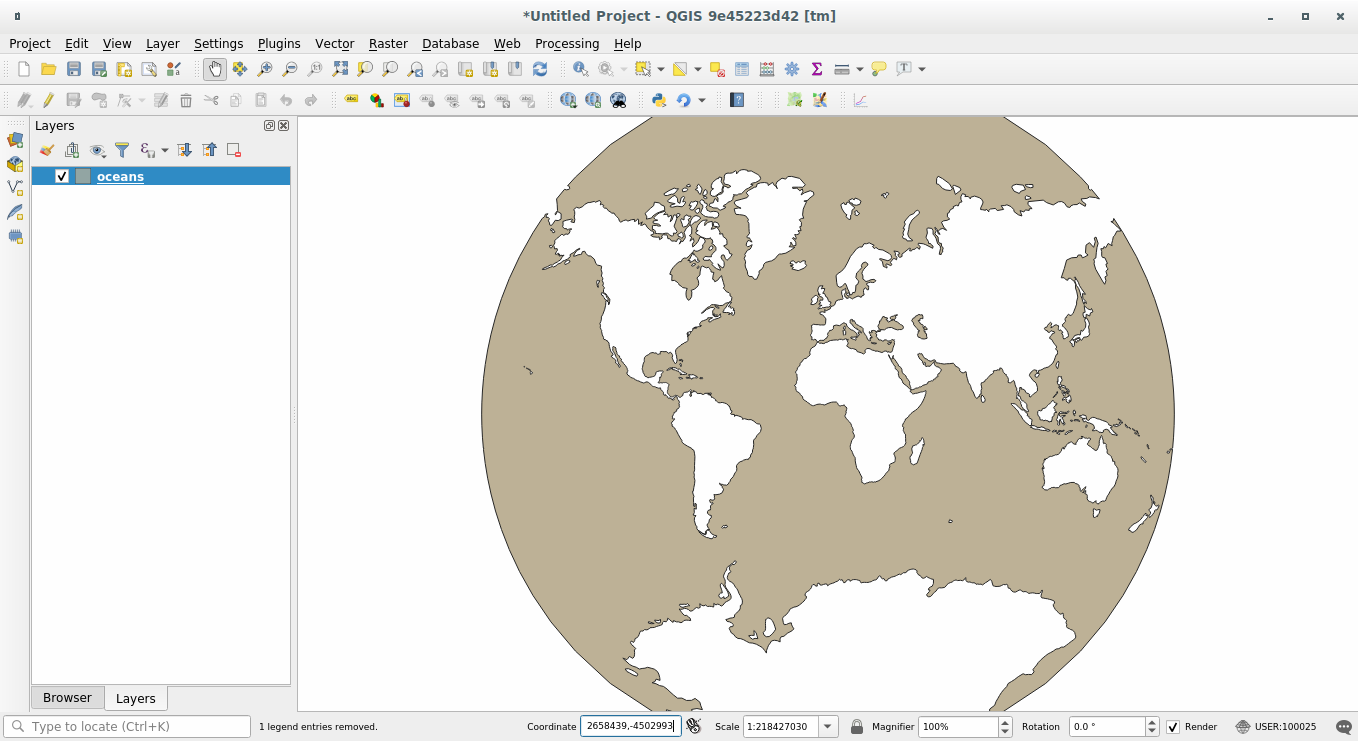
Load the
world/oceans.shpdatasetGo to and you will see this dialog.
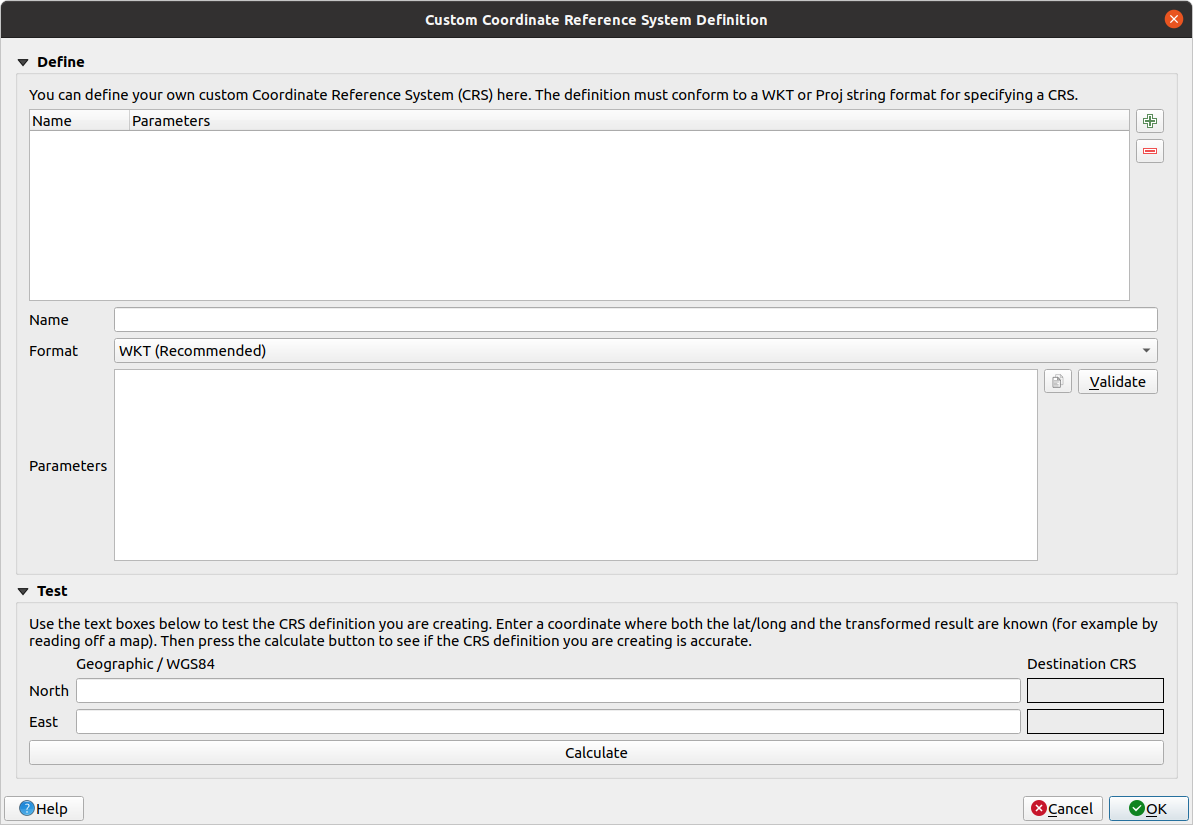
Click on the
 Add new CRS button to create a new
projection
Add new CRS button to create a new
projectionO proiecție interesant de utilizat se numește
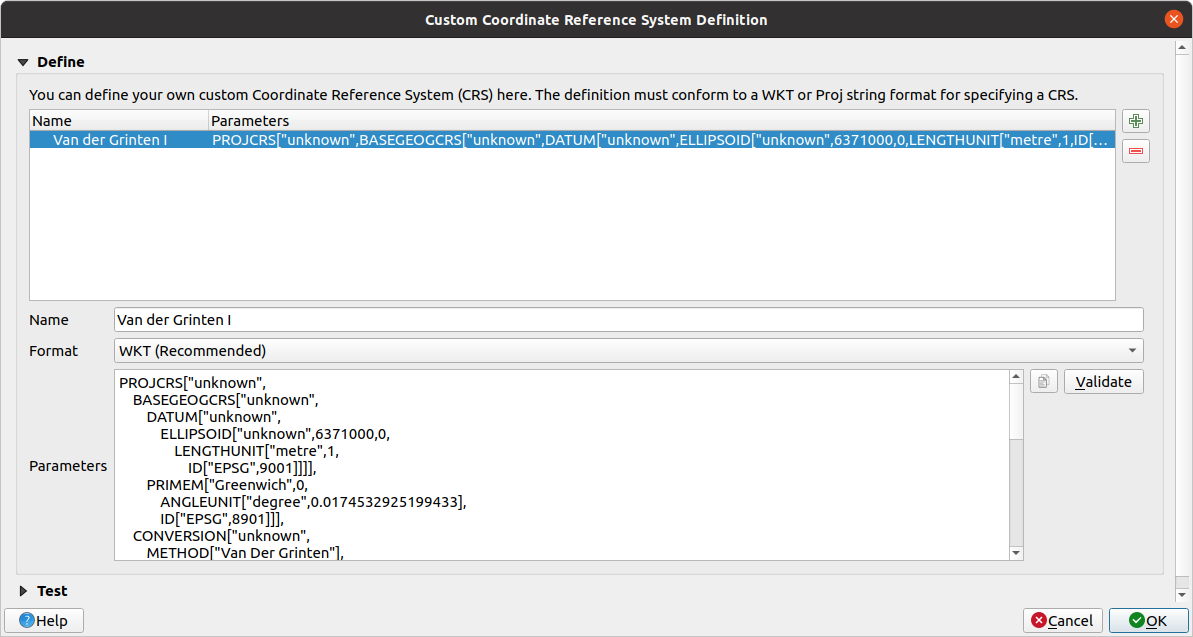
Van der Grinten I. Introduceți această denumire în câmpul Nume.Această proiecție reprezintă Pământul pe un teren circular, în locul uneia dreptunghiulară, la fel ca majoritatea celorlalte proiecții.
In Format, select WKT (Recommended)
Add the following string in the Parameters field:
PROJCRS["unknown",
    BASEGEOGCRS["unknown",
        DATUM["unknown",
            ELLIPSOID["unknown",6371000,0,
                LENGTHUNIT["metre",1,
                    ID["EPSG",9001]]]],
        PRIMEM["Greenwich",0,
            ANGLEUNIT["degree",0.0174532925199433],
            ID["EPSG",8901]]],
    CONVERSION["unknown",
        METHOD["Van Der Grinten"],
        PARAMETER["Longitude of natural origin",0,
            ANGLEUNIT["degree",0.0174532925199433],
            ID["EPSG",8802]],
        PARAMETER["False easting",0,
            LENGTHUNIT["metre",1],
            ID["EPSG",8806]],
        PARAMETER["False northing",0,
            LENGTHUNIT["metre",1],
            ID["EPSG",8807]]],
    CS[Cartesian,2],
        AXIS["(E)",east,
            ORDER[1],
            LENGTHUNIT["metre",1,
                ID["EPSG",9001]]],
        AXIS["(N)",north,
            ORDER[2],
            LENGTHUNIT["metre",1,
                ID["EPSG",9001]]]]
Clic pe OK
Click on the
Current CRS button at the
right of the status bar to change the project CRSChoose your newly defined projection (search for its name in the Filter field)
După aplicarea acestei proiecții, harta va fi reproiectată astfel:
6.1.5. În concluzie
Diferite proiecții sunt utile pentru scopuri diferite. Prin alegerea proiecția corectă, vă puteți asigura că entitățile de pe hartă sunt reprezentate cu precizie.
6.1.6. Further Reading
Materials for the Advanced section of this lesson were taken from this article.
Read further information on Coordinate Reference Systems.
6.1.7. Ce urmează?
In the next lesson you will learn how to analyze vector data using QGIS» various vector analysis tools.