Important
La traduction est le fruit d’un effort communautaire auquel vous pouvez prendre part. Cette page est actuellement traduite à 46.58%.
19. Les Tuiles Vectorielles
19.1. Que sont les tuiles vectorielles?
Les tuiles vectorielles sont des paquets de données géographiques, conditionnés en « tuiles » prédéfinies de forme approximativement carrée pour le transfert sur le web. Elles combinent des tuiles de cartes raster pré-rendues et des tuiles de cartes vectorielles. Le serveur de tuiles vectorielles renvoie des données cartographiques vectorielles, qui ont été découpées aux limites de chaque tuile, au lieu d’une image cartographique pré-rendue. Les tuiles découpées représentent les niveaux de zoom du service de tuiles vectorielles, dérivés d’une approche pyramidale. Grâce à cette structure, le transfert de données est réduit par rapport aux cartes vectorielles non découpées. Seules les données situées dans la vue actuelle de la carte et au niveau de zoom actuel doivent être transférées. De plus, par rapport à une carte raster en mosaïque, le transfert de données est également très réduit, car les données vectorielles sont généralement beaucoup plus petites qu’un bitmap rendu. Les tuiles vectorielles n’ont pas d’informations de style assignées. QGIS doit donc appliquer un style cartographique afin d’afficher les données.
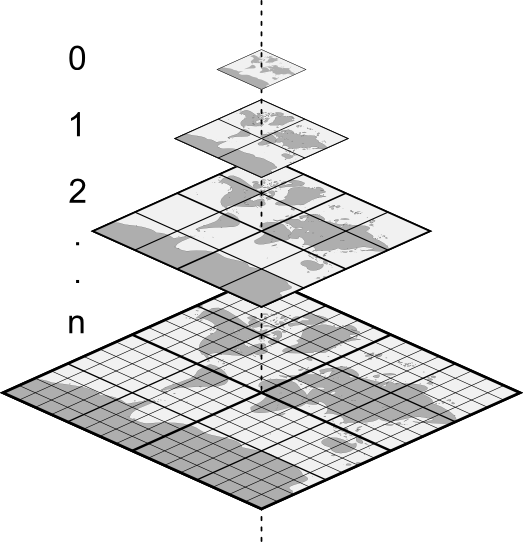
Fig. 19.1 Structure pyramidale de tuiles vectorielles avec niveaux de zoom
19.2. Formats pris en charge
Il y a un support pour les tuiles vectorielles à travers :
sources distantes (HTTP/S) - avec modèle XYZ -
type=xyz&url=http://example.com/{z}/{x}/{y}.pbffichiers locaux - avec modèle XYZ - par ex,
type=xyz&url=file:///path/to/tiles/{z}/{x}/{y}.pbfbase de données locale MBTiles - par ex,
type=mbtiles&url=file:///path/to/file.mbtiles
To load a vector tiles dataset into QGIS, use the  Vector Tile tab
in the Data Source Manager dialog.
Read Utiliser les services de tuiles vectorielles for more details.
Vector Tile tab
in the Data Source Manager dialog.
Read Utiliser les services de tuiles vectorielles for more details.
19.3. Vector Tiles Dataset Properties
The vector tiles Layer Properties dialog provides the following sections:
|
||
|


[1] Aussi disponible dans le panneau Style de Couche
19.3.1. Onglet Information
The Information tab is read-only and represents an interesting place to quickly grab summarized information and metadata on the current layer. Provided information are:
based on the provider of the layer: name, URI, source type and path, number of zoom levels
Le système de coordonnées de référence : nom, unités, méthode, précision, référence (c’est-à-dire statique ou dynamique)
picked from the filled metadata: access, extents, links, contacts, history…
19.3.2. Onglet Source
The  Source tab displays basic information about
the selected vector tile, including:
Source tab displays basic information about
the selected vector tile, including:
le nom de la couche à afficher dans le panneau couche;
the Coordinate Reference System: Displays the layer’s Coordinate Reference System (CRS). You can change the layer’s CRS, by selecting a recently used one in the drop-down list or clicking on the
 Select CRS button (see Sélectionneur de Système de Coordonnées de Référence).
Use this process only if the layer CRS is wrong or not specified.
Select CRS button (see Sélectionneur de Système de Coordonnées de Référence).
Use this process only if the layer CRS is wrong or not specified.
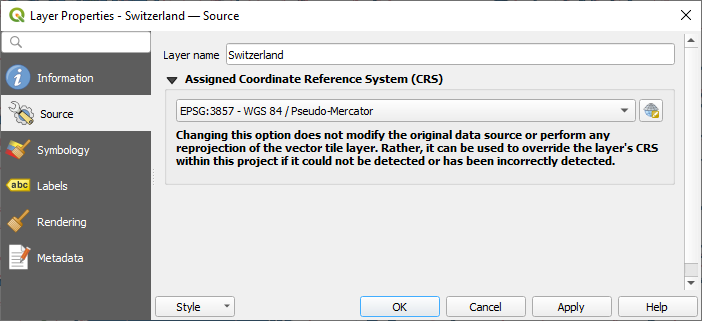
Fig. 19.2 Vector Tiles Properties - Source Dialog
19.3.3. Symbology and Labels Properties
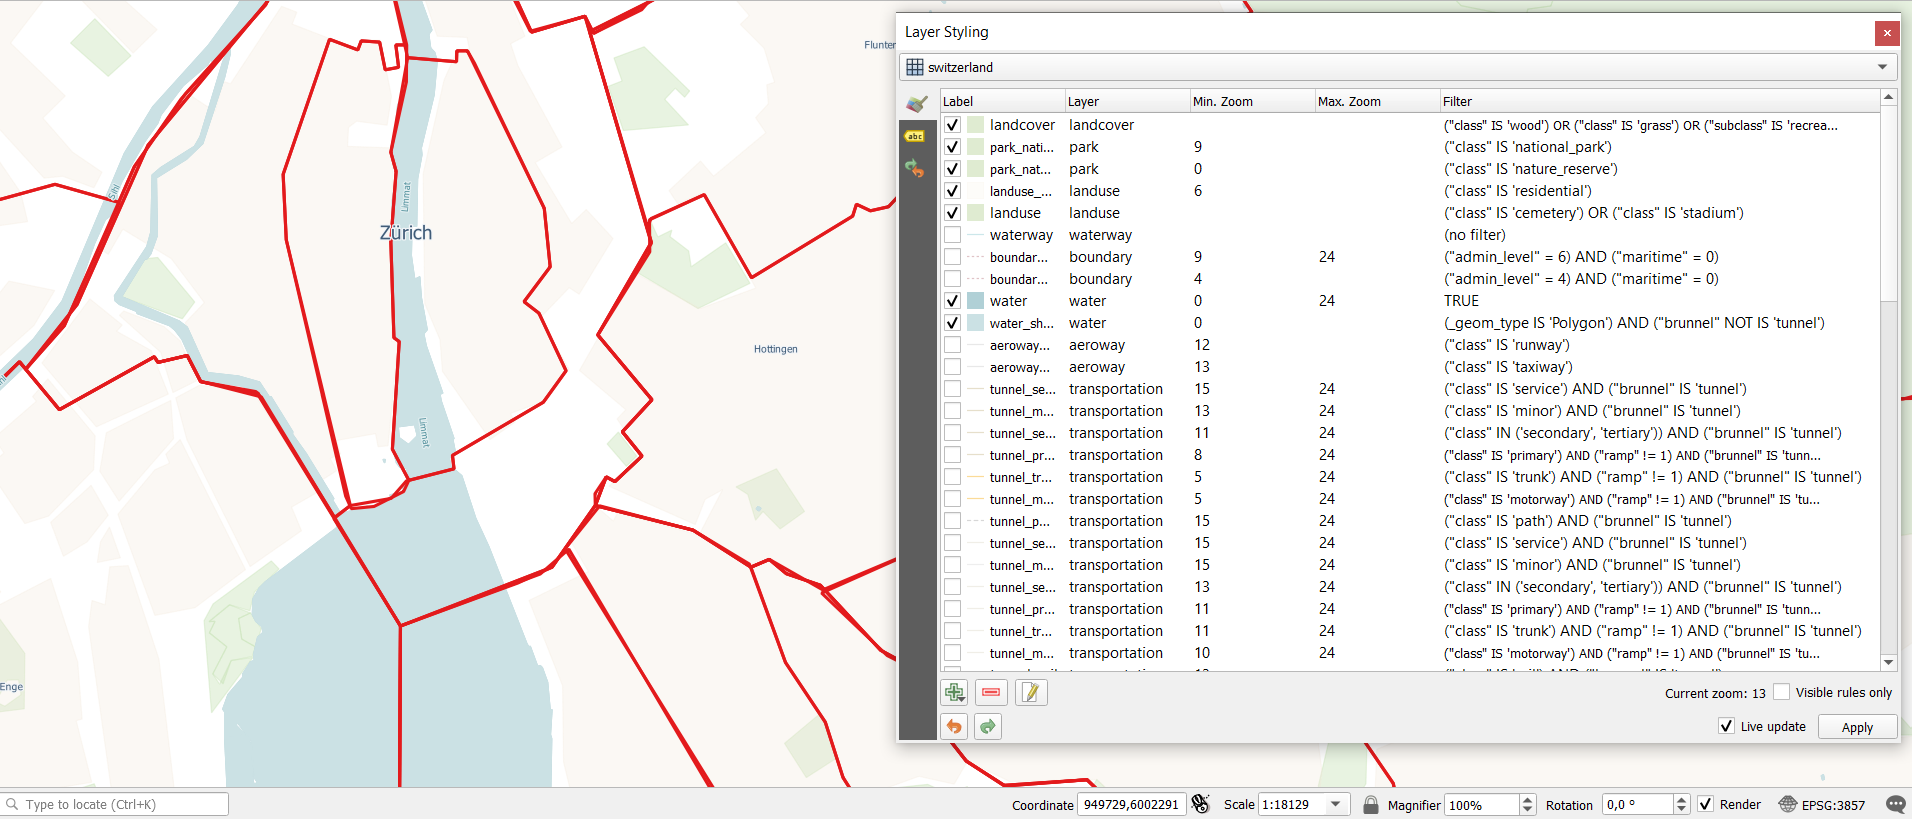
Fig. 19.3 Vector Tile Layer Symbology
19.3.3.1. Setting rules
As vector tiles consist of point, line and polygon geometries, the respective symbols are available. To apply a cartographic style (with symbology and/or labels), you can either:
Use a Style URL when creating the Vector Tiles Connection. The symbology will be shown immediately in the
 Symbology tab
after the layer is loaded in QGIS.
Symbology tab
after the layer is loaded in QGIS.Or build your own symbology and labeling in the corresponding tabs of the layer properties. By default, QGIS assigns an identical symbol to the features based on their geometry type.
In both cases, setting a style for a vector tile relies on a set of rules applied to the features, indicating:
a Label, a title for comprehensive identification of the rule
the name of a particular Layer the rule should apply to, if not applied to
(all layers)a Min. Zoom and a Max. Zoom, for the range of display. Symbology and labeling can be dependent on the zoom level.
a Filter, a QGIS expression to identify the features to apply the style to
Each rule is added pressing the  Add rule button
and selecting the type of symbols (Marker, Line, Fill)
corresponding to the features geometry type.
You can as well
Add rule button
and selecting the type of symbols (Marker, Line, Fill)
corresponding to the features geometry type.
You can as well  Remove selected rules or
  Edit current rule.
At the bottom the Current Zoom is shown.
Check the  Visible rules only option at the top of the dialog
to filter the list of rules to only those that are visible at the current zoom level.
This makes it easier to work with complex vector styling and to locate troublesome rules.
The
Visible rules only option at the top of the dialog
to filter the list of rules to only those that are visible at the current zoom level.
This makes it easier to work with complex vector styling and to locate troublesome rules.
The  Filter rules text box also helps you easily find a rule,
by searching the Label, Layer and Filter fields.
Filter rules text box also helps you easily find a rule,
by searching the Label, Layer and Filter fields.
In Fig. 19.3 we set up style for the OpenStreetMap landuse layer.
For better visibility most of the rules are deselected.
19.3.3.2. Rendu de couche
From the Symbology tab, you can also set some options that invariably act on all features of the layer:
Opacity: You can make the underlying layer in the map canvas visible with this tool. Use the slider to adapt the visibility of your vector layer to your needs. You can also make a precise definition of the percentage of visibility in the menu beside the slider.
Blending mode: You can achieve special rendering effects with these tools that you may previously only know from graphics programs. The pixels of your overlaying and underlaying layers are mixed through the settings described in Modes de fusion.
19.3.3.3. Styles
Available at the bottom of most of the tabs, the menu provides shortcuts to save, load, create, switch styles to apply to the vector tiles. Vector tiles can have their style saved from QGIS as QML files and they can be imported as:
QML files (QML - Le format de fichier de style QGIS)
MapBox GL Json style configuration files
More details at Sauvegarder et Partager les propriétés d’une couche.
19.3.4. Onglet Rendu
Under Scale dependent visibility,
you can set the Maximum (inclusive)
and Minimum (exclusive) scales,
defining a range of scales in which features will be visible.
Out of this range, they are hidden.
The  Set to current canvas scale button helps you
use the current map canvas scale as boundary of the range visibility.
See Sélecteur de visibilité définie par l’échelle for more information.
Set to current canvas scale button helps you
use the current map canvas scale as boundary of the range visibility.
See Sélecteur de visibilité définie par l’échelle for more information.
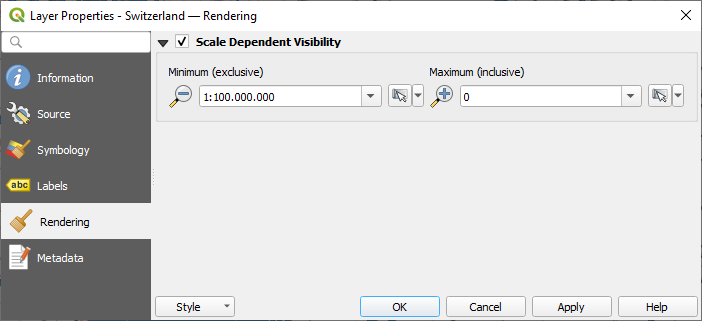
Fig. 19.4 Vector Tiles Properties - Rendering Dialog
19.3.5. Onglet Métadonnées
L’onglet  Métadonnées vous offre des options pour créer et modifier un rapport de métadonnées sur votre couche. Voir Métadonnées pour plus d’informations.