Wichtig
Übersetzen ist eine Gemeinschaftsleistung - Sie können mitmachen <https://qgis.org/en/site/getinvolved/translate.html#becoming-a-translator>`_. Diese Seite ist aktuell zu 31.82% übersetzt.
17.9. Das Verarbeitung Log
Bemerkung
Diese Lektion beschreibt das Verarbeitungsprotokoll.
Alle Analysen, die in der Verarbeitungsumgebung ausgeführt werden, werden von QGIS protokolliert. Damit erhält man zusätzliche Informationen, was bei der Ausführung der Verarbeitungswerkzeuge getan wurde. Es erleichert die Lösung von auftretenden Problemen und erlaubt die Wiederholung vorhergehender Operationen, da die Protokollierung auch interaktive Elemente einschließt.
To open the log, click on the balloon at the bottom right, on the QGIS status bar. Some algorithms might leave here information about their execution. For instance, those algorithms that call an external application usually log the console output of that application to this entry. If you have a look at it, you will see that the output of the SAGA algorithm that we just run (and that fails to execute because input data was not correct) is stored here.
Das hilft uns zu verstehen, was passiert ist. Erfahrene Benutzer sind in der Lage, die Ausgabe zu analysieren und herauszufinden, warum der Algorithmus mit einem Fehler beendet wurde. Wenn Sie kein erfahrener Nutzer sind, kann die Ausgabe durch andere zur Fehlerdiagnose verwendet werden. Es könnte sich um ein Problem bezüglich der Installation von externer Software oder um ein Problem mit den verwendeten Daten handeln.
Selbst wenn ein Algorithmus ausgeführt werden konnte, können Warnungen im Protokoll erstellt werden, wenn das Resultat falsch sein könnte. Wenn z.B. ein Algorithmus zur Interpolation mit nur einer sehr geringen Anzahl von Punkten ausgeführt wird, erzeugt der Algorithmus vermutlich ein Ergebnis - es ist aber wahrscheinlich nicht richtig, da mehr Punkte verwendet werden sollten. Wenn einige Aspekte von Algorithmen nicht ganz klar sind, ist es sinnvoll, sich die Warnungen regelmäßig anzusehen.
From the menu, you’ll find algorithms that are executed, regardless of they are executed from the GUI or from the console (which will be explained later in this manual). The execution is stored in this dialog as a console call. That means that everytime you run an algorithm, a console command is added to the log, and you have the full history of your working session. Here is how that history looks like:
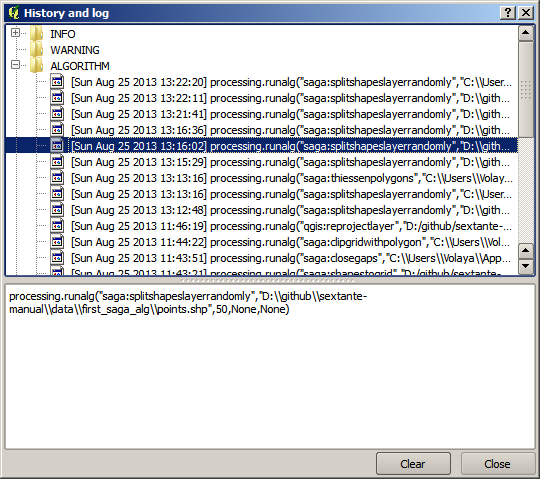
Das ist sehr nützlich, sobald man anfängt mit der Konsole zu arbeiten. Man erlernt die Syntax der Algorithmen in der Konsole. Wir werden uns damit beschäftigen, wenn wir Analysen von der Konsole aus betrachten.
17.9.1. ★☆☆ Follow Along
The history is also interactive, and you can run any previous algorithm just by double-clicking on its entry. This is an easy way of replicating the work we already did before.
For instance, try the following:
Open the data corresponding to the first chapter of this manual and run the algorithm explained there.
Now go to the log dialog and locate the last algorithm in the list, which corresponds to the algorithm you have just run.
Double-click on it and a new result should be produced, just like when you run it using the normal dialog and calling it from the toolbox.
17.9.2. ★★★ Advanced
You can also modify the algorithm.
Copy the algorithm call
Open the
Paste your copy to run the analysis; change the text at will.
To display the resulting file, type:
iface.addVectorLayer('/path/filename.shp', 'Layer name in legend', 'ogr')
Otherwise, you can use:
processing.runAndloadResults