Important
Traducerea este un efort al comunității, la care puteți să vă alăturați. În prezent, această pagină este tradusă 33.96%.
3.1. Lesson: Vector Attribute Data
Datele vectoriale sunt, fără îndoială, cel mai comun tip de date utilizate zilnic în GIS. Modelul vectorial reprezintă locația și forma entităților geografice cu ajutorul punctelor, liniilor și poligoanelor (iar pentru datele 3D, de asemenea, cu ajutorul suprafețelor și volumelor), în timp ce celelalte proprietăți ale acestora sunt incluse ca atribute (deseori prezentate sub formă de tabel în QGIS).
Până în prezent, nici una dintre schimbările pe care le-am adus hărții nu au fost influențate de obiectele afișate. Cu alte cuvinte, toate zonele de utilizare a terenurilor și toate drumurile arată la fel. Atunci când văd o hartă, privitorii nu știu nimic despre drumurile pe care le observă; doar faptul că există un drum de o anumită formă, într-o anumită zonă.
Adevărata putere a GIS-ului constă în faptul că toate obiectele care sunt vizibile pe harta au, la rândul lor, atribute. Hărțile dintr-un GIS nu sunt doar imagini. Ele reprezintă nu numai obiectele din locații, dar, ci și informații despre aceste obiecte.
The goal for this lesson: To learn about the structure of vector data and explore the attribute data of an object
3.1.1. ★☆☆ Follow Along: Viewing Layer Attributes
De asemenea, este important de știut că datele cu care lucrați nu reprezintă doar locul „unde” se află obiectele în spațiu, dar vă spun și ce sunt acele obiecte.
From the previous exercise, you should have the protected_areas layer
loaded in your map. If it is not loaded, then you can find the
protected_areas.shp ESRI Shapefile format dataset in directory
exercise_data/shapefile.
The polygons representing the protected areas constitute the spatial data, but we can learn more about the protected areas by exploring the attribute table.
In the Layers panel, click on the
protected_areaslayer to select it.In the menu, click the
 Open Attribute Table button (also accessible from top toolbars buttons).
This will open a new window showing the attribute table of the
Open Attribute Table button (also accessible from top toolbars buttons).
This will open a new window showing the attribute table of the protected_areaslayer.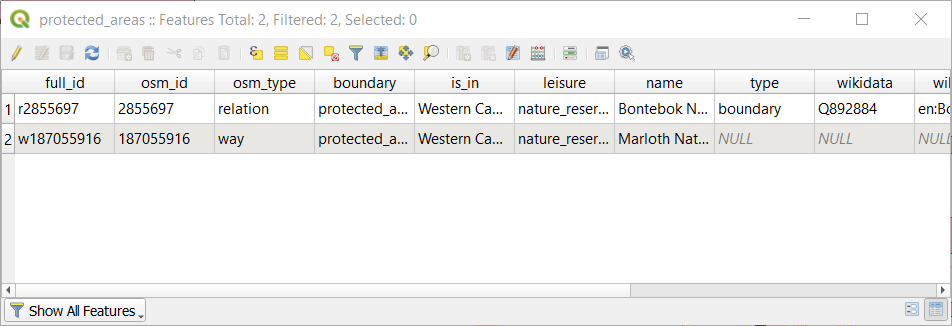
A row is called a record and is associated with a feature in the Canvas Map, such as a polygon. A column is called a field (or an attribute), and has a name that helps describe it, such as
nameorid. Values in the cells are known as attribute values. These definitions are commonly used in GIS, so it is good to become familiar with them.In the
protected_areaslayer, there are two features, which are represented by the two polygons we see on the Map Canvas.Notă
In order to understand what the fields and attribute values represent, one may need to find documentation (or metadata) describing the meaning of the attribute values. This is usually available from the creator of the data set.
Next, let’s see how a record in the attribute table is linked to a polygon feature that we see on the Map Canvas.
Reveniți la fereastra QGIS principală.
In the menu, click on the
 Select Feature(s) button.
Asigurați-vă că stratul
protected_areaseste încă selectat în panoul Straturilor.Move your mouse to the Map Canvas and left click on the smaller of the two polygons. The polygon will turn yellow indicating it is selected.
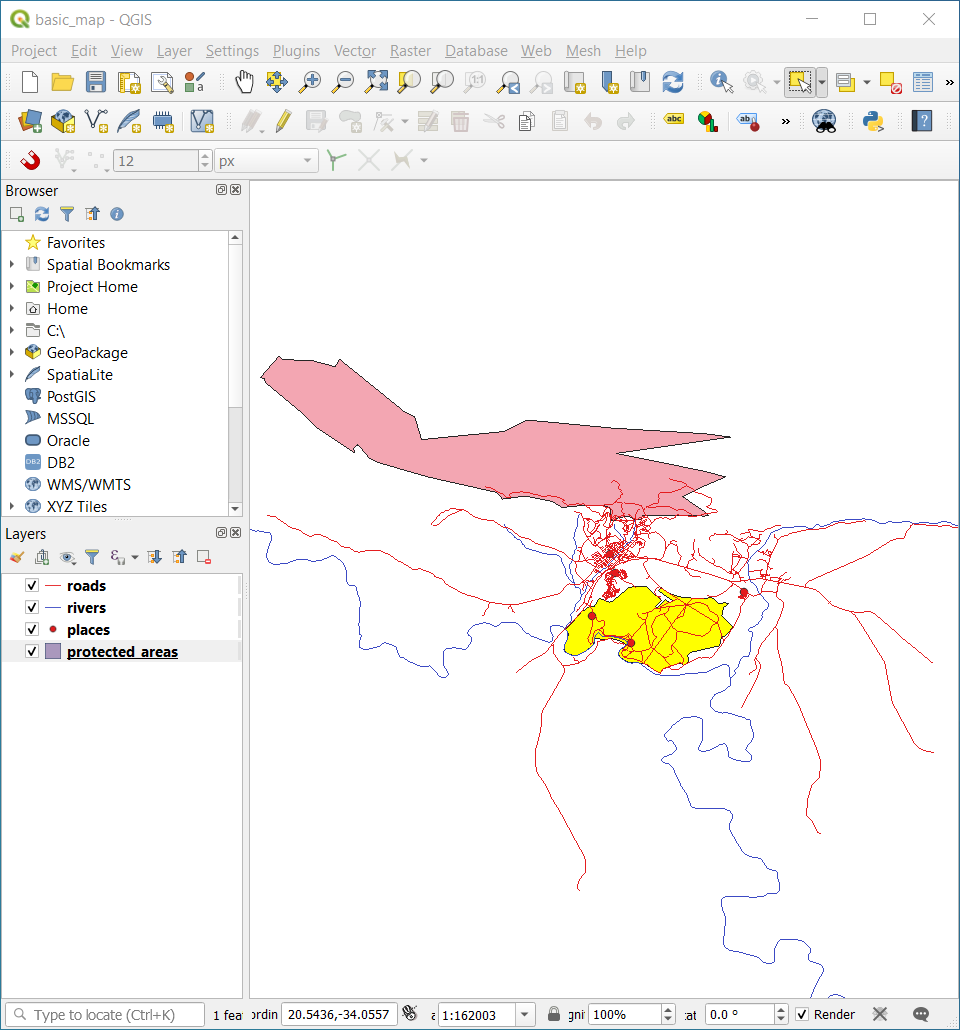
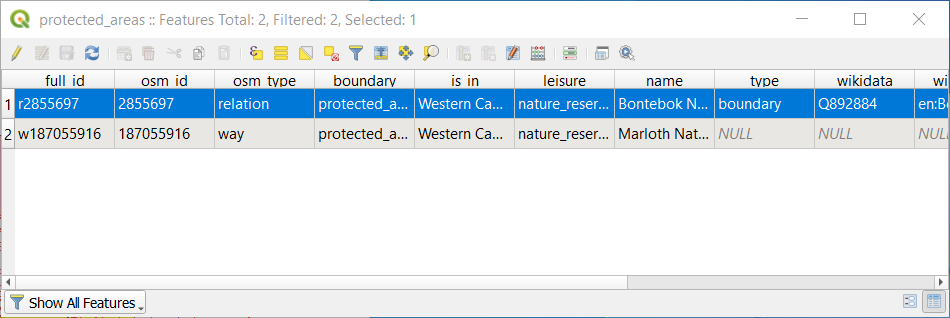
Go back to the Attribute Table window, and you should see a record (row) highlighted. These are the attribute values of the selected polygon.
De asemenea, puteți selecta o entitate folosind Tabela de Atribute.
In the Attribute Table window, on the far left, click on the row number of the record that is currently not selected.
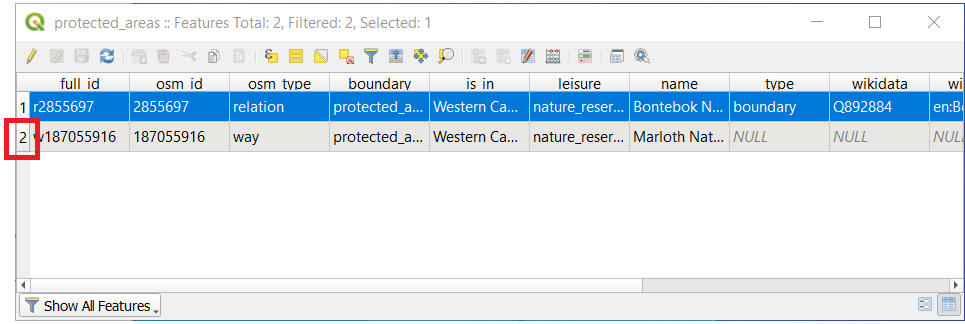
Go back to the main QGIS window and look at the Map Canvas. You should see the larger of the two polygons colored yellow.
To deselect the feature, go to the Attribute Table window and click on
 Deselect all features from the layer button.
Sometimes there are many features shown on the Map Canvas and it might be difficult to see which feature is selected from the Attribute Table. Another way to identify the location of a feature is to use the Flash Feature tool.
In the Attribute Table, right-click on any cell in the row that has the attribute value
r2855697for the fieldfull_id.In the context menu, click on Flash Feature and watch the Map Canvas.
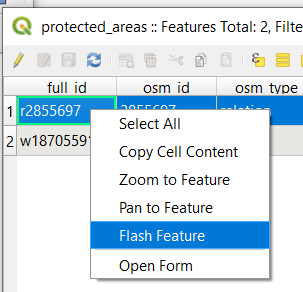
You should see the polygon flash red a few times. If you missed it, try it again.
Another useful tool is the Zoom to Feature tool, that tells QGIS to zoom to the feature of interest.
In the Attribute Table, right-click on any cell in the row that has the attribute value
r2855697for the fieldfull_id.In the context menu, click on Zoom to Feature
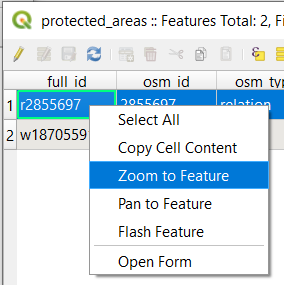
Look at the Map Canvas. The polygon should now occupy the extent of the Map Canvas area.
Acum, puteți închide tabelul de atribute.
3.1.2. ★☆☆ Try Yourself: Exploring Vector Data Attributes
How many fields are available in the
riverslayer?Tell us a bit about the
townplaces in your dataset.Open the attribute table for the
placeslayer. Which field would be the most useful to represent in label form, and why?
Răspuns
There should be 9 fields in the
riverslayer:Select the layer in the Layers panel.
Right-click and choose Open Attribute Table, or press the
button on the Attributes Toolbar
(it can be enabled from menu).Totalizează numărul de coloane.
A quicker approach could be to double-click the
riverslayer, open the tab, where you will find a numbered list of the table’s fields.Information about towns is available in the
placeslayer. Open its attribute table as you did with theriverslayer: there are two features whose place attribute is set totown: Swellendam and Buffeljagsrivier. You can add comment on other fields from these two records, if you like.The
namefield is the most useful to show as labels. This is because all its values are unique for every object and are very unlikely to contain NULL values. If your data contains some NULL values, do not worry as long as most of your places have names.
3.1.3. În concluzie
Acum știți cum să folosiți tabelul de atribute pentru a vedea ceea ce se află, de fapt, în datele pe care îl utilizați. Orice set de date va fi util pentru dvs. numai dacă are atributele care vă interesează. Dacă știți de care atribute aveți nevoie, puteți decide rapid dacă puteți utiliza un anumit set de date, sau dacă trebuie să căutați un altul care are datele cerute.
3.1.4. Ce urmează?
Diferite atribute sunt utile pentru diferite scopuri. Unele dintre ele pot fi reprezentate direct sub formă de text, pentru ca utilizatorul sa le poată vedea. Veți afla cum să faceți acest lucru în lecția următoare.