Důležité
Translation is a community effort you can join. This page is currently translated at 31.98%.
2.4. Lesson: Symbology
Symbolika vrstvy je její zobrazení na mapě. Základní síla GIS ve srovnání s jinými způsoby, jak zobrazovat data pomocí prostorových aspektů je to, že s GIS máte dynamické vizuální znázornění dat, se kterým pracujete.
Proto, je vizuální vzhled mapy (která závisí na symbolice jednotlivých vrstev), velmi důležitý. Koncový uživatel map by měl být schopen snadno poznat, co mapa znázorňuje. Stejně tak je důležité, mít možnost zkoumat data, se kterými pracujete a dobrá symbolika vám v tom hodně pomůže.
Jinými slovy, mít vhodnou symboliku nemáte pouze pro luxus nebo kvůli kráse. Ve skutečnosti je to nezbytné, pro správné používání GISu a vytváření map a informací, které budou lidé moci používat.
Cíl této lekce: Být schopen vytvořit libovolnou symboliku, kterou chcete pro jakoukoli vektorovou vrstvu.
2.4.1. ★☆☆ Follow Along: Changing Colors
To change a layer’s symbology, open its Layer Properties. Let’s
begin by changing the color of the landuse layer.
Right-click on the
landuselayer in the layers list.Select the menu item Properties… in the menu that appears.
Poznámka
Ve výchozím nastavení můžete také jít do vlastností vrstvy dvojitým kliknutím na vrstvu v seznamu vrstev.
Tip
The
 button at the top of the Layers
panel will open the Layer Styling panel. You can use this
panel to change some properties of the layer: by default, changes will be
applied immediately!
button at the top of the Layers
panel will open the Layer Styling panel. You can use this
panel to change some properties of the layer: by default, changes will be
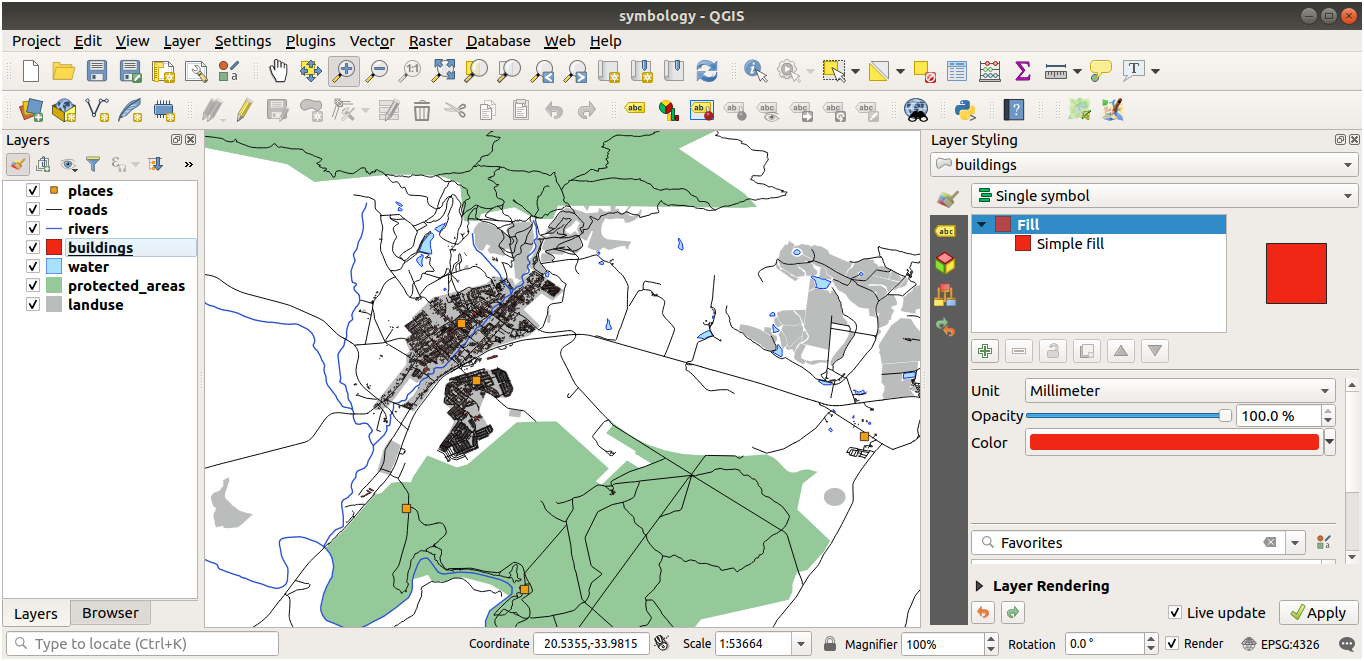
applied immediately!In the Layer Properties window, select the
Symbology tab: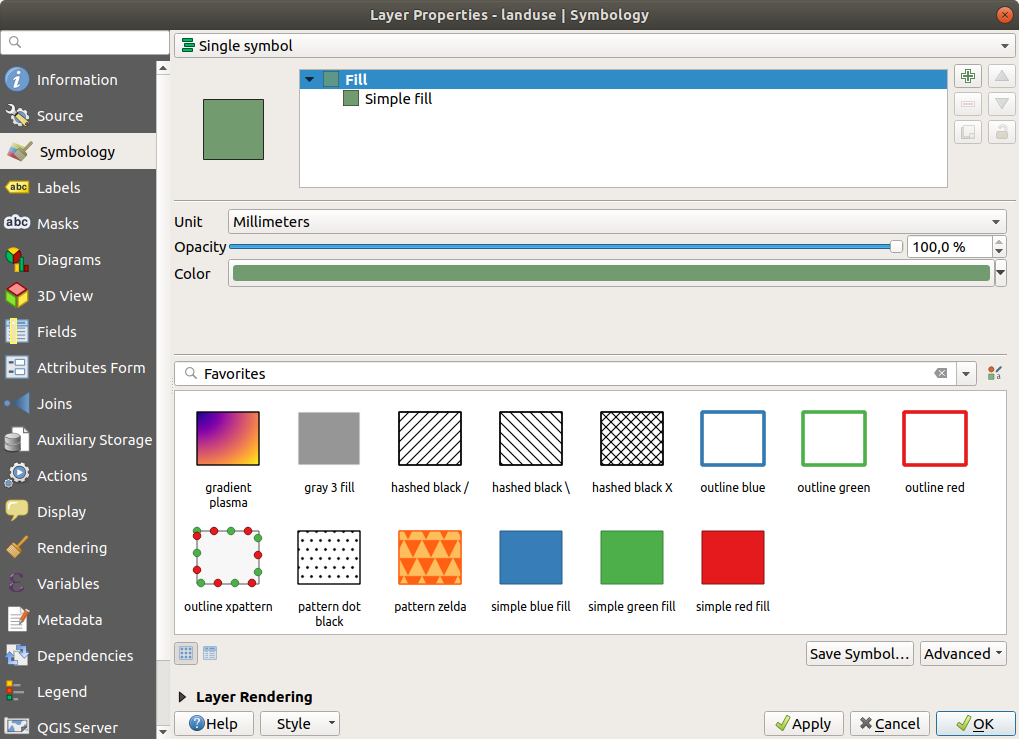
Click the color select button next to the Color label. A standard color dialog will appear.
Vyberte šedou barvu a klikněte na OK.
Kliknutěte znovu na OK v okně Layer Properties a uvidíte, že se změna barvy aplikuje na vrstvu.
2.4.2. ★☆☆ Try Yourself:
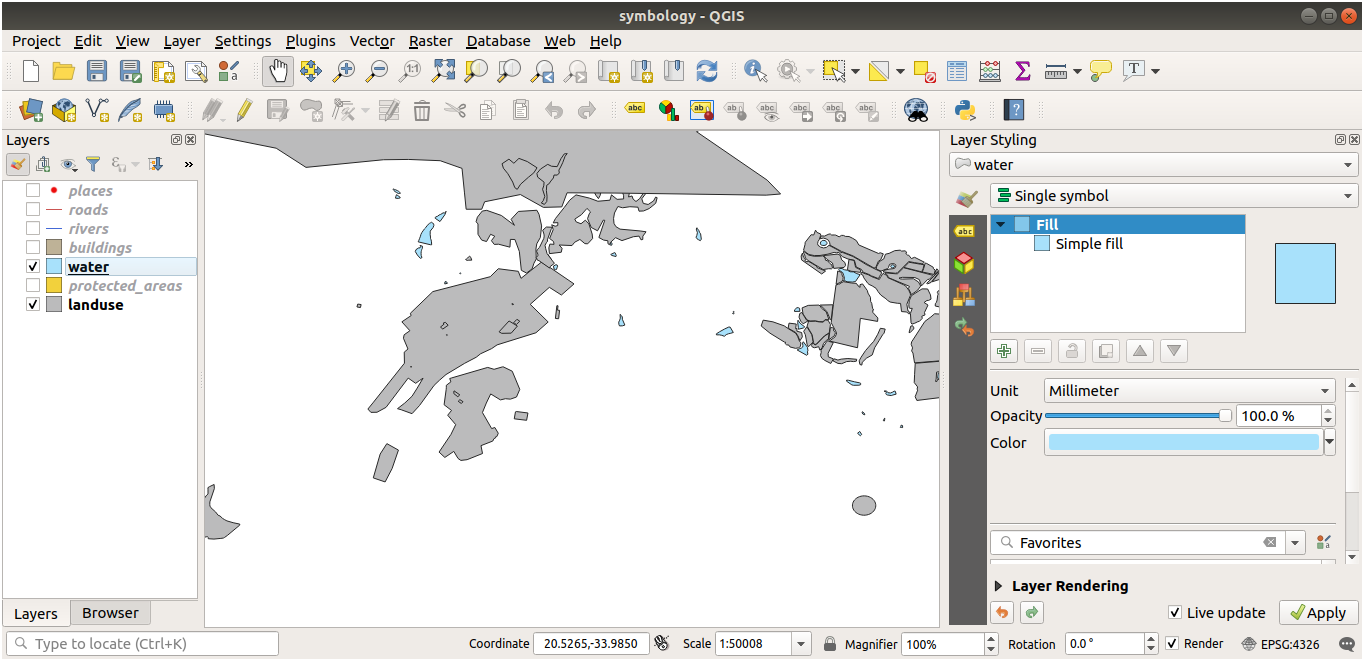
Change the color of the water layer to light blue. Try to use the
Layer Styling panel instead of the Layer Properties menu.
Solution
Verify that the colors are changing as you expect them to change.
It is enough to select the
waterlayer in the legend and then click on the Open the Layer Styling panel button. Change the color
to one that fits the water layer.
If you want to work on only one layer at a time and don’t want the other layers to distract you, you can hide a layer by clicking in the checkbox next to its name in the layers list. If the box is blank, then the layer is hidden.
2.4.3. ★☆☆ Follow Along: Changing Symbol Structure
To je velmi dobrá věc, ale v symbolice vrstvy je více než jen barva. Dále chceme vyloučit hranice mezi různými oblastmi využití půdy tak, aby mapa byla co nejméně vizuálně zaplněna.
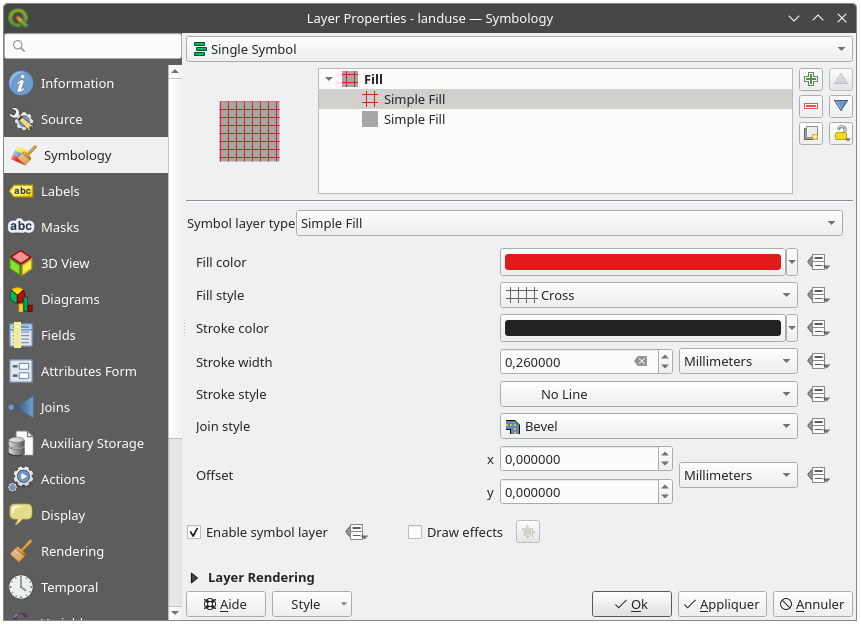
Open the Layer Properties window for the
landuselayer.Under the
Symbology tab, you will see the same kind
of dialog as before. This time, however, you’re doing more than just quickly
changing the color.In the symbol layers tree, expand the Fill dropdown and select the Simple fill option.
Click on the Stroke style dropdown. At the moment, it should be showing a short line and the words Solid Line.
Change this to No Line.
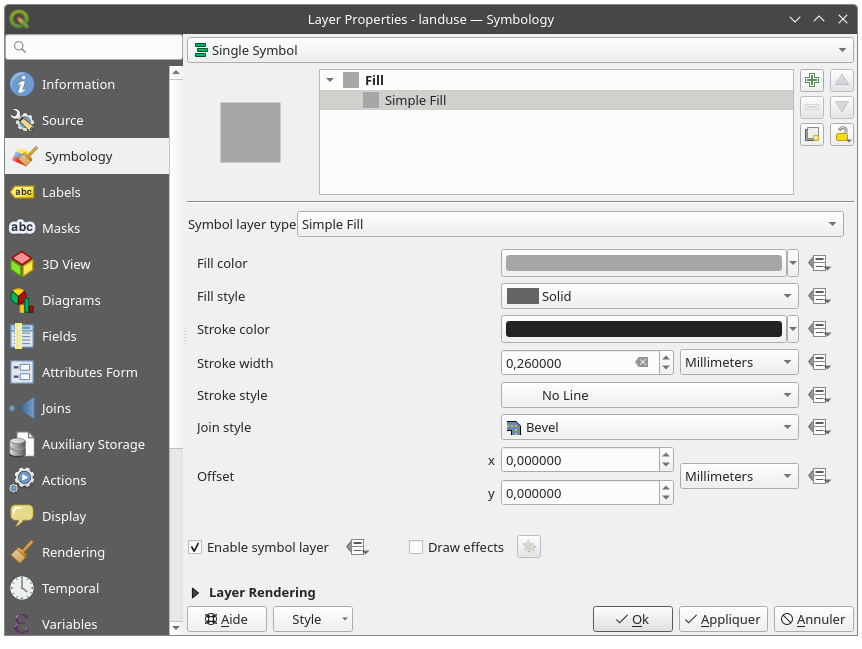
Kliknout OK.
Now the landuse layer won’t have any lines between areas.
2.4.4. ★☆☆ Try Yourself:
Change the
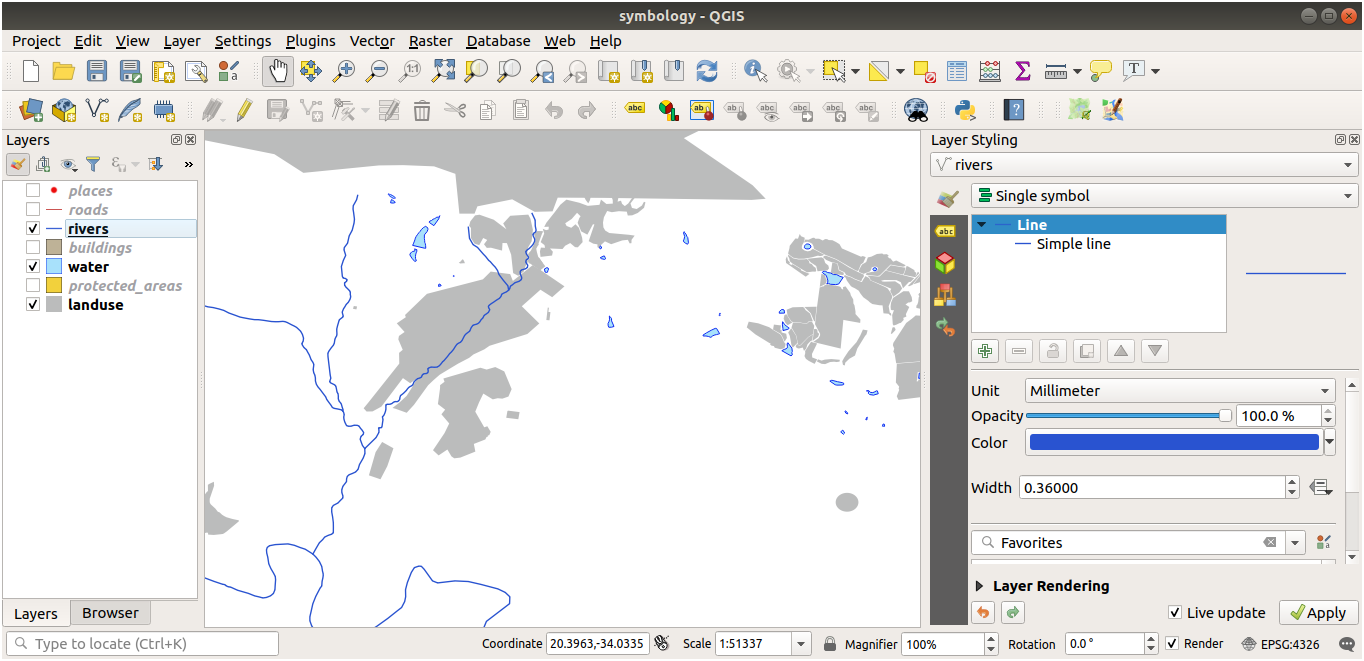
waterlayer’s symbology again so that it has a darker blue outline.Change the
riverslayer’s symbology to a sensible representation of waterways.
Remember: you can use the Open the Layer Styling panel
button and see all the changes instantly. That panel also allows you to undo
individual changes while symbolizing a layer.
Answer
Your map should now look like this:
If you are a Beginner-level user, you may stop here.
Use the method above to change the colors and styles for all the remaining layers.
Try using natural colors for the objects. For example, a road should not be red or blue, but can be gray or black.
Also feel free to experiment with different Fill style and Stroke style settings for the polygons.
2.4.5. ★★☆ Follow Along: Scale-Based Visibility
Někdy zjistíte, že vrstva není vhodná pro dané měřítko. Například soubor dat ze všech kontinentů může mít nízký detail, a nemusí být velmi přesný na úrovni ulic. Když se to stane, budete chtít mít možnost, datovou sadu v nevhodných měřítkách, skrýt.
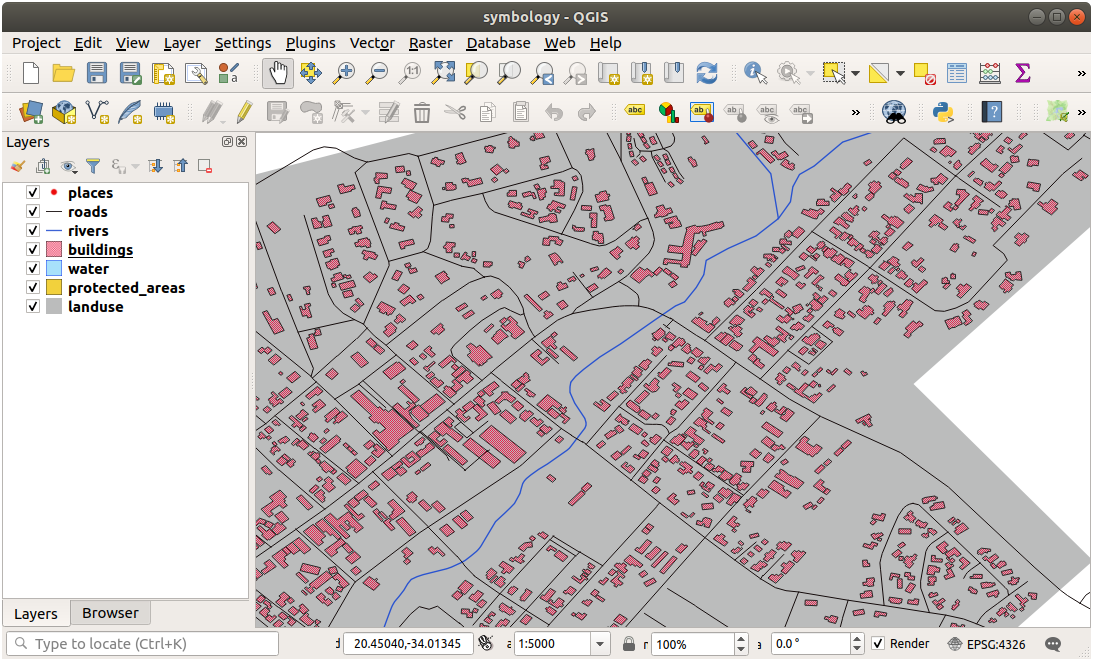
In our case, we may decide to hide the buildings from view at small scales. This map, for example…
… není velmi užitečná. Budovy jsou v tomto měřítku těžko rozlišitelné.
Chcete-li povolit vykreslování založené na měřítku:
Open the Layer Properties dialog for the
buildingslayer.Activate the
 Rendering tab.
Enable scale-based rendering by clicking on the checkbox labeled Scale dependent visibility:
Change the Minimum value to
1:10000.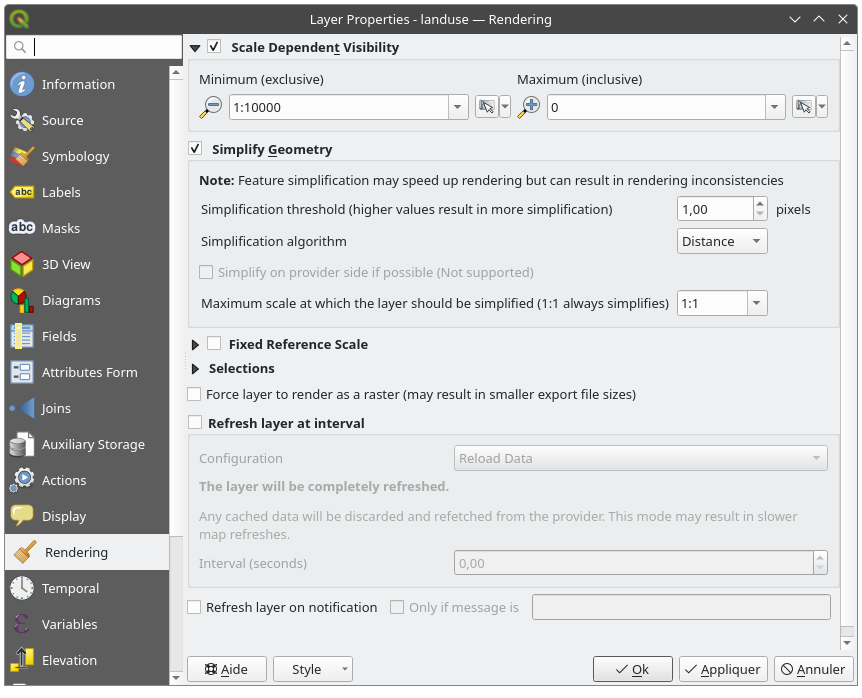
Kliknout OK.
Test the effects of this by zooming in and out in your map, noting when the
buildings layer disappears and reappears.
Poznámka
Můžete použít kolečko myši pro zvýšení přiblížení. Můžete použít alternativní nástroje, pro přibližování v okně:


2.4.6. ★★☆ Follow Along: Adding Symbol Layers
Nyní, když víte, jak změnit jednoduchou symboliku vrstev, dalším krokem je vytvoření složitější symboliky. QGIS toto umožňuje provést pomocí vrstev symbolů.
Go back to the
landuselayer’s symbol properties panel (by clicking Simple fill in the symbol layers tree).In this example, the current symbol has no outline (i.e., it uses the No Line border style).
Select the Fill level in the tree and click the
 Add symbol layer button.
The dialog will change to look something like this, with a new symbol layer
added:
Add symbol layer button.
The dialog will change to look something like this, with a new symbol layer
added: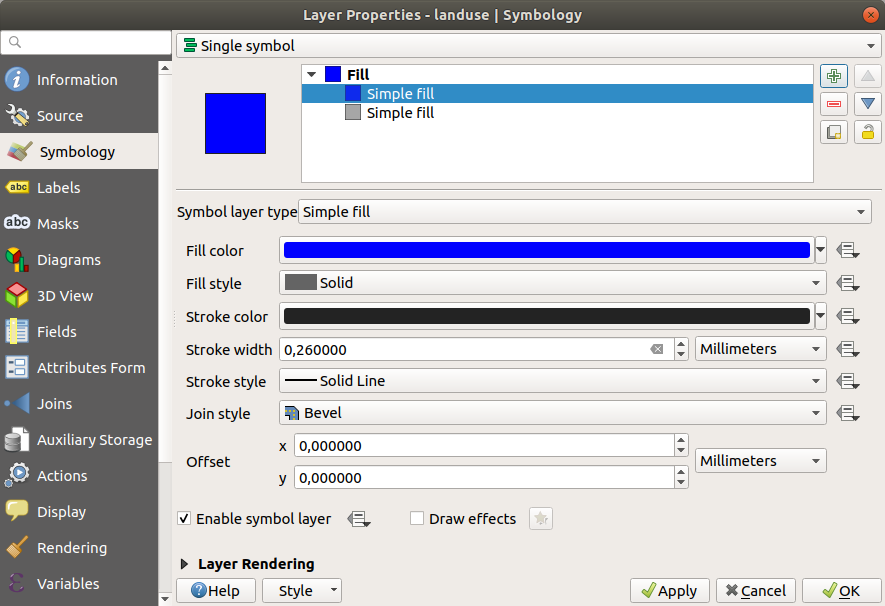
It may appear somewhat different in color, for example, but you’re going to change that anyway.
Teď je tu druhá vrstva symbolů. Kdyby byla jednobarevná, tak by samozřejmě úplně zakrývala předchozí druh symbolu. Navíc, má styl hranice Solid Line, což nechceme. Je zřejmé, že tento symbol musí být změněn.
Poznámka
Je důležité, nesplést si mapovou vrstvu a vrstvu symbolů. Mapová vrstva je vektor (nebo rastr), který byl načten do mapy. Vrstva symbolů je součástí symbolu, použitého pro zobrazení mapové vrstvy. Tento postup obvykle označuje mapovou vrstvu jen jako vrstvu, ale vrstva symbolů bude vždy nazývána jako vrstva symbolů, aby nedošlo k nedorozumění.
With the new Simple Fill symbol layer selected:
Set the border style to No Line, as before.
Změňte styl výplně na něco jiného než Solid nebo No brush. Například:
Kliknout OK.
Now you can see your results and tweak them as needed. You can even add multiple extra symbol layers and create a kind of texture for your layer that way.
Je to zábava! Ale má to pravděpodobně příliš mnoho barev pro použití v reálném mapě…
2.4.7. ★★☆ Try Yourself:
Remembering to zoom in if necessary, create a simple, but not distracting
texture for the buildings layer using the methods above.
Answer
Customize your buildings layer as you like, but remember that it
has to be easy to tell different layers apart on the map.
Here’s an example:
2.4.8. ★★☆ Follow Along: Ordering Symbol Levels
Jsou-li vrstvy symbolů poskytované, jsou také poskytované v pořadí, podobným způsobem, jakým jsou poskytované různé mapové vrstvy. To znamená, že v některých případech, pokud máme mnoho vrstev symbolů v jednom symbolu, může to vést k neočekávaným výsledkům.
Give the
roadslayer an extra symbol layer (using the method for adding symbol layers demonstrated above).Give the base line a Stroke width of
1.5and a black color.Give the new, uppermost layer a thickness of
0.8and a white color.
Všimněte si, že se stane toto:
Well, roads have now a street like symbology, but you see that lines are overlapping each others at each cross. That’s not what we want at all!
Chcete-li zabránit, aby se toto stalo, můžete setřídit úrovně symbolů a tím řídit pořadí, ve kterém jsou různé vrstvy symbolů poskytované.
To change the order of the symbol layers:
Select the topmost
Linelayer in the symbol layers tree.Click in the bottom right-hand corner of the window.
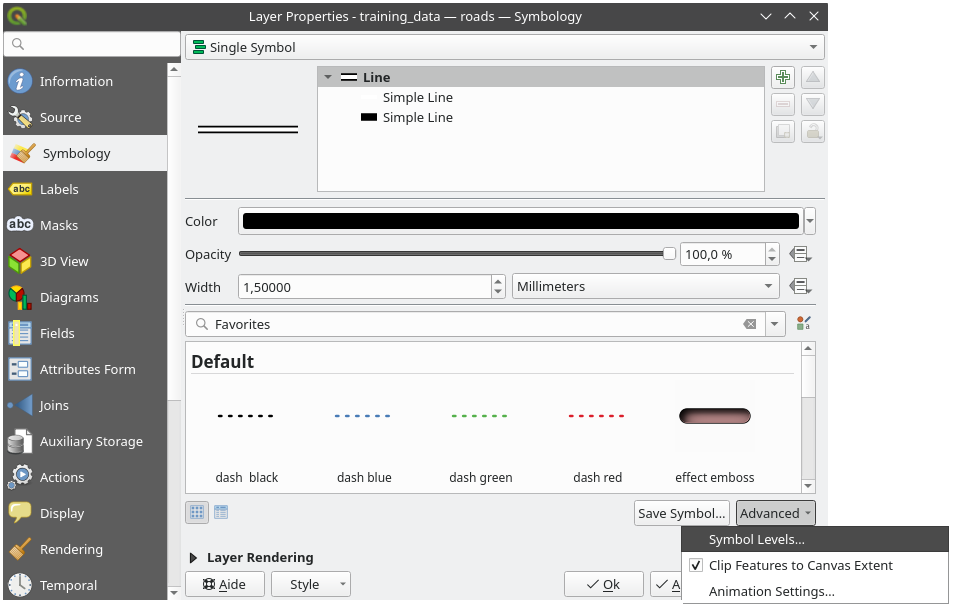
This will open a dialog like this:
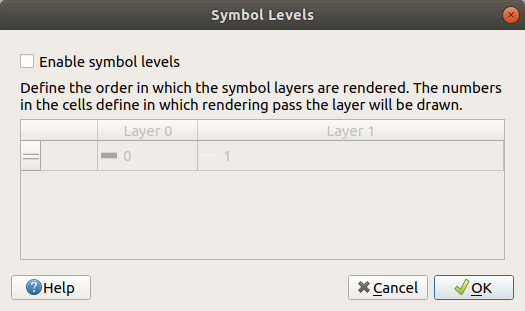
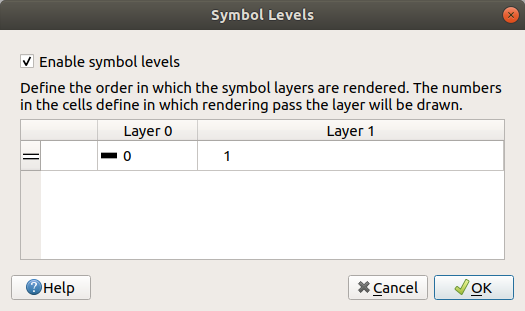
Check
 Enable symbol levels. You can then set the
layer order of each symbol by entering the corresponding level number.
0 is the bottom layer.
Enable symbol levels. You can then set the
layer order of each symbol by entering the corresponding level number.
0 is the bottom layer.In our case, we just want to activate the option, like this:
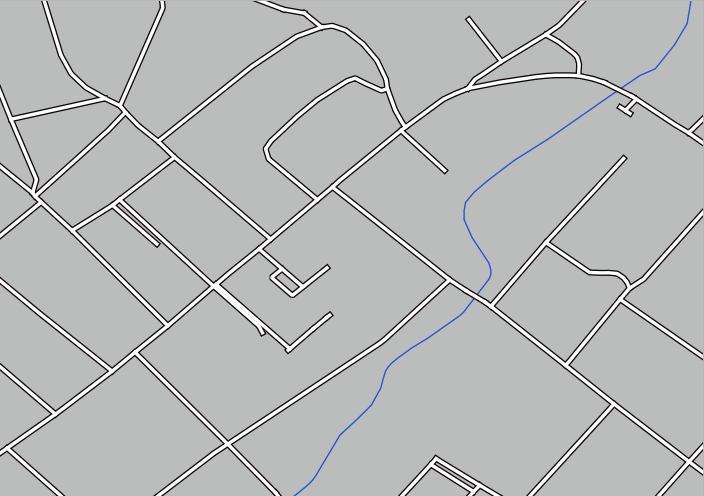
This will render the white line above the thick black line borders:
Klikněte dvakrát na OK pro návrat do mapy.
Mapa nyní bude vypadat takto:
When you’re done, remember to save the symbol itself so as not to lose your work if you change the symbol again in the future. You can save your current symbol style by clicking the Save Style… button at the bottom of the Layer Properties dialog. We will be using the QGIS QML Style File format.
Save your style in the solution/styles/better_roads.qml folder. You can load a
previously saved style at any time by clicking the Load Style…
button. Before you change a style, keep in mind that any unsaved style you are
replacing will be lost.
2.4.9. ★★☆ Try Yourself:
Change the appearance of the roads layer again.
Make the roads narrow and yellow, with a thin, pale gray outline and a thin black line in the middle. Remember that you may need to change the layer rendering order via the dialog.
Answer
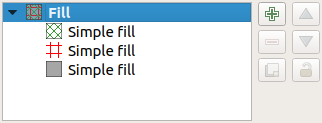
To make the required symbol, you need three symbol layers:
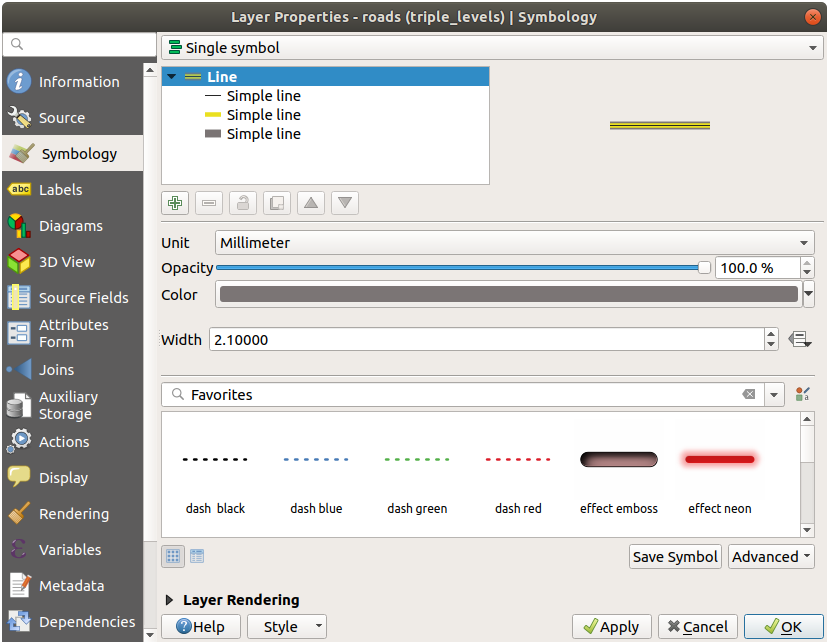
The lowest symbol layer is a broad, solid gray line. On top of it there is a slightly thinner solid yellow line and finally another thinner solid black line.
If your symbol layers resemble the above but you’re not getting the result you want:
Check that your symbol levels look something like this:
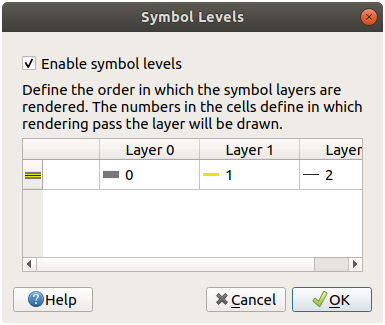
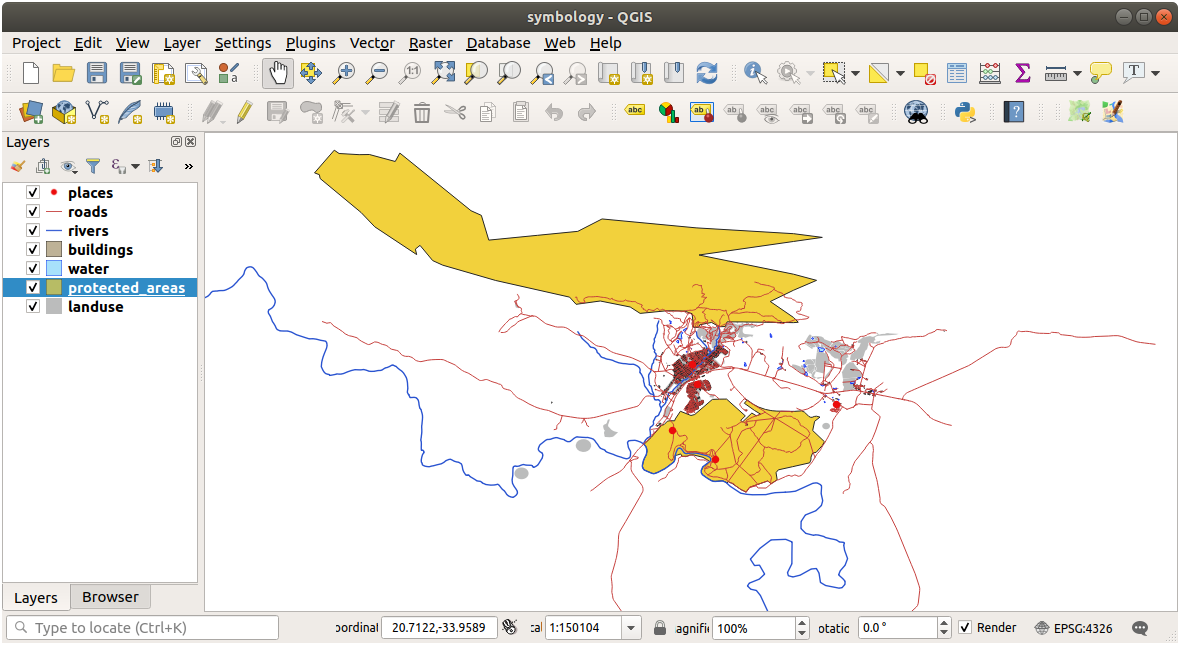
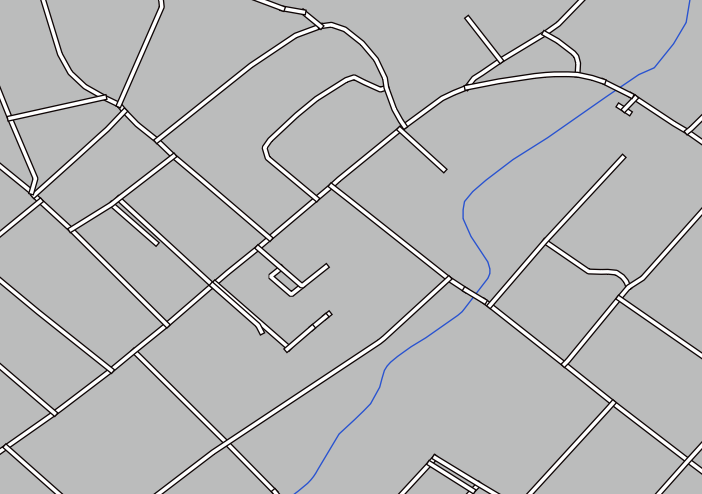
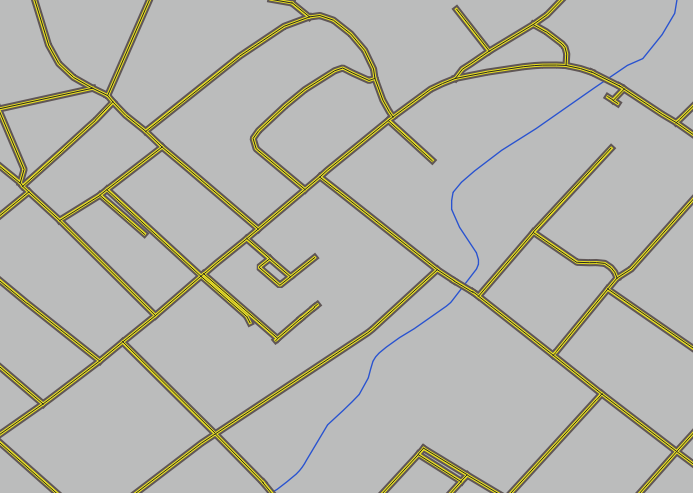
Now your map should look like this:
2.4.10. ★★★ Try Yourself:
Symbol levels also work for classified layers (i.e., layers having multiple symbols). Since we haven’t covered classification yet, you will work with some rudimentary pre-classified data.
Create a new project and add only the
roadsdataset.Apply the style file
advanced_levels_demo.qmlprovided inexercise_data/stylesto the layer. This can be done through the combobox at the bottom of the Layer Properties dialog.Přibližte na oblast Swellendam.
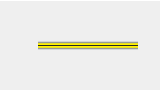
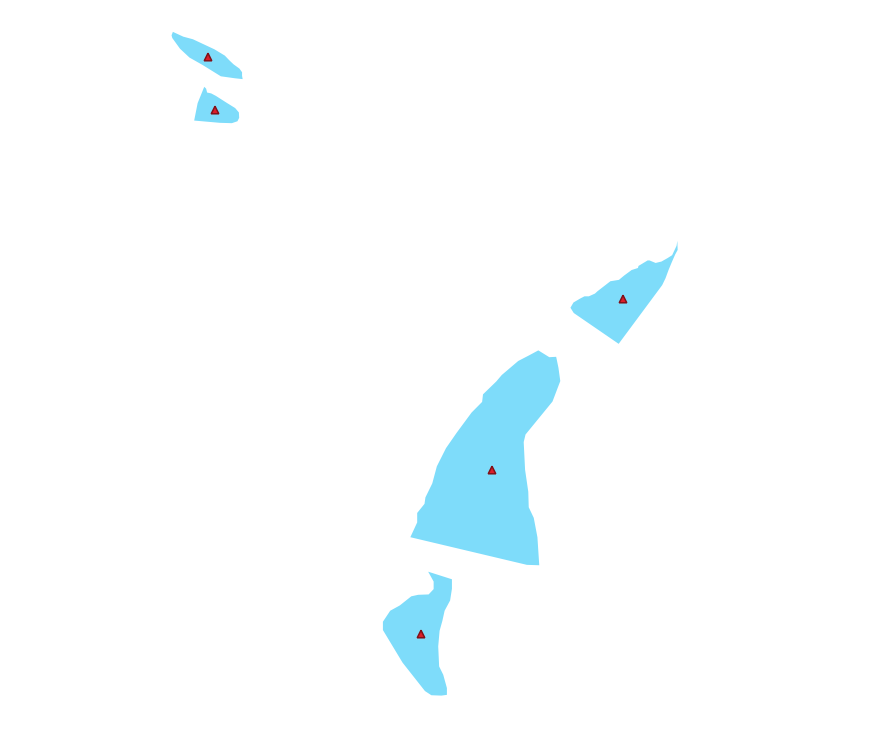
Použitím vrstev symbolů zajistěte, aby do sebe obrysy vrstev zapadly, jako na obrázku níže:
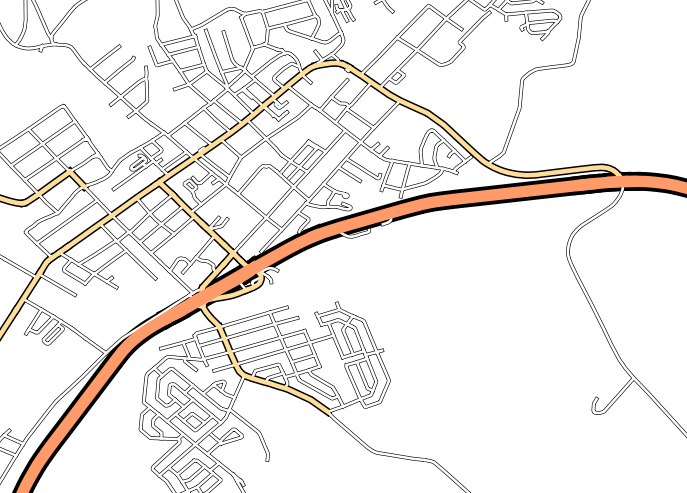
Answer
Adjust your symbol levels to these values:
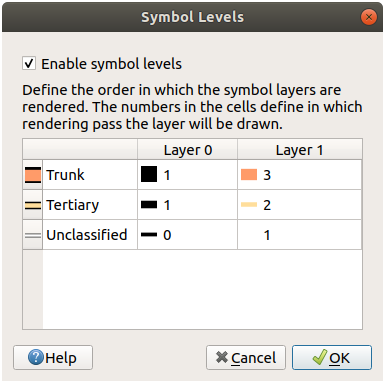
Experiment with different values to get different results.
Open your original map again before continuing with the next exercise.
2.4.11. ★★☆ Follow Along: Symbol layer types
In addition to setting fill colors and using predefined patterns, you can use different symbol layer types entirely. The only type we’ve been using up to now was the Simple Fill type. The more advanced symbol layer types allow you to customize your symbols even further.
Každý druh vektoru (bod, linie a polygon) má svoji vlastní sadu typů vrstvy symbolů. Nejprve se podíváme na typy, které jsou k dispozici pro body.
Typy vrstev symbolů pro body
Uncheck all the layers except for
places.Change the symbol properties for the
placeslayer: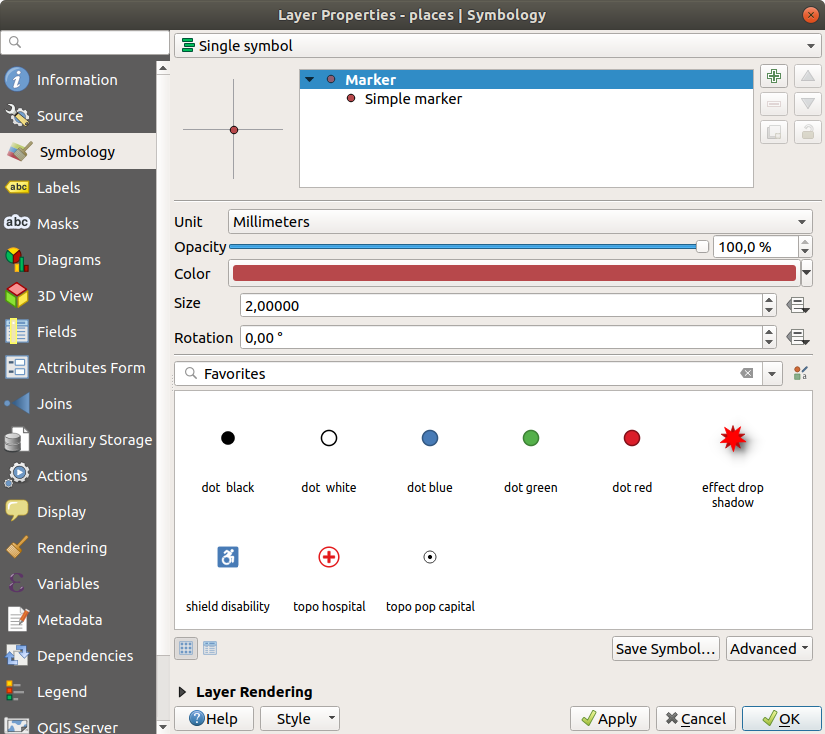
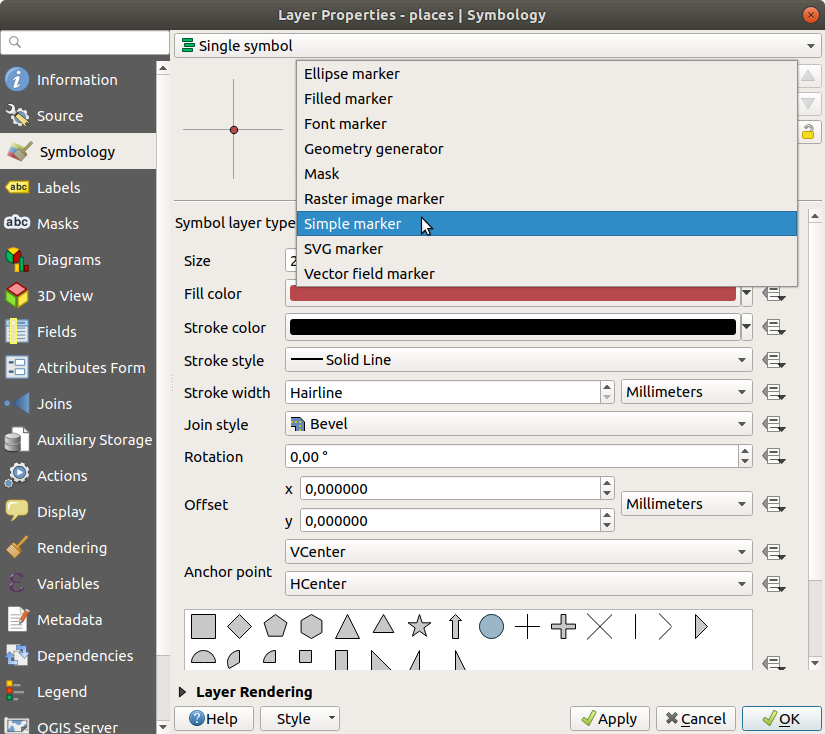
You can access the various symbol layer types by selecting the Simple marker layer in the symbol layers tree, then click the Symbol layer type dropdown:
Prozkoumejte různé možnosti, které máte k dispozici a zvolte si symbol se stylem, jaký je podle vás vhodný.
If in doubt, use a round Simple marker with a white border and pale green fill, with a Size of
3.00and a Stroke width of0.5.
Typy vrstev symbolů pro linie
Chcete-li zobrazit různé možnosti, které jsou k dispozici pro liniová data:
Change the Symbol layer type for the
roadslayer’s topmost symbol layer to Marker line: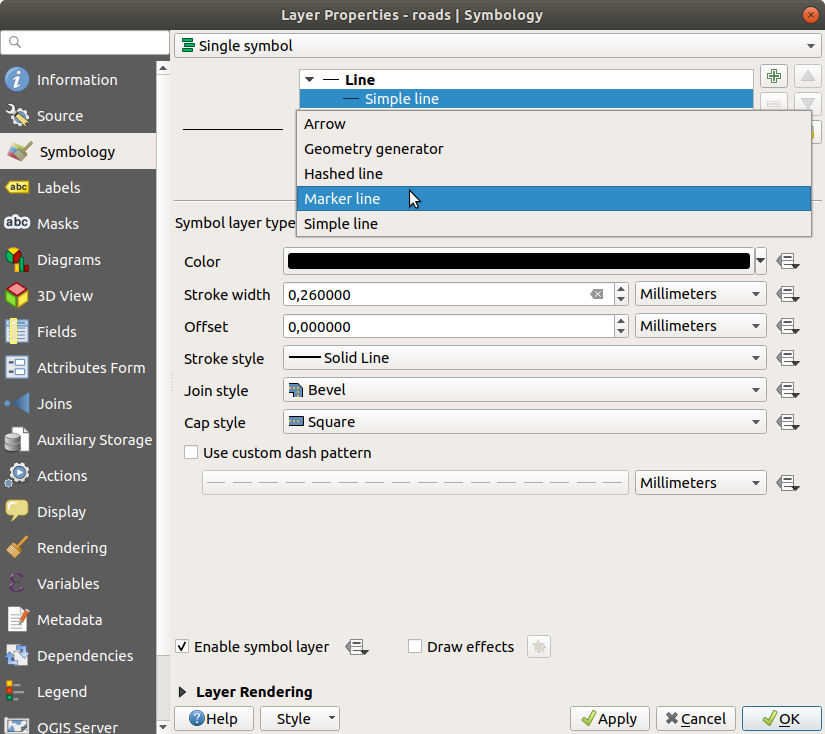
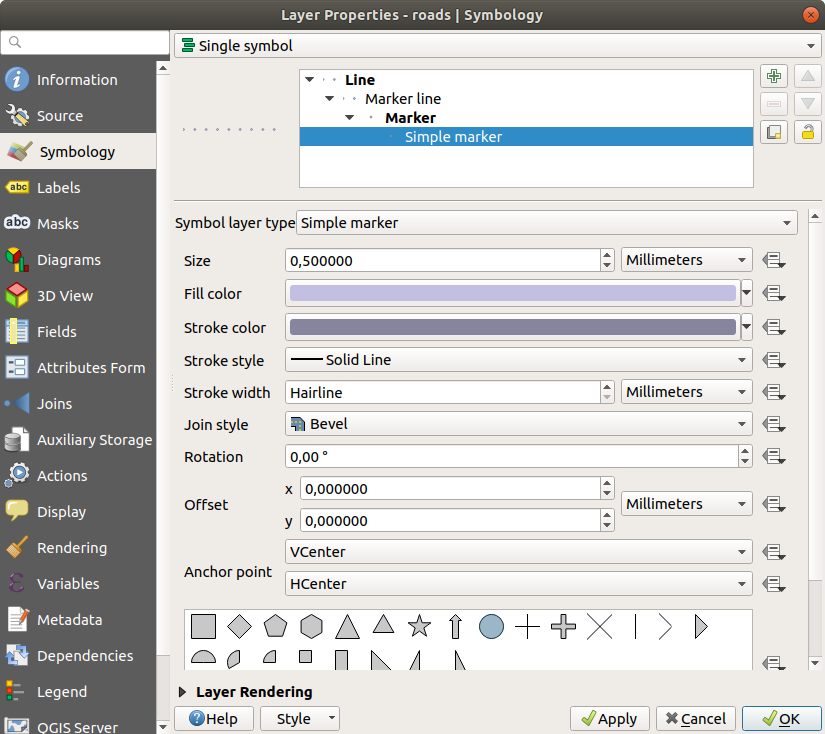
Select the Simple marker layer in the symbol layers tree. Change the symbol properties to match this dialog:
Select the Marker line layer and change the interval to
1.00: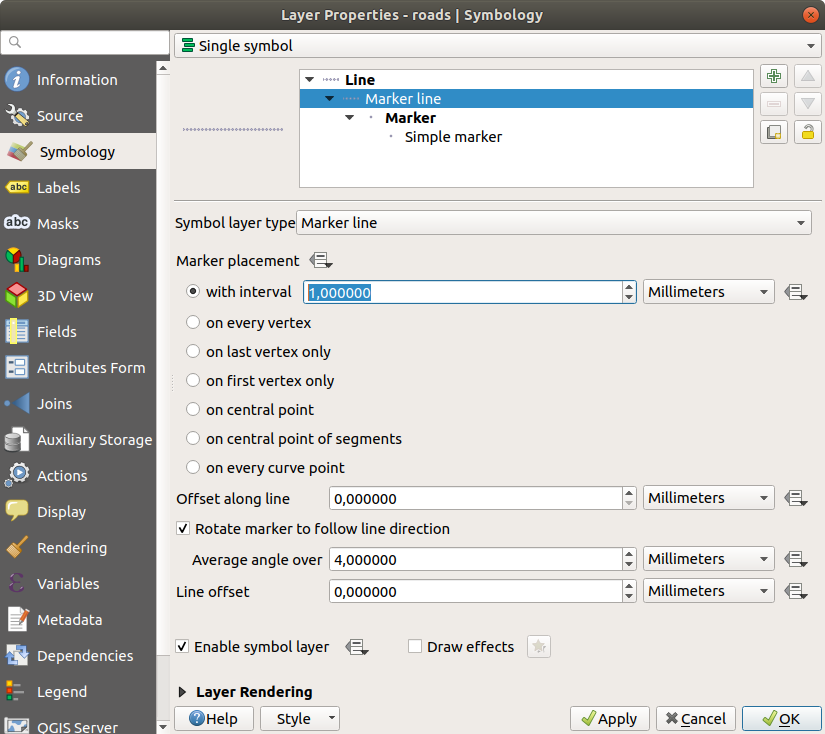
Ujistěte se, že úrovně symbolů jsou správné (přes dialog , který jsme použili dříve) před použitím stylu.
Poté, co styl použijete, podívejte se na jeho výsledky na mapě. Jak můžete vidět, tyto symboly mění směr spolu se silnicí, ale ne vždy se spolu s ní zakřivují. To je pro některé účely užitečné, ale pro ostatní zase ne. Pokud chcete, můžete změnit vrstvu symbolů v předchozí dotazu tak, jak vypadala předtím.
Typy vrstev symbolů pro polygony
Chcete-li zobrazit různé možnosti, které jsou k dispozici pro polygonová data:
Change the Symbol layer type for the
waterlayer, as before for the other layers.Zjistěte, jaké jsou různé možnosti na seznamu, které můžete dělat.
Vyberte si jednu z nich, která vám nejvíce vyhovuje.
V případě pochybností, použijte Point pattern fill s následujícími možnostmi:
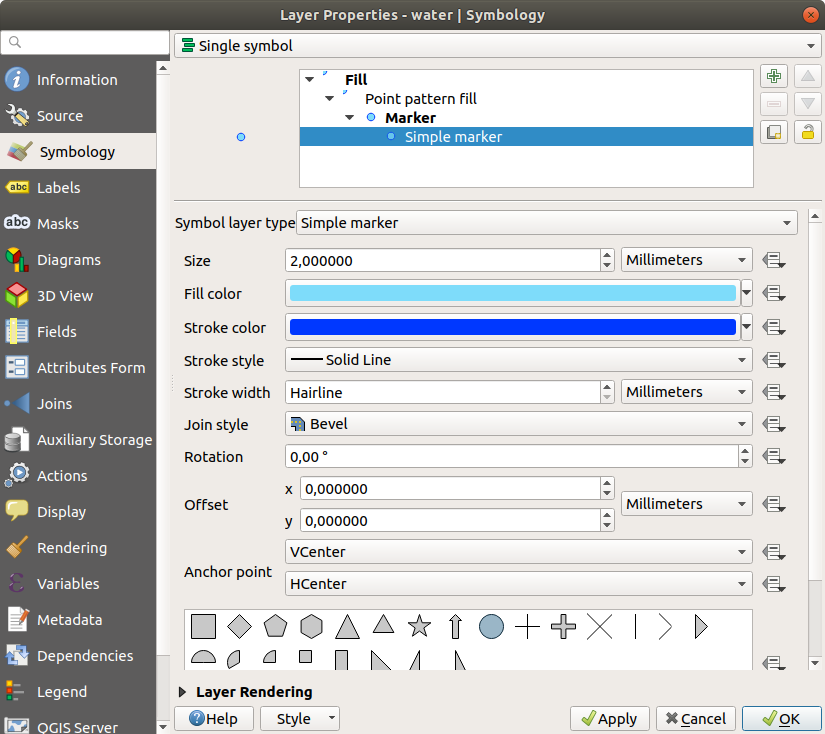
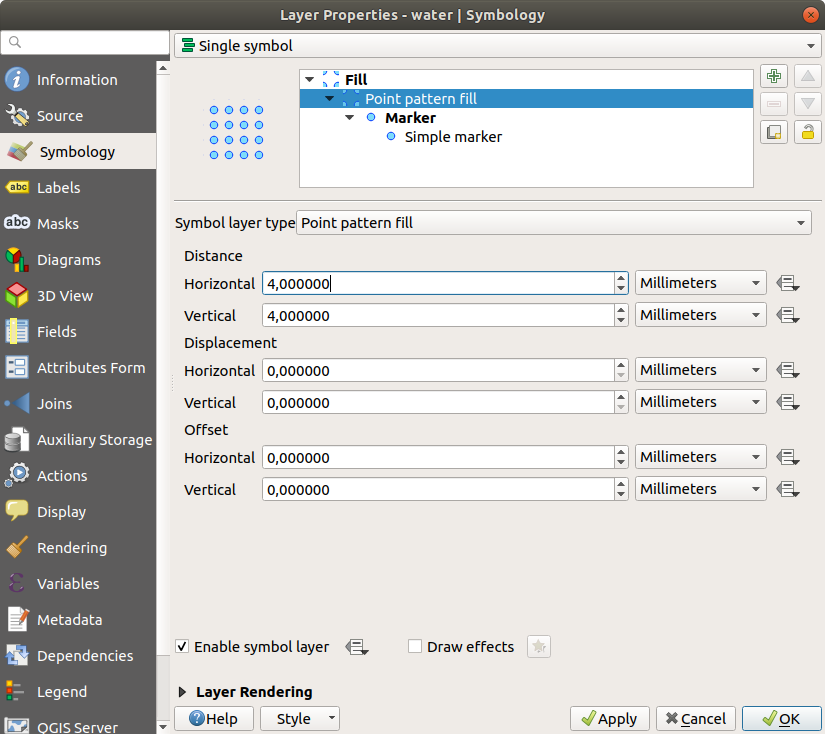
Přidejte novou vrstvu symbolů Simple fill.
Vytvořte tu samou, ale ve světle modré barvě s tmavě modrým obrysem.
Přesuňte ji pod vrstvu symbolů pro bodový vzor tlačítkem Move down:
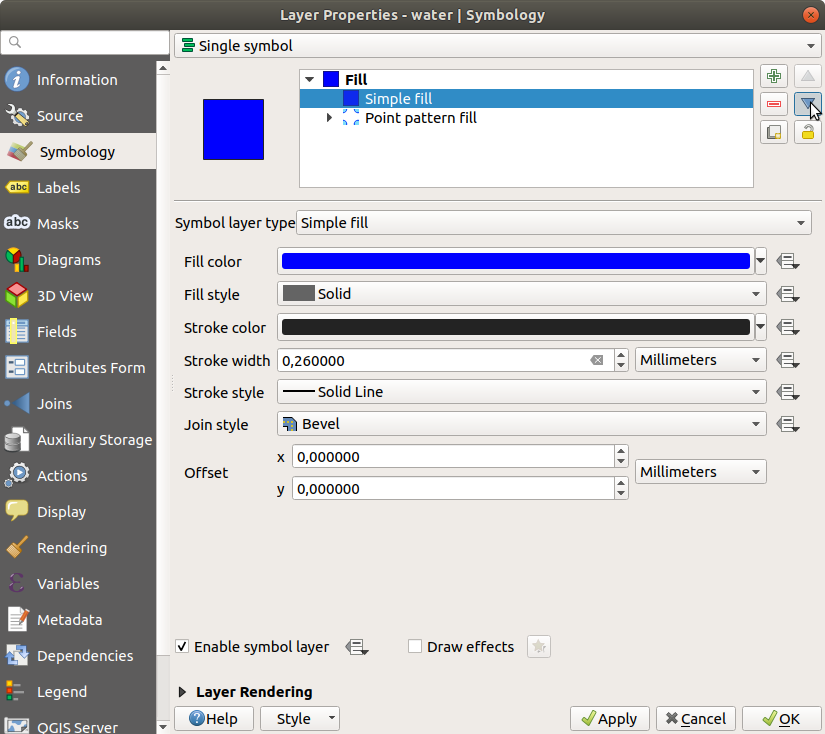
Výsledkem je strukturovaný symbol pro vrstvu vodstva, s přidanou výhodou, že můžete měnit velikost, tvar a vzdálenost jednotlivých bodů, které tvoří strukturu.
2.4.12. ★★☆ Try Yourself:
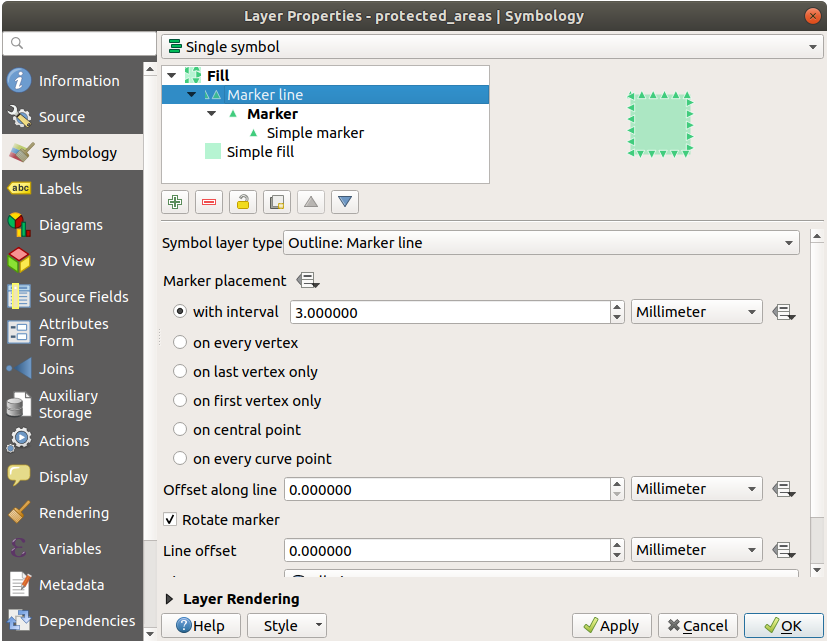
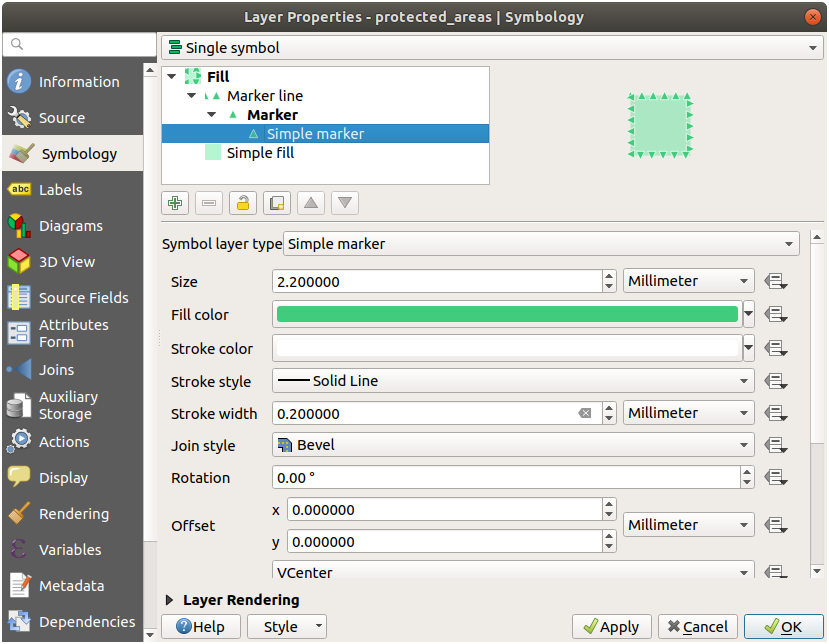
Apply a green transparent fill color to the protected_areas layer,
and change the outline to look like this:
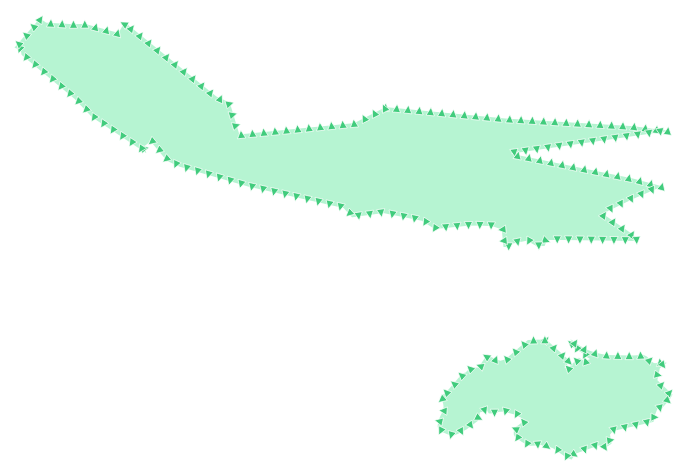
Answer
Here are examples of the symbol structure:
2.4.13. ★★★ Follow Along: Geometry generator symbology
You can use the Geometry generator symbology with all layer types (points, lines and polygons). The resulting symbol depends directly on the layer type.
Very briefly, the Geometry generator symbology allows you to run some spatial operations within the symbology itself. For example you can run a real centroid spatial operation on a polygon layer without creating a point layer.
Moreover, you have all the styling options to change the appearance of the resulting symbol.
Let’s give it a try!
Select the
waterlayer.Click on Simple fill and change the Symbol layer type to Geometry generator.
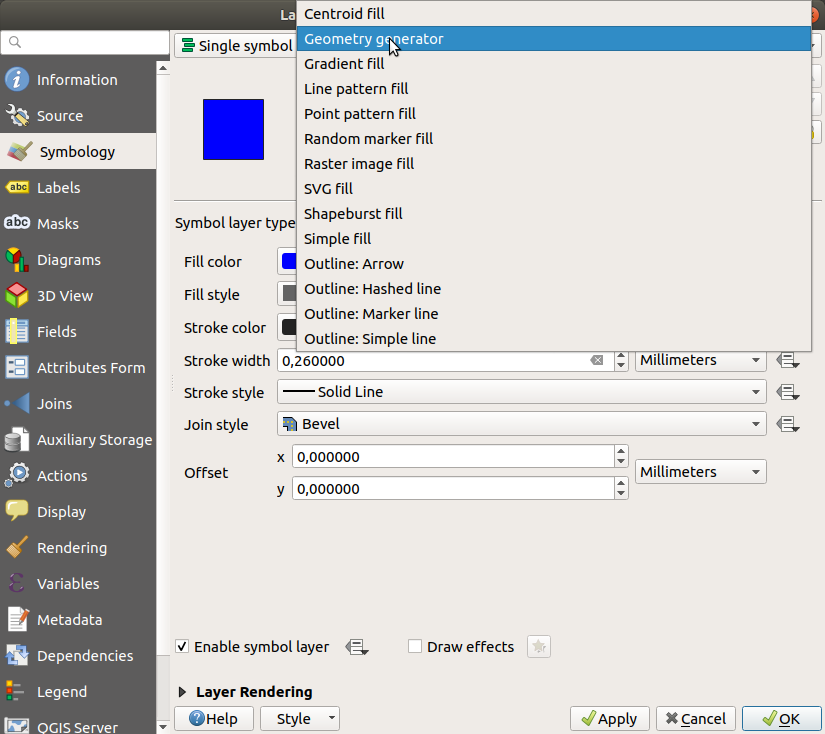
Before to start writing the spatial query we have to choose the Geometry Type in output. In this example we are going to create centroids for each feature, so change the Geometry Type to Point / Multipoint.
Now let’s write the query in the query panel:
centroid($geometry)
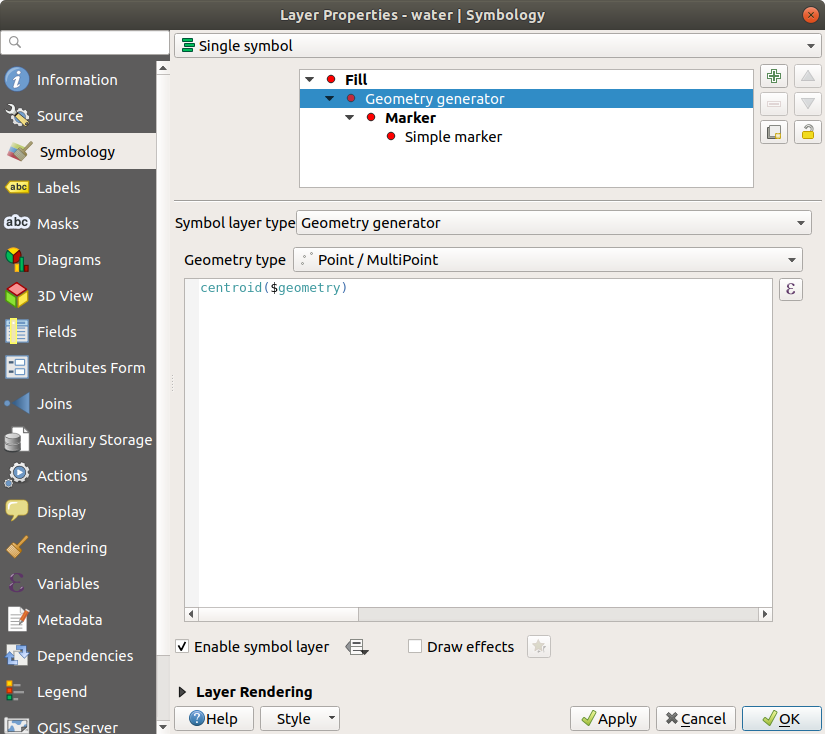
When you click on OK you will see that the
waterlayer is rendered as a point layer! We have just run a spatial operation within the layer symbology itself, isn’t that amazing?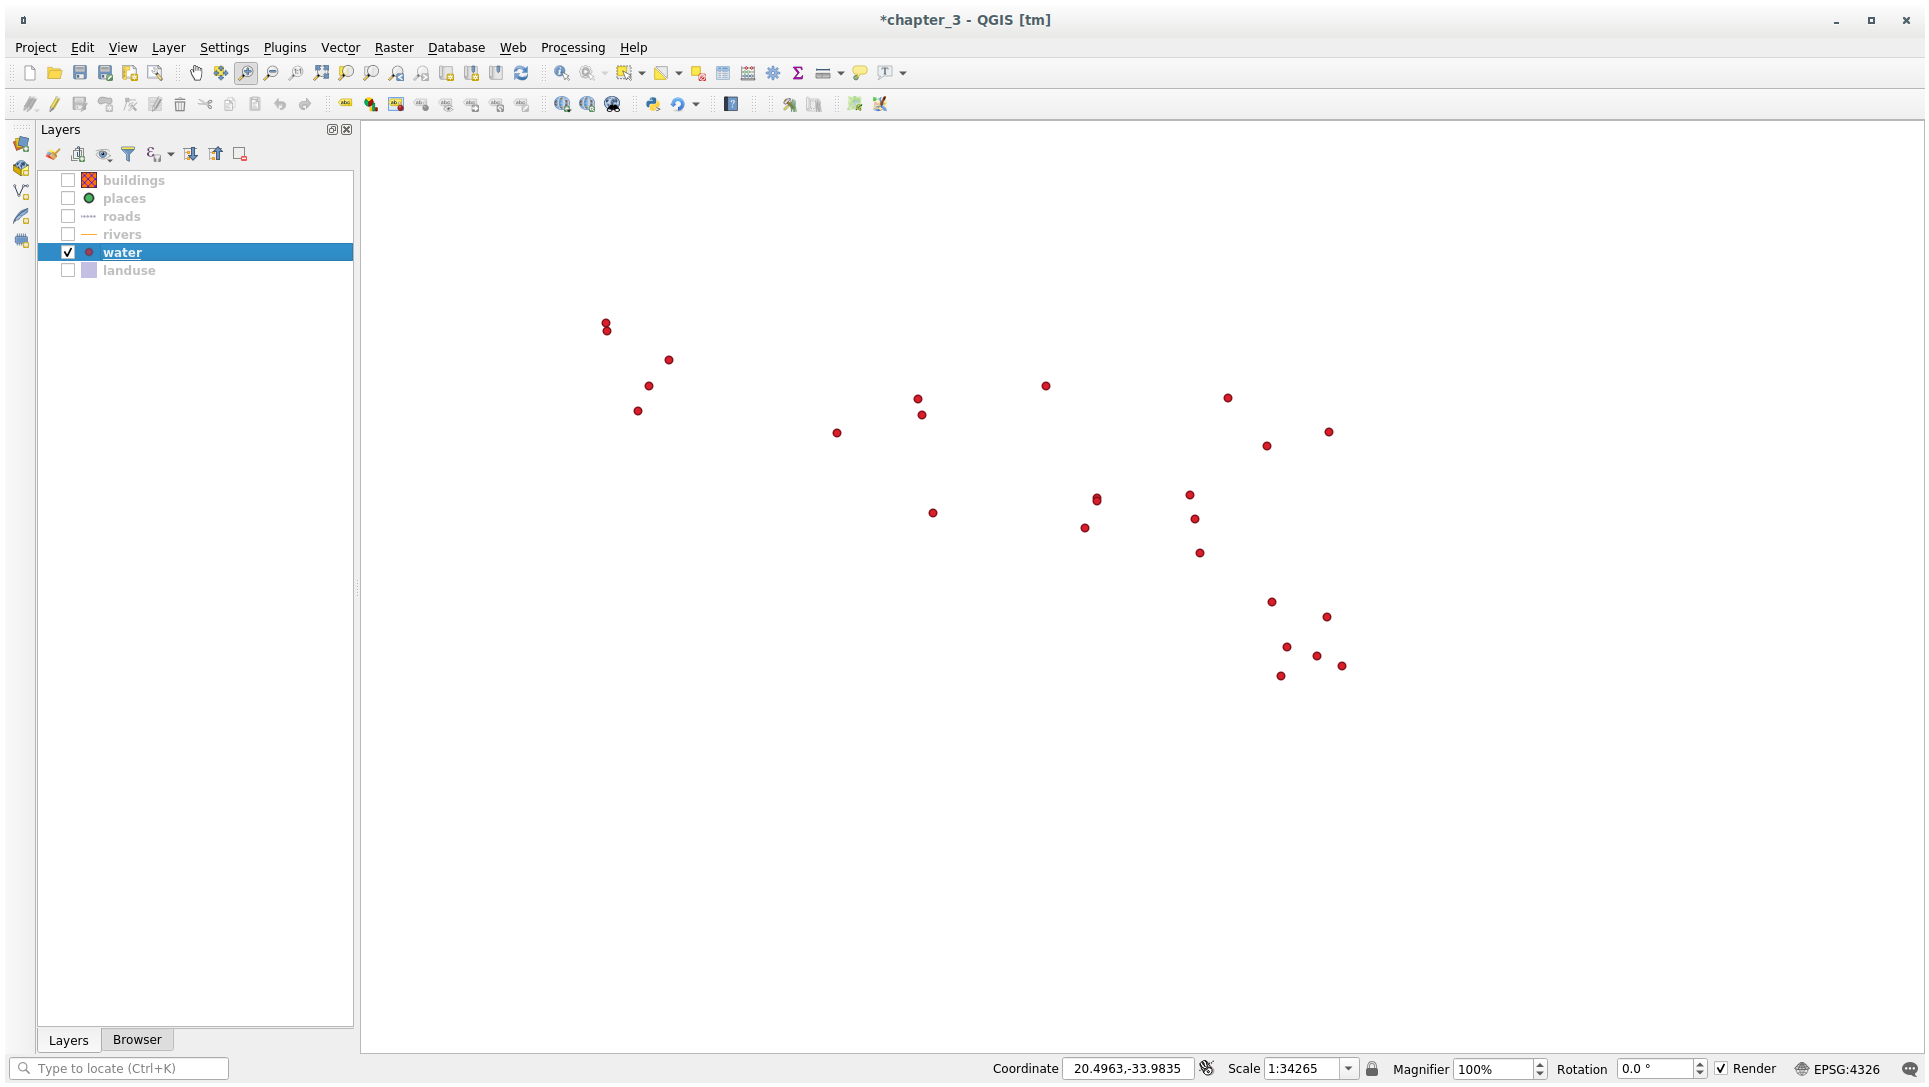
With the Geometry generator symbology you can really go over the edge of normal symbology.
★★★ Try Yourself:
Geometry generator are just another symbol level. Try to add another Simple fill underneath the Geometry generator one.
Change also the appearance of the Simple marker of the Geometry generator symbology.
The final result should look like this:
Answer
Click on the
button to add another Symbol level.Move the new symbol at the bottom of the list clicking the
 button.
Choose a good color to fill the water polygons.
Click on Marker of the Geometry generator symbology and change the circle with another shape as your wish.
Try experimenting other options to get more useful results.
2.4.14. ★★★ Follow Along: Creating a Custom SVG Fill
Poznámka
Chcete-li dělat toto cvičení, budete potřebovat mít nainstalovaný bezplatný software pro úpravu vektoru Inkscape Inkscape .
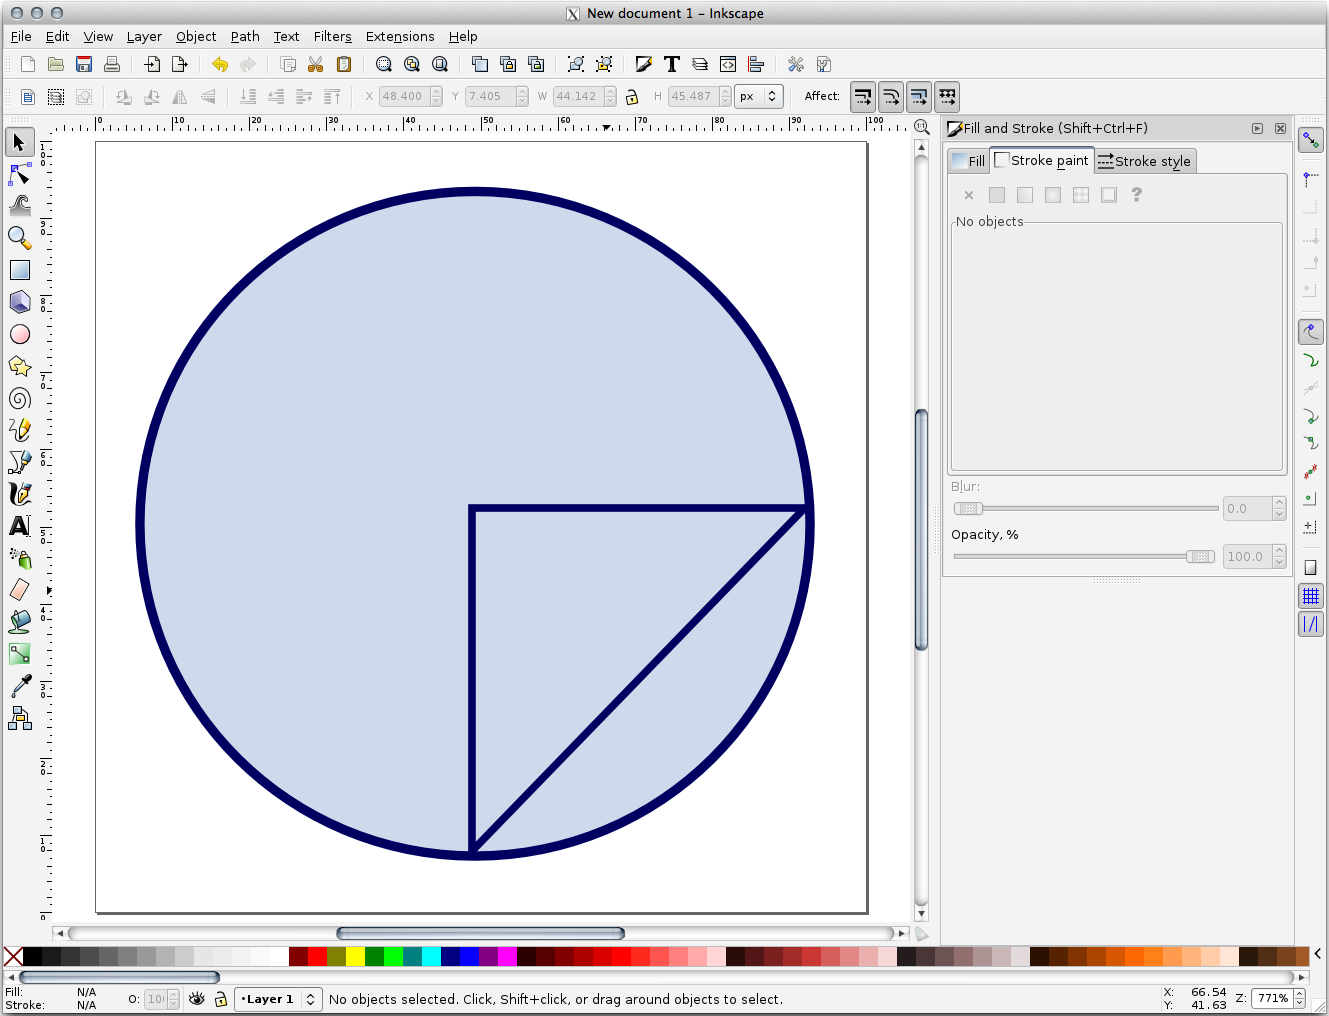
Start the Inkscape program. You will see the following interface:
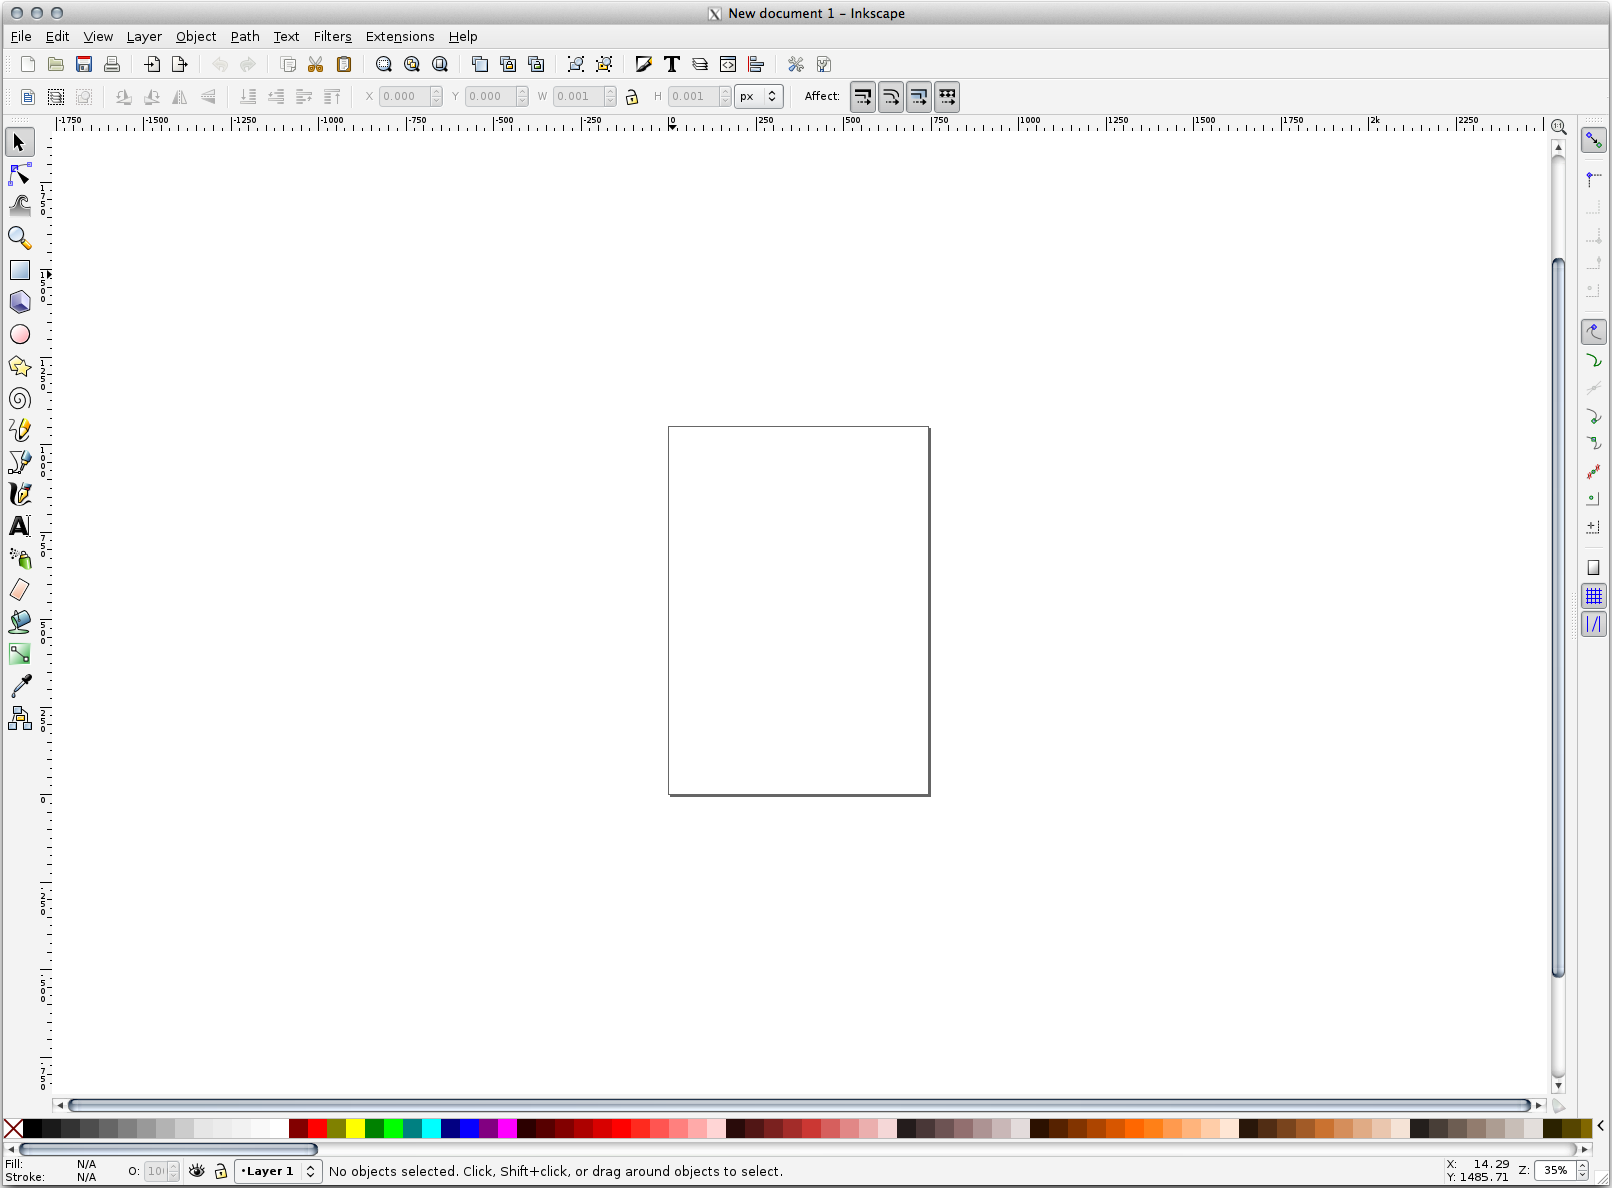
Mělo by vám být povědomé, pokud jste někdy použili jiné programy na úpravu vektorových obrázků, jako je Corel.
Za prvé, změníme obraz na velikost vhodnou pro malou texturu.
Klikněte na položku menu . Dostanete dialog Document Properties.
Změňte Units na px.
Change the Width and Height to
100.Zavřete dialogové okno, až budete hotovi.
Klikněte na položku menu pro náhled stránky, se kterou pracujete.
Vyberte nástroj Circle:
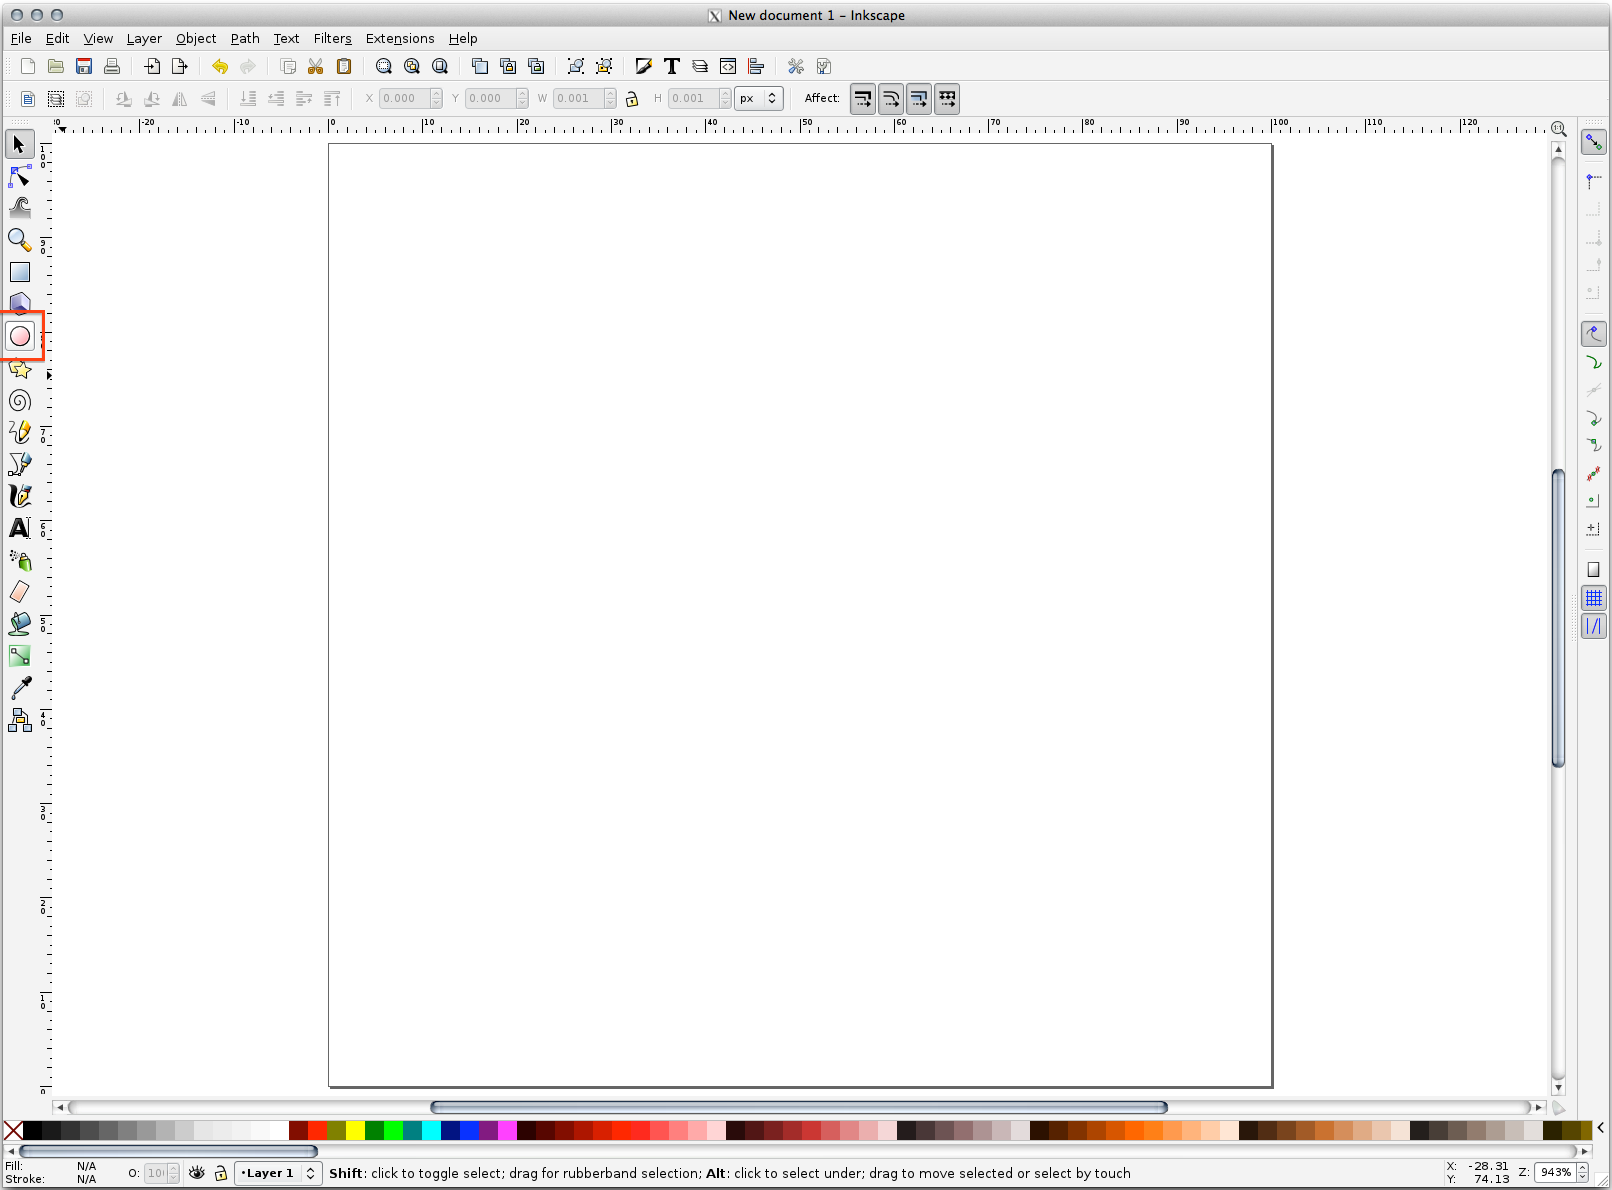
Kliknutím a tažením nakreslete elipsu. Chcete-li elipsu změnit v kruh, podržte při kreslení tlačítko Ctrl .
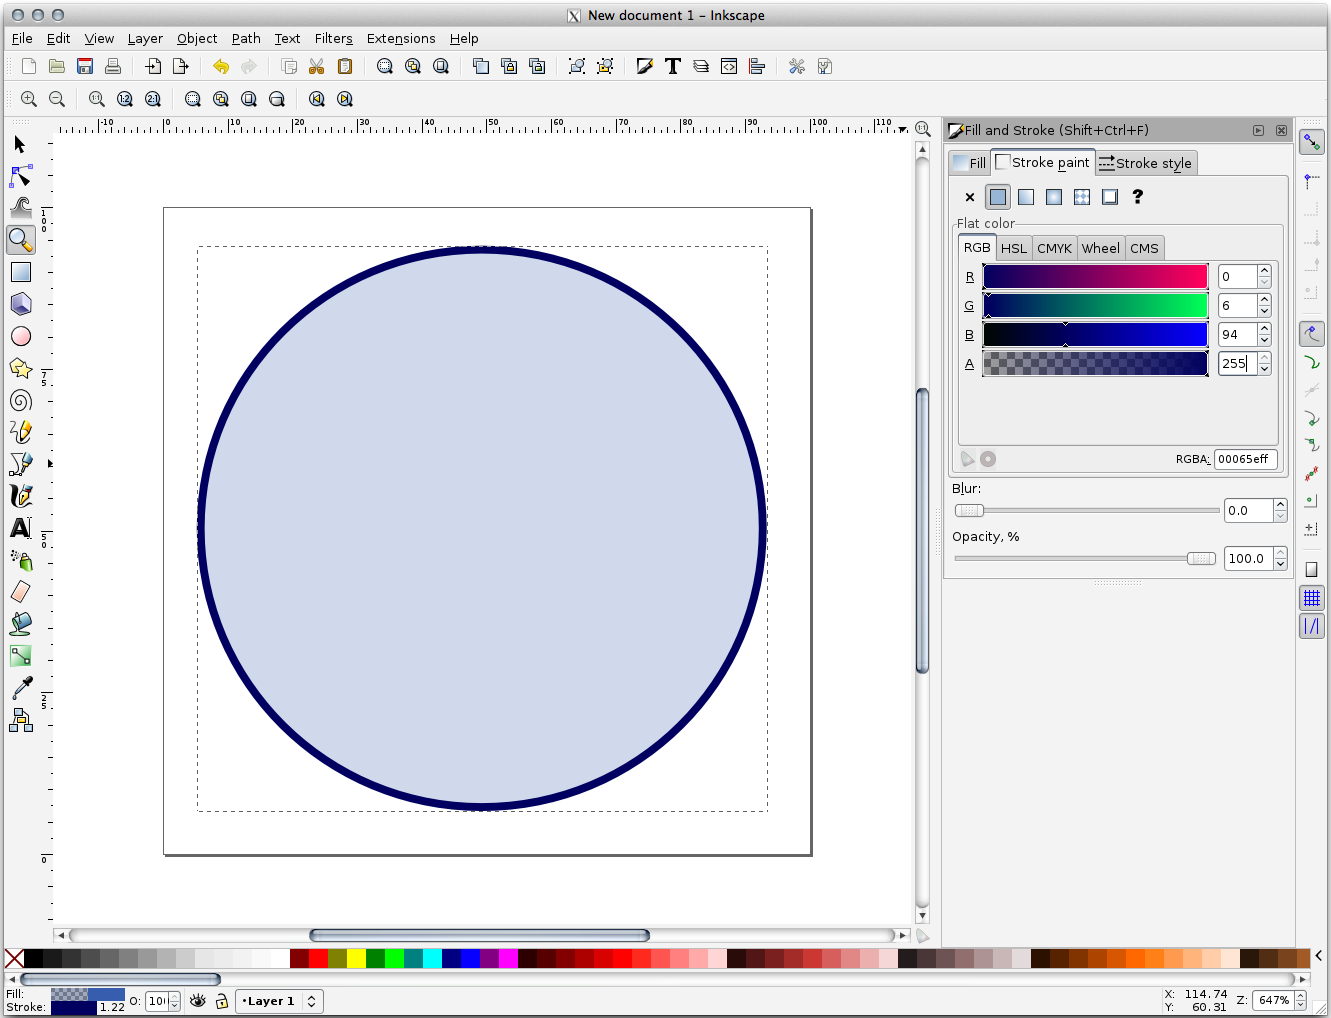
Klepněte pravým tlačítkem myši na kruh, který jste právě vytvořili, a otevřete Fill and Stroke možnosti. Můžete modifikovat jeho renderování, jako například:
Změňte Fill barvu na přibližně šedo-modrou,
Přiřaďte okrajům tmavší barvu v Stroke paint záložce,
A snižte šířku okraje pod Stroke style záložkou.
Nakreslete linii s použitím nástroje Pencil:
Click once to start the line. Hold Ctrl to make it snap to increments of 15 degrees.
Posuňte ukazatel horizontálně a jednoduchým kliknutím vložte bod.
Klikněte a sejměte vrchol linie a sledujte svislou linii, ukončete jednoduchým kliknutím.
Nyní spojte tyto dva koncové vrcholy.
Změňte barvu a šířku trojúhelníkového symbolu, aby odpovídala hranici kruhu a posuňte ji, jak to bude nutné tak, že nakonec dostanete symbol, jako je tento:
If the symbol you get satisfies you, then save it as
landuse_symbolunder the directory that the course is in, underexercise_data/symbols, as SVG file.
V QGISu:
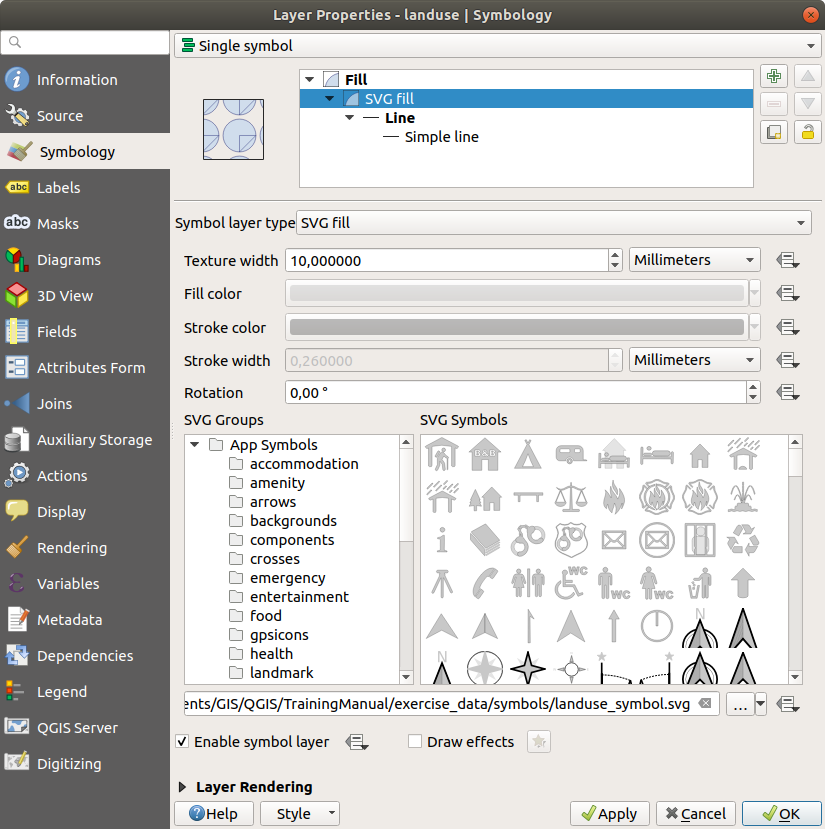
Open the Layer Properties for the
landuselayer.In the
Symbology tab, change the symbol structure by
changing the Symbol Layer Type to SVG Fill
shown below.Click the … button and then Select File… to select your SVG image.
It’s added to the symbol tree and you can now customize its different characteristics (colors, angle, effects, units…).
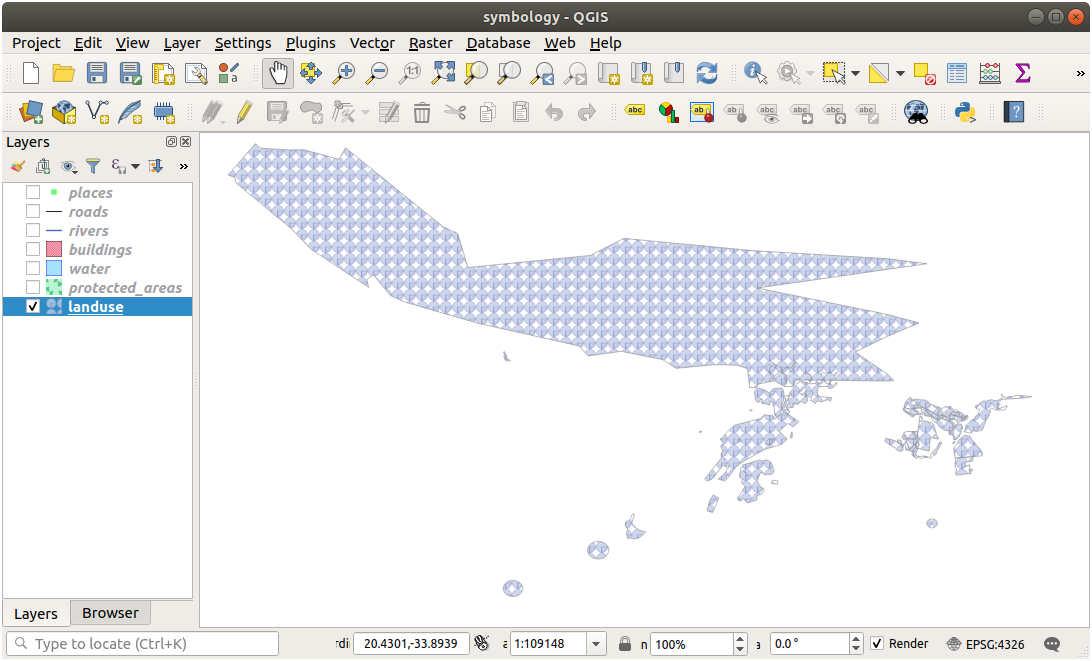
Once you validate the dialog, features in landuse layer should now
be covered by a set of symbols, showing a texture like the one on the
following map. If textures are not visible, you may need to zoom in the map
canvas or set in the layer properties a bigger Texture width.
2.4.15. ★★☆ Follow Along: Masking
Masking feature allows you to mask some symbol layer using another symbol layer or label.
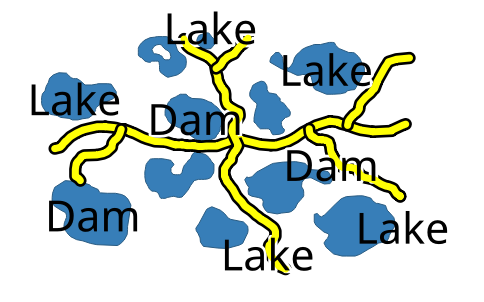
In the following exercise, we want to configure rendering so that polygon labels will mask the black part of lines layer.
Load the
selective_masking.qgsfrom dataset in directoryexercise_data/masking.Open the Layer Properties window for the
polyslayer.Under the
 Labels tab, you will see that Single Labels have
already been defined.
Labels tab, you will see that Single Labels have
already been defined.From the Labels tab, select the
 Mask (and not Masks in general category list)
Enable label mask by checking the
 Enable mask option
A message tells you that the now defined label mask shape can be later selected as a mask source to mask other symbol layers. Let’s do that.
Click OK
Open the Layer Properties window for the
lineslayer.Go to the
Masks tabClick on the black line part of lines checkbox from masked symbol layers
A message warns you that you have to select both masking and masked symbol layers to be able to save masking configuration. Again, let’s do that.
Click on
polysLabel mask checkboxThe message disappears, you can now safely save your configuration.
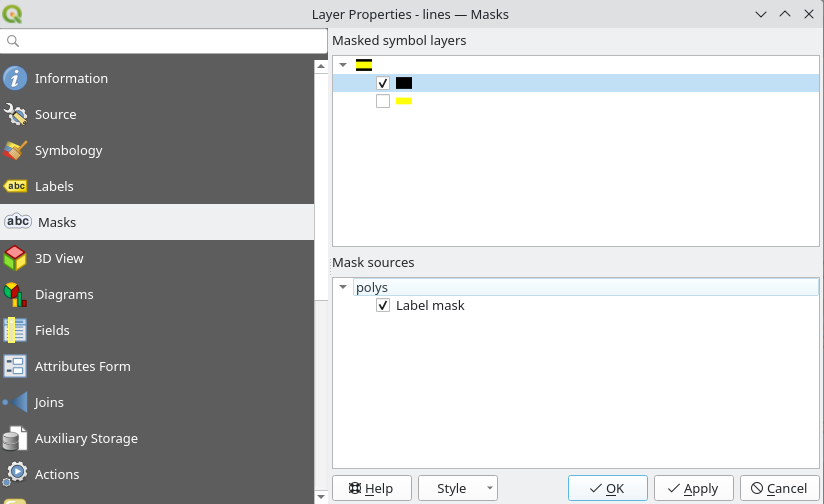
Click OK
You can see now that labels are masking the black part of lines, leaving only the yellow part.
2.4.16. ★★☆ Follow Along: Masking using points symbols
We want now to mask the black part of lines using only black planes that represent the points layer (i.e. B52 and Jet points categories).
For the sake of visibility, you can switch off polys layer visibility.
Open the Layer Properties window for the
pointslayer.Under the
Symbology tab, you will see that a  Categorized renderer has
been defined with 3 different symbols depending on the
Categorized renderer has
been defined with 3 different symbols depending on the Classfield value.Double click on
B52plane icon, within the Symbol column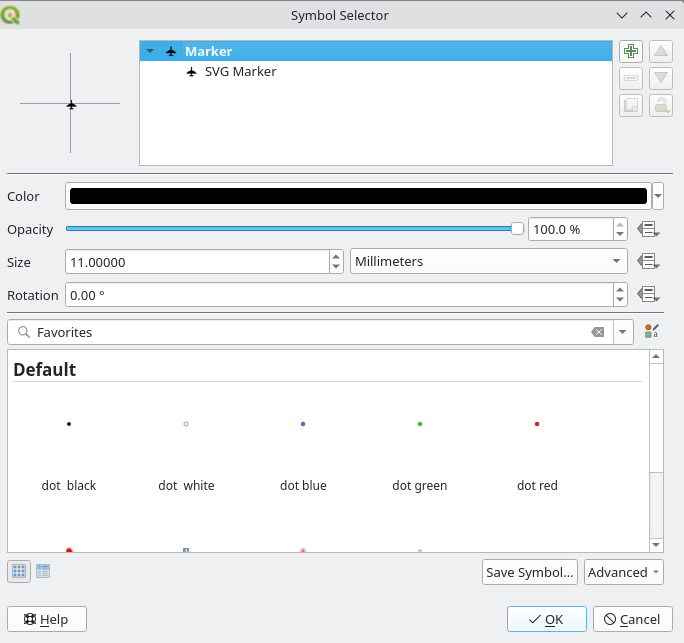
Click the
Add symbol layer button and select the MaskSymbol layer typeA new hierarchy
Mask(symbol layer) >Marker(symbol) >Simple Marker(symbol layer) appear below the root symbolMarker.
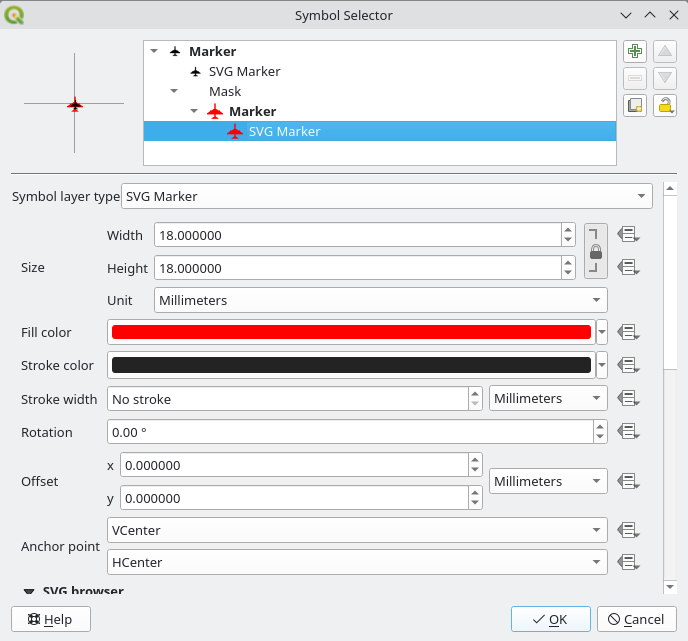
Now, let’s define a mask that is identical to our plane marker but a little bit bigger.
Select the newly created
Simple Markersymbol layer and change its Symbol layer type toSVG markerSet the SVG file path to be the same as the already existing SVG marker, and the size to be bigger (24 millimeters is a pretty good choice for this use case).
Mask color doesn’t matter here, only the shape is used in masking. Symbol layer order is also irrelevant in that situation.
You should get something like that:
Repeat the same operations on
Jetsymbol.Click OK
Open the Layer Properties window for the
lineslayer.Go to the
Masks tab.The black line part of lines checkbox from masked symbol layers is already checked from our previous configuration.
Uncheck the Label mask
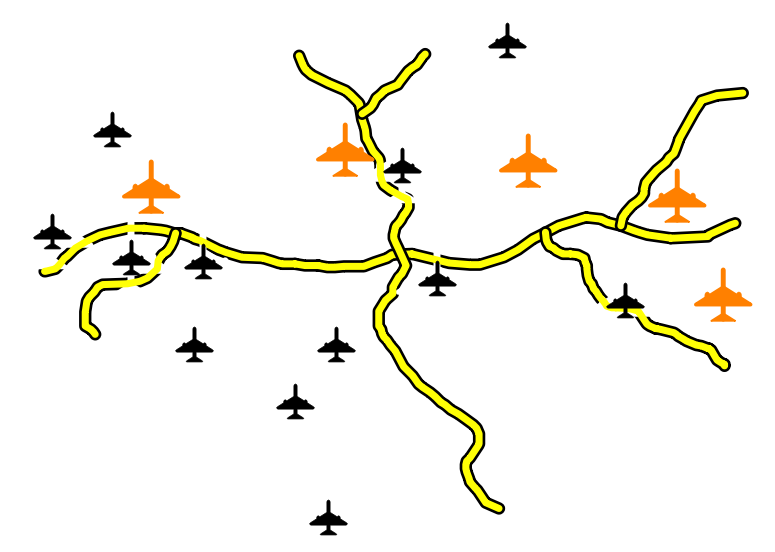
polyscheckbox and check bothB52andJetMask symbol layerClick OK
You now see that black planes are masking the black part of lines, with only the yellow part visible.
2.4.17. In Conclusion
Změna symboliky pro různé vrstvy přeměnila sbírku vektorových souborů na čitelnou mapu. Nejen, že můžete vidět, co se děje, ale ještě krásnější je to vidět!
2.4.18. Further Reading
2.4.19. Kam dál?
Změna symbolů pro celé vrstvy je užitečná, ale informace obsažené v každé vrstvě ještě nejsou k dispozici pro toho, kdo z daných map čte. Jaké názvy mají ulice? Které regiony patří do určitých oblastí? Jaké jsou povrchové plochy vztahující se ke statkům? Všechny tyto informace jsou stále skryté. V další lekci vysvětlíme, jak zobrazovat tato data na mapě.
Poznámka
Nezapomněli jste si v poslední době uložit vaši mapu??