6.1. Lesson: Creating a New Vector Dataset
The data that you use has to come from somewhere. For most common applications, the data exists already; but the more particular and specialized the project, the less likely it is that the data will already be available. In such cases, you’ll need to create your own new data.
The goal for this lesson: To create a new vector dataset.
6.1.1.  Follow Along: The Layer Creation Dialog
Before you can add new vector data, you need a vector dataset to add it to. In our case, you’ll begin by creating new data entirely, rather than editing an existing dataset. Therefore, you’ll need to define your own new dataset first.
You’ll need to open a Create Layer dialog that will allow you to define a new layer.
Navigate to and click on the menu entry .
You’ll be presented with the following dialog:
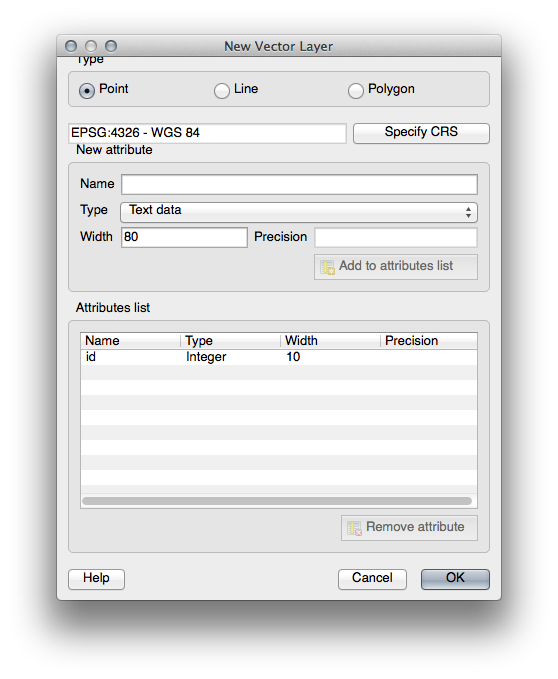
It’s important to decide which kind of dataset you want at this stage. Each different vector layer type is “built differently” in the background, so once you’ve created the layer, you can’t change its type.
For the next exercise, we’re going to be creating new features which describe areas. For such features, you’ll need to create a polygon dataset.
Click on the Polygon radio button:
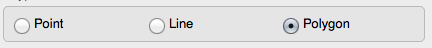
This has no impact on the rest of the dialog, but it will cause the correct type of geometry to be used when the vector dataset is created.
The next field allows you to specify the Coordinate Reference System, or CRS. A CRS specifies how to describe a point on Earth in terms of coordinates, and because there are many different ways to do this, there are many different CRSs. The CRS of this project is WGS84, so it’s already correct by default:

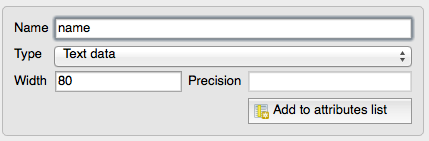
Next there is a collection of fields grouped under New attribute. By default, a new layer has only one attribute, the id field (which you should see in the Attributes list) below. However, in order for the data you create to be useful, you actually need to say something about the features you’ll be creating in this new layer. For our current purposes, it will be enough to add one field called name.
Replicate the setup below, then click the Add to attributes list button:
Check that your dialog now looks like this:
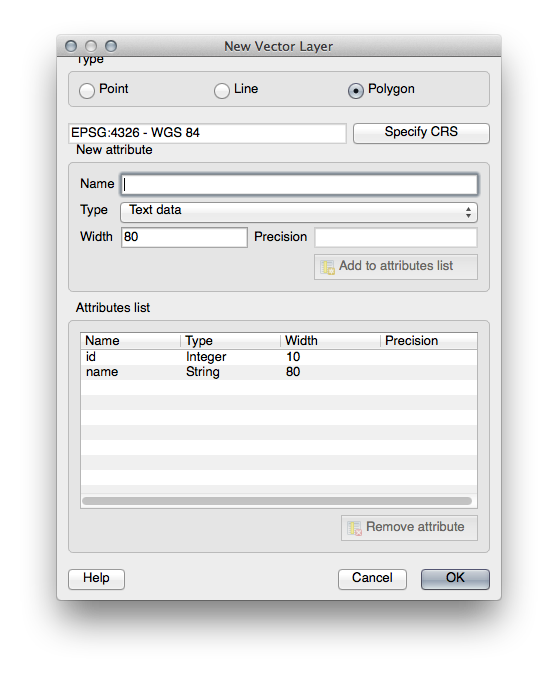
Click OK. A save dialog will appear.
Navigate to the exercise_data directory.
Save your new layer as school_property.shp.
The new layer should appear in your Layers panel.
6.1.2. Follow Along: Data Sources
When you create new data, it obviously has to be about objects that really exist on the ground. Therefore, you’ll need to get your information from somewhere.
There are many different ways to obtain data about objects. For example, you could use a GPS to capture points in the real world, then import the data into QGIS afterwards. Or you could survey points using a theodolite, and enter the coordinates manually to create new features. Or you could use the digitizing process to trace objects from remote sensing data, such as satellite imagery or aerial photography.
For our example, you’ll be using the digitizing approach. Sample raster datasets are provided, so you’ll need to import them as necessary.
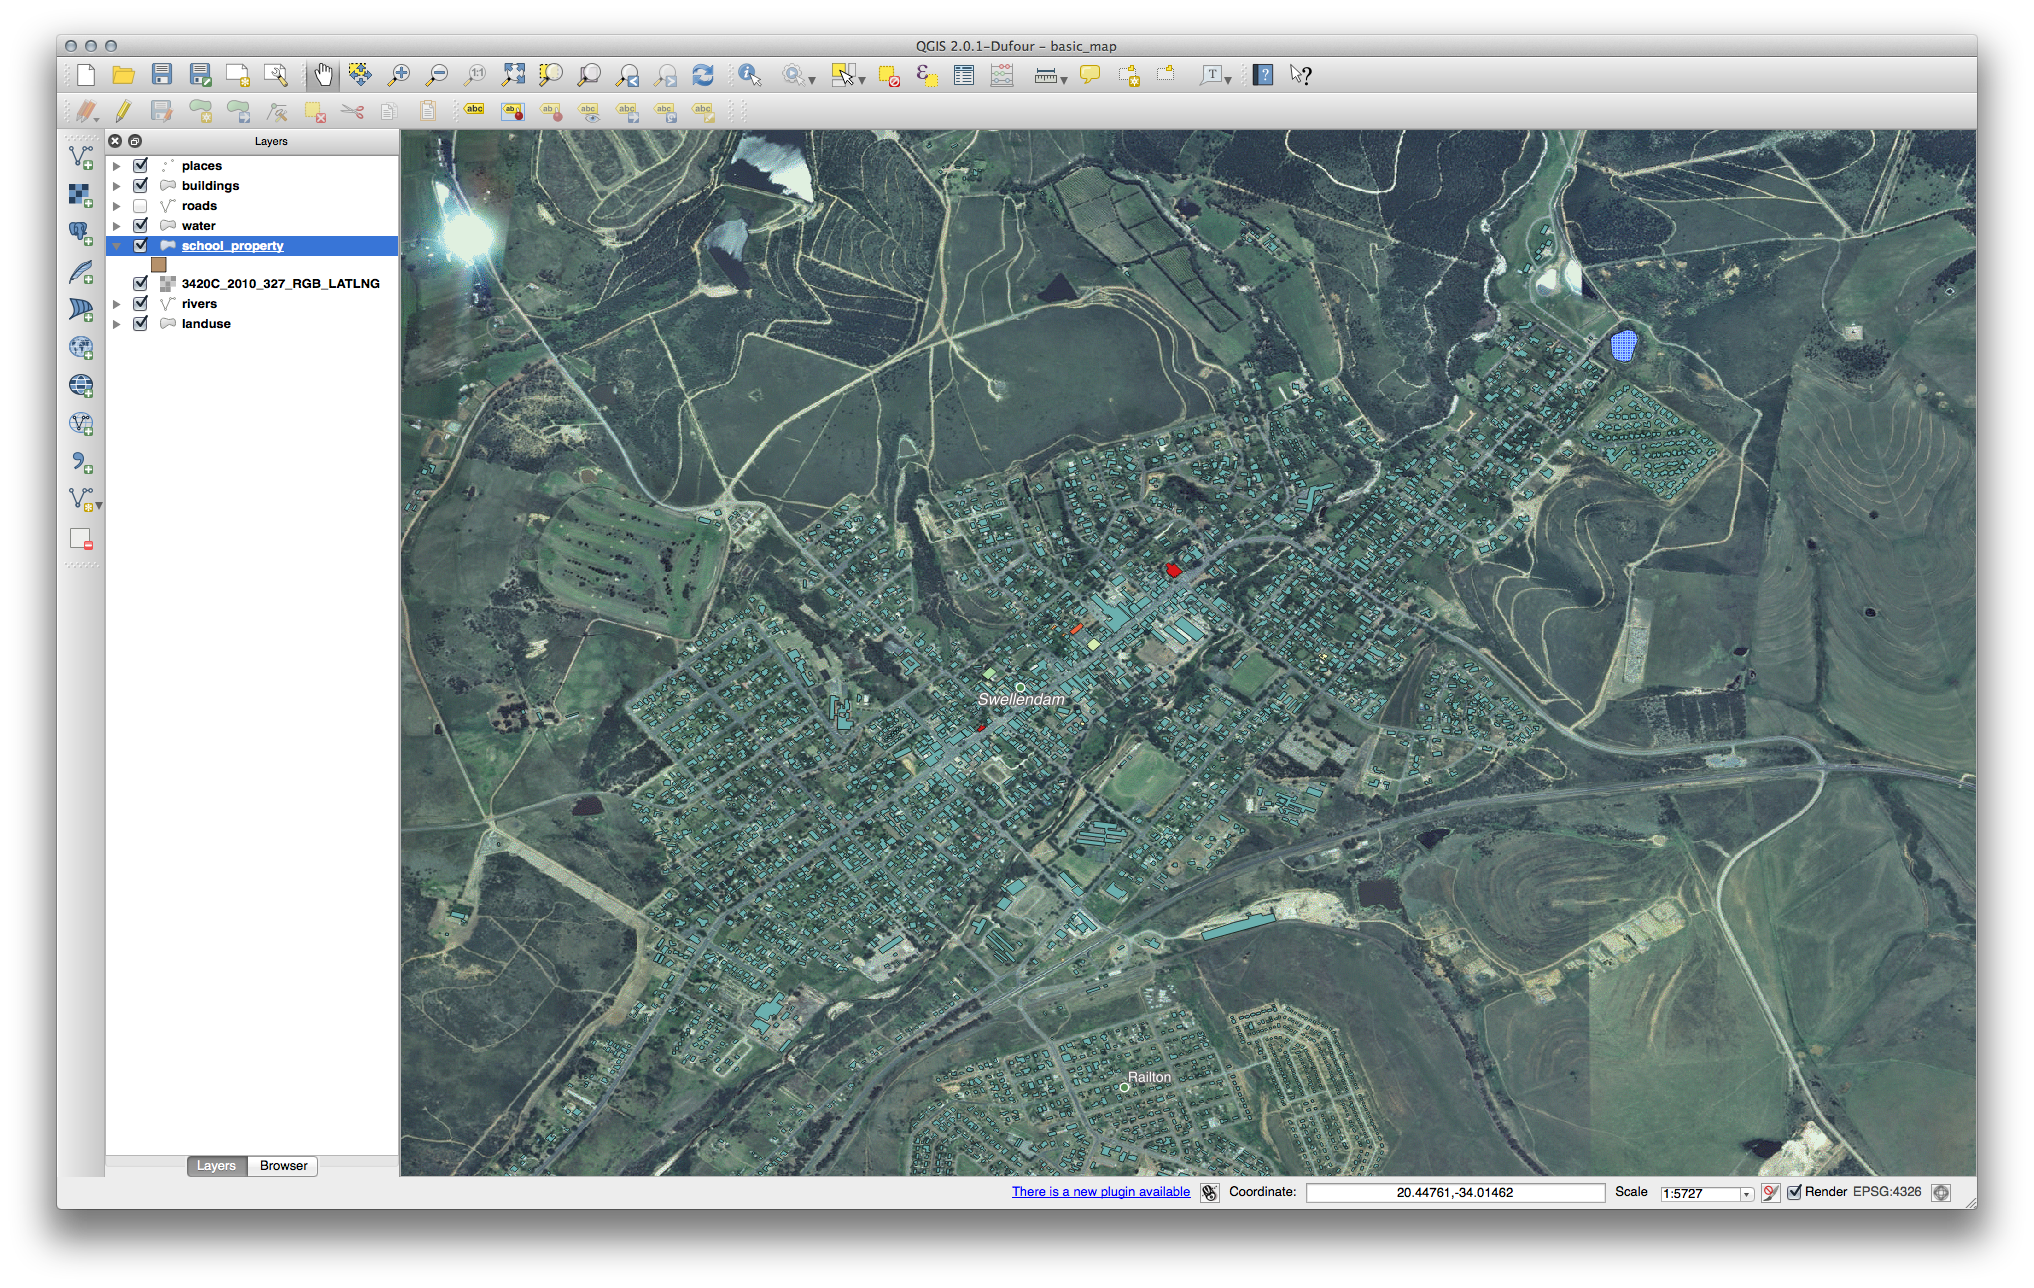
Click on the Add Raster Layer button:

Navigate to exercise_data/raster/.
Select the file 3420C_2010_327_RGB_LATLNG.tif.
Click Open. An image will load into your map.
Find the new image in the Layers panel.
Click and drag it to the bottom of the list so that you can still see your other layers.
Find and zoom to this area:
Note
If your buildings layer symbology is covering part or all of the raster layer, you can temporarily disable the layer by deselecting it in the Layers panel. You may also wish to hide the roads symbology if you find it distracting.
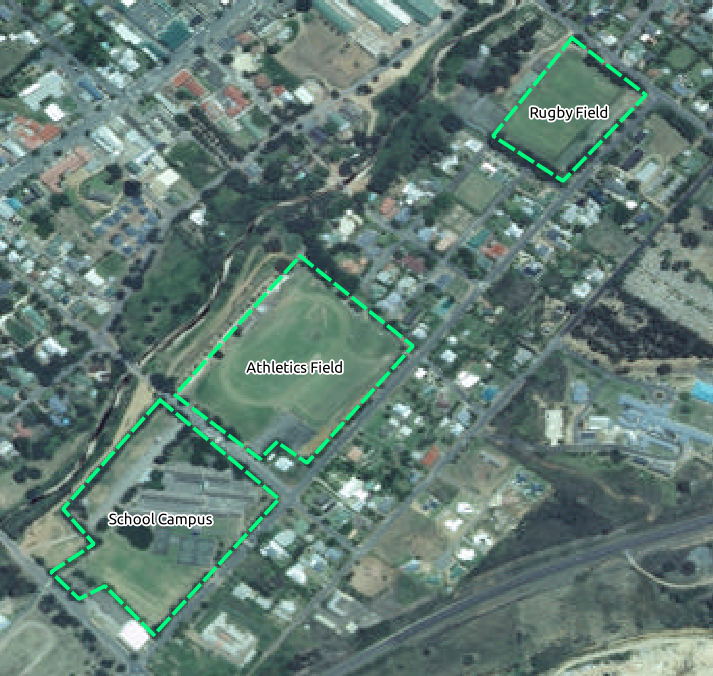
You’ll be digitizing these three fields:
In order to begin digitizing, you’ll need to enter edit mode. GIS software commonly requires this to prevent you from accidentally editing or deleting important data. Edit mode is switched on or off individually for each layer.
To enter edit mode for the school_property layer:
Click on the layer in the Layer list to select it. (Make very sure that the correct layer is selected, otherwise you’ll edit the wrong layer!)
Click on the Toggle Editing button:

If you can’t find this button, check that the Digitizing toolbar is enabled. There should be a check mark next to the menu entry.
As soon as you are in edit mode, you’ll see the digitizing tools are now active:


Four other relevant buttons are still inactive, but will become active when we start interacting with our new data:


From left to right on the toolbar, they are:
Save Edits: saves changes made to the layer.
Add Feature: start digitizing a new feature.
Move Feature(s): move an entire feature around.
Node Tool: move only one part of a feature.
Delete Selected: delete the selected feature.
Cut Features: cut the selected feature.
Copy Features: copy the selected feature.
Paste Features: paste a cut or copied feature back into the map.
You want to add a new feature.
Click on the Add Feature button now to begin digitizing our school fields.
You’ll notice that your mouse cursor has become a crosshair. This allows you to more accurately place the points you’ll be digitizing. Remember that even as you’re using the digitizing tool, you can zoom in and out on your map by rolling the mouse wheel, and you can pan around by holding down the mouse wheel and dragging around in the map.
The first feature you’ll be digitizing is the athletics field:
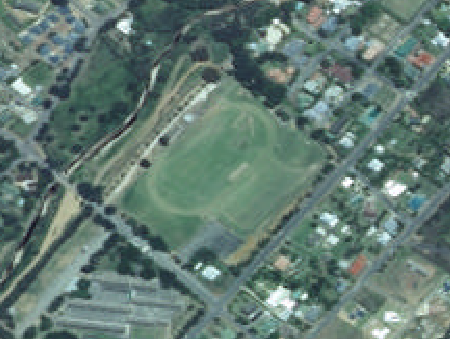
Start digitizing by clicking on a point somewhere along the edge of the field.
Place more points by clicking further along the edge, until the shape you’re drawing completely covers the field.
After placing your last point, right-click to finish drawing the polygon. This will finalize the feature and show you the Attributes dialog.
Fill in the values as below:
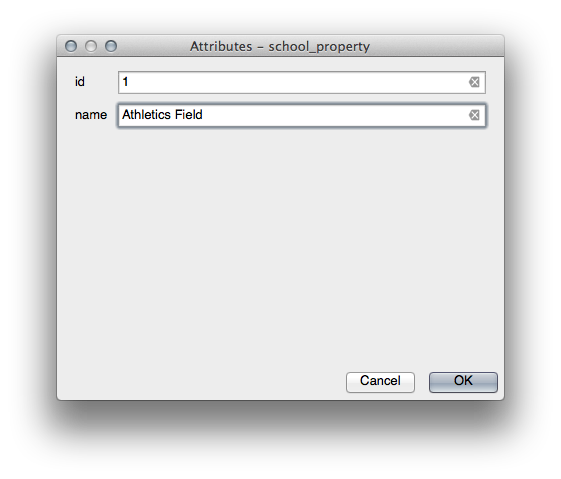
Click OK and you’ve created a new feature!
Remember, if you’ve made a mistake while digitizing a feature, you can always edit it after you’re done creating it. If you’ve made a mistake, continue digitizing until you’re done creating the feature as above. Then:
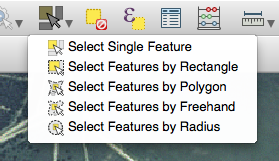
Select the feature with the Select Single Feature tool:
You can use:
the Move Feature(s) tool to move the entire feature,
the Node Tool to move only one point where you may have miss-clicked,
Delete Selected to get rid of the feature entirely so you can try again, and
the menu item or the Ctrl+Z keyboard shortcut to undo mistakes.
6.1.3. Try Yourself
Digitize the school itself and the upper field. Use this image to assist you:
Remember that each new feature needs to have a unique id value!
Note
When you’re done adding features to a layer, remember to save your edits and then exit edit mode.
Note
You can style the fill, outline and label placement and formatting of the school_property using techniques learnt in earlier lessons. In our example, we will use a dashed outline of light purple color with no fill.
6.1.4. Try Yourself
Create a new line feature called routes.shp with attributes id and type. (Use the approach above to guide you.)
We’re going to digitize two routes which are not already marked on the roads layer; one is a path, the other is a track.
Our path runs along the southern edge of the suburb of Railton, starting and ending at marked roads:
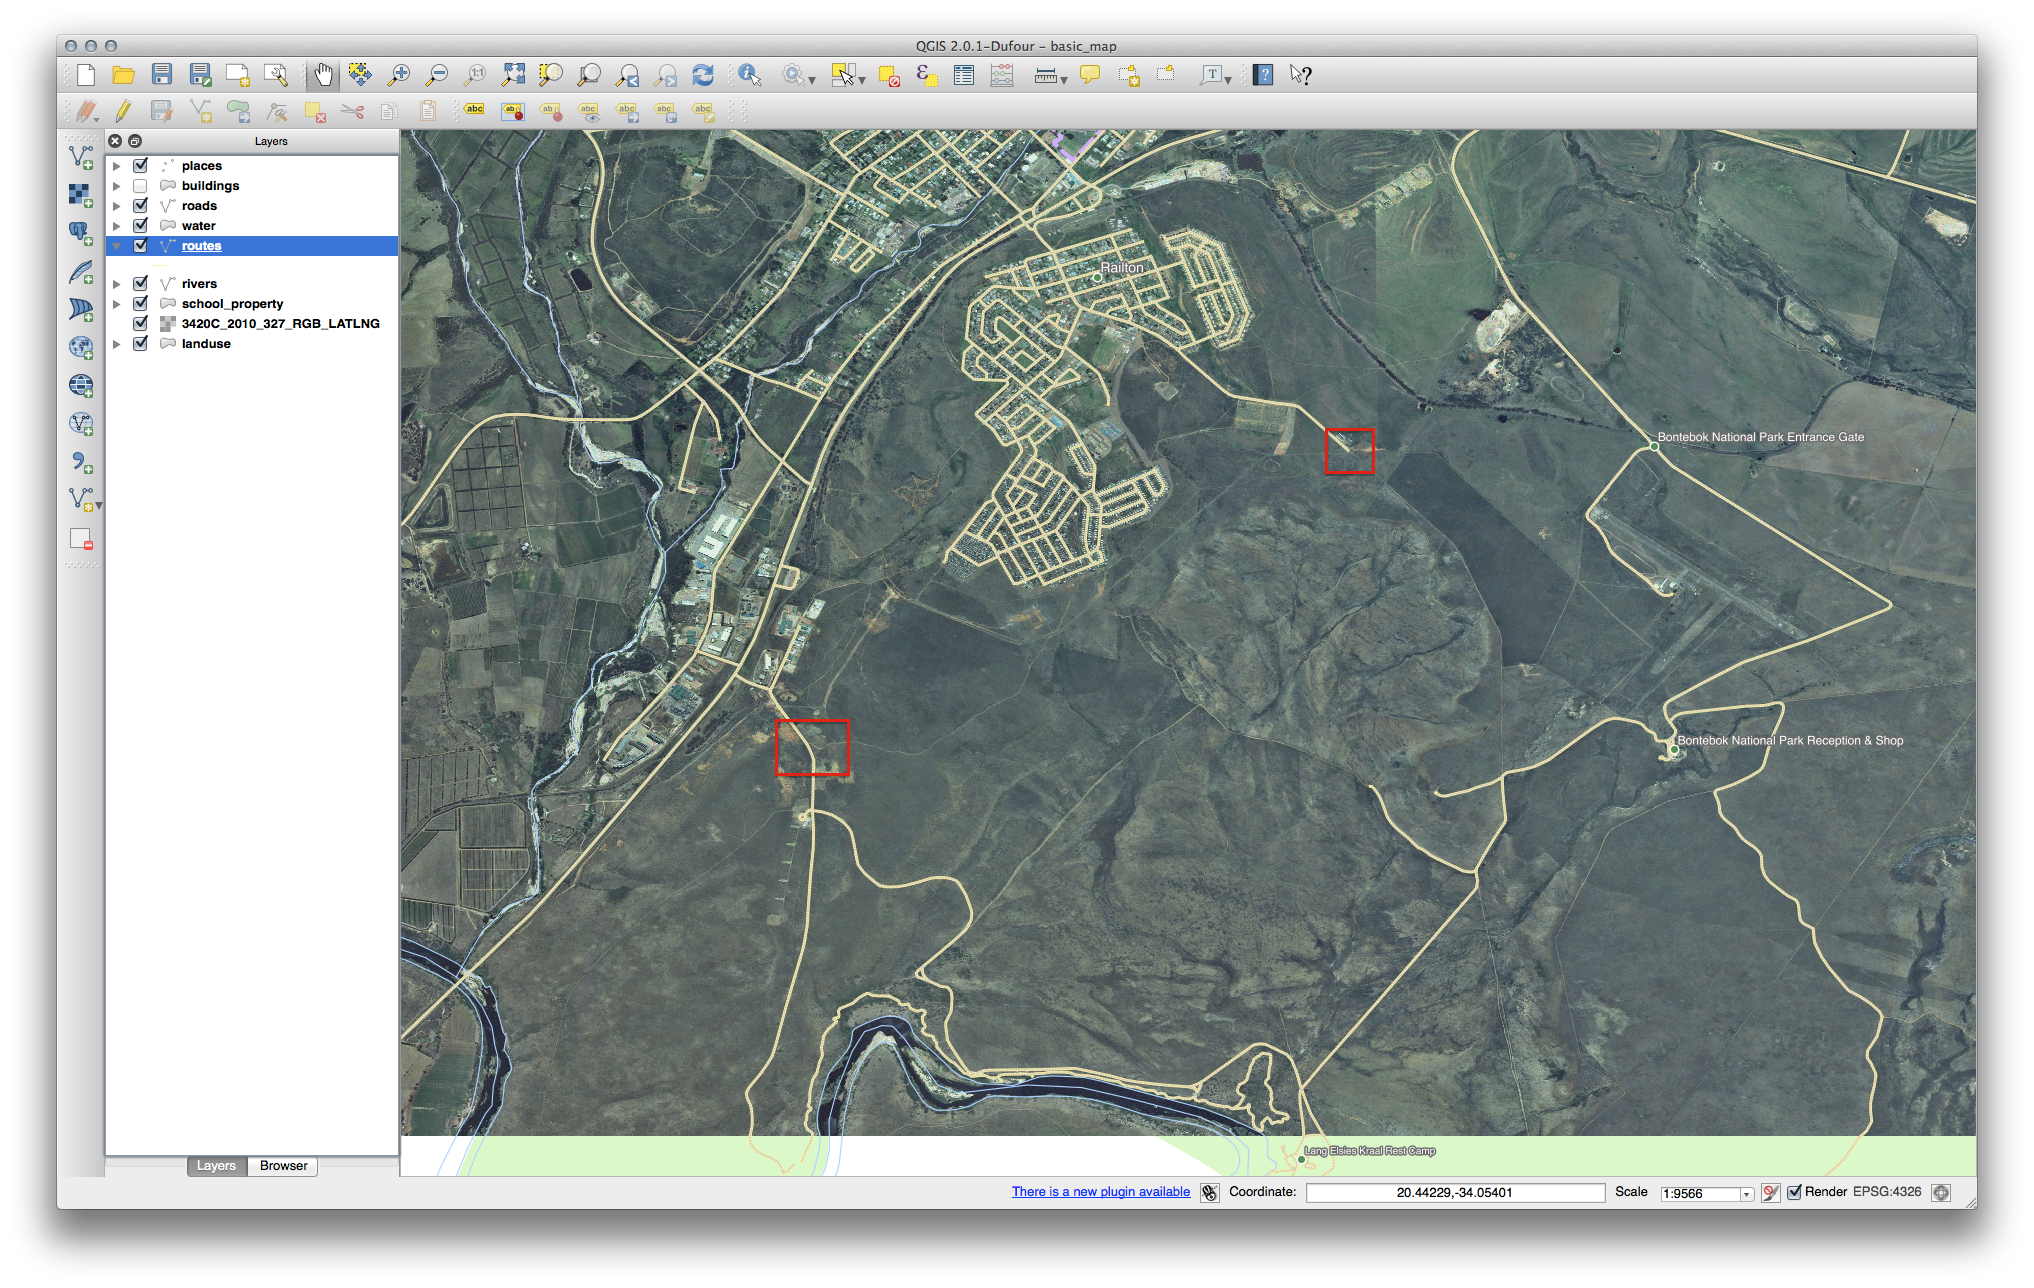
Our track is a little further to the south:

One at a time, digitize the path and the track on the routes layer. Try to follow the routes as accurately as possible, using points (left-click) at any corners or turns.
When creating each route, give them the type attribute value of path or track.
You’ll probably find that only the points are marked; use the Layer Properties dialog to add styling to your routes. Feel free to give different styles to the path and track.
Save your edits and toggle Edit mode.
6.1.5. In Conclusion
Now you know how to create features! This course doesn’t cover adding point features, because that’s not really necessary once you’ve worked with more complicated features (lines and polygons). It works exactly the same, except that you only click once where you want the point to be, give it attributes as usual, and then the feature is created.
Knowing how to digitize is important because it’s a very common activity in GIS programs.
6.1.6. What’s Next?
Features in a GIS layer aren’t just pictures, but objects in space. For example, adjacent polygons know where they are in relation to one another. This is called topology. In the next lesson you’ll see an example of why this can be useful.