Svarbu
Vertimas yra bendruomenės pastangos jūs galite prisijungti. Šis puslapis šiuo metu išverstas 23.29%.
19. Working with Vector Tiles
19.1. What are Vector Tiles?
Vector tiles are packets of geographic data, packaged into pre-defined roughly-square shaped „tiles“ for transfer over the web. They combine pre-rendered raster map tiles and vector map tiles. The vector tile server returns vector map data, which has been clipped to the boundaries of each tile, instead of a pre-rendered map image. The clipped tiles represent the zoom-levels of the vector tile service, derived from a pyramid approach. Using this structure, the data-transfer is reduced in comparison to un-tiled vector maps. Only data within the current map view, and at the current zoom level need to be transferred. Also, compared to a tiled raster map, data transfer is also greatly reduced, as vector data is typically much smaller than a rendered bitmap. Vector tiles do not have any styling information assigned so QGIS needs to apply a cartographic style in order to display the data.
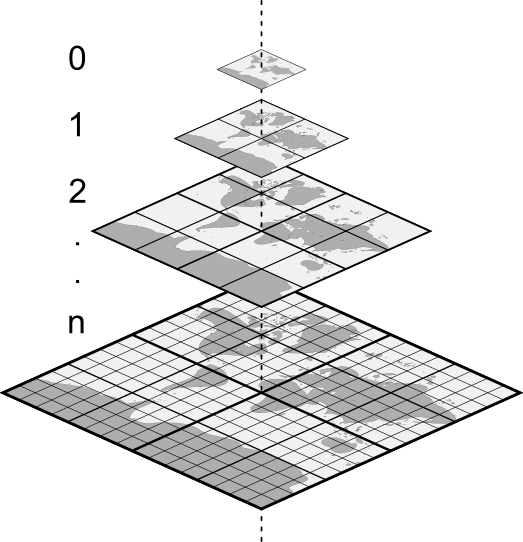
Fig. 19.1 Pyramid structure of vector tiles with zoom-levels
19.2. Supported Formats
There is support for vector tiles through:
remote sources (HTTP/S) - with XYZ template -
type=xyz&url=http://example.com/{z}/{x}/{y}.pbflocal files - with XYZ template - e.g.
type=xyz&url=file:///path/to/tiles/{z}/{x}/{y}.pbflocal MBTiles database - e.g.
type=mbtiles&url=file:///path/to/file.mbtiles
To load a vector tiles dataset into QGIS, use the  Vector Tile tab
in the Data Source Manager dialog.
Read Using Vector Tiles services for more details.
Vector Tile tab
in the Data Source Manager dialog.
Read Using Vector Tiles services for more details.
19.3. Vector Tiles Dataset Properties
The vector tiles Layer Properties dialog provides the following sections:
|
||
|


[1] Also available in the Layer styling panel
19.3.1. Information Properties
The Information tab is read-only and represents an interesting place to quickly grab summarized information and metadata on the current layer. Provided information are:
based on the provider of the layer: name, URI, source type and path, number of zoom levels
the Coordinate Reference System: name, units, method, accuracy, reference (i.e. whether it’s static or dynamic)
picked from the filled metadata: access, extents, links, contacts, history…
19.3.2. Source Properties
The  Source tab displays basic information about
the selected vector tile, including:
Source tab displays basic information about
the selected vector tile, including:
the Layer name to display in the Layers Panel;
the Coordinate Reference System: Displays the layer’s Coordinate Reference System (CRS). You can change the layer’s CRS, by selecting a recently used one in the drop-down list or clicking on the
 Select CRS button (see Koordinačių atskaitos sistemos parinkiklis).
Use this process only if the layer CRS is wrong or not specified.
Select CRS button (see Koordinačių atskaitos sistemos parinkiklis).
Use this process only if the layer CRS is wrong or not specified.
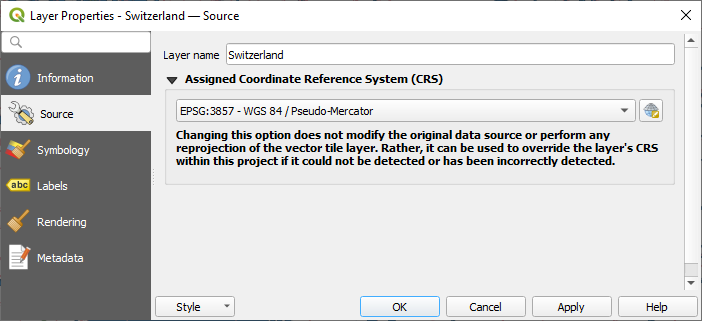
Fig. 19.2 Vector Tiles Properties - Source Dialog
19.3.3. Symbology and Labels Properties
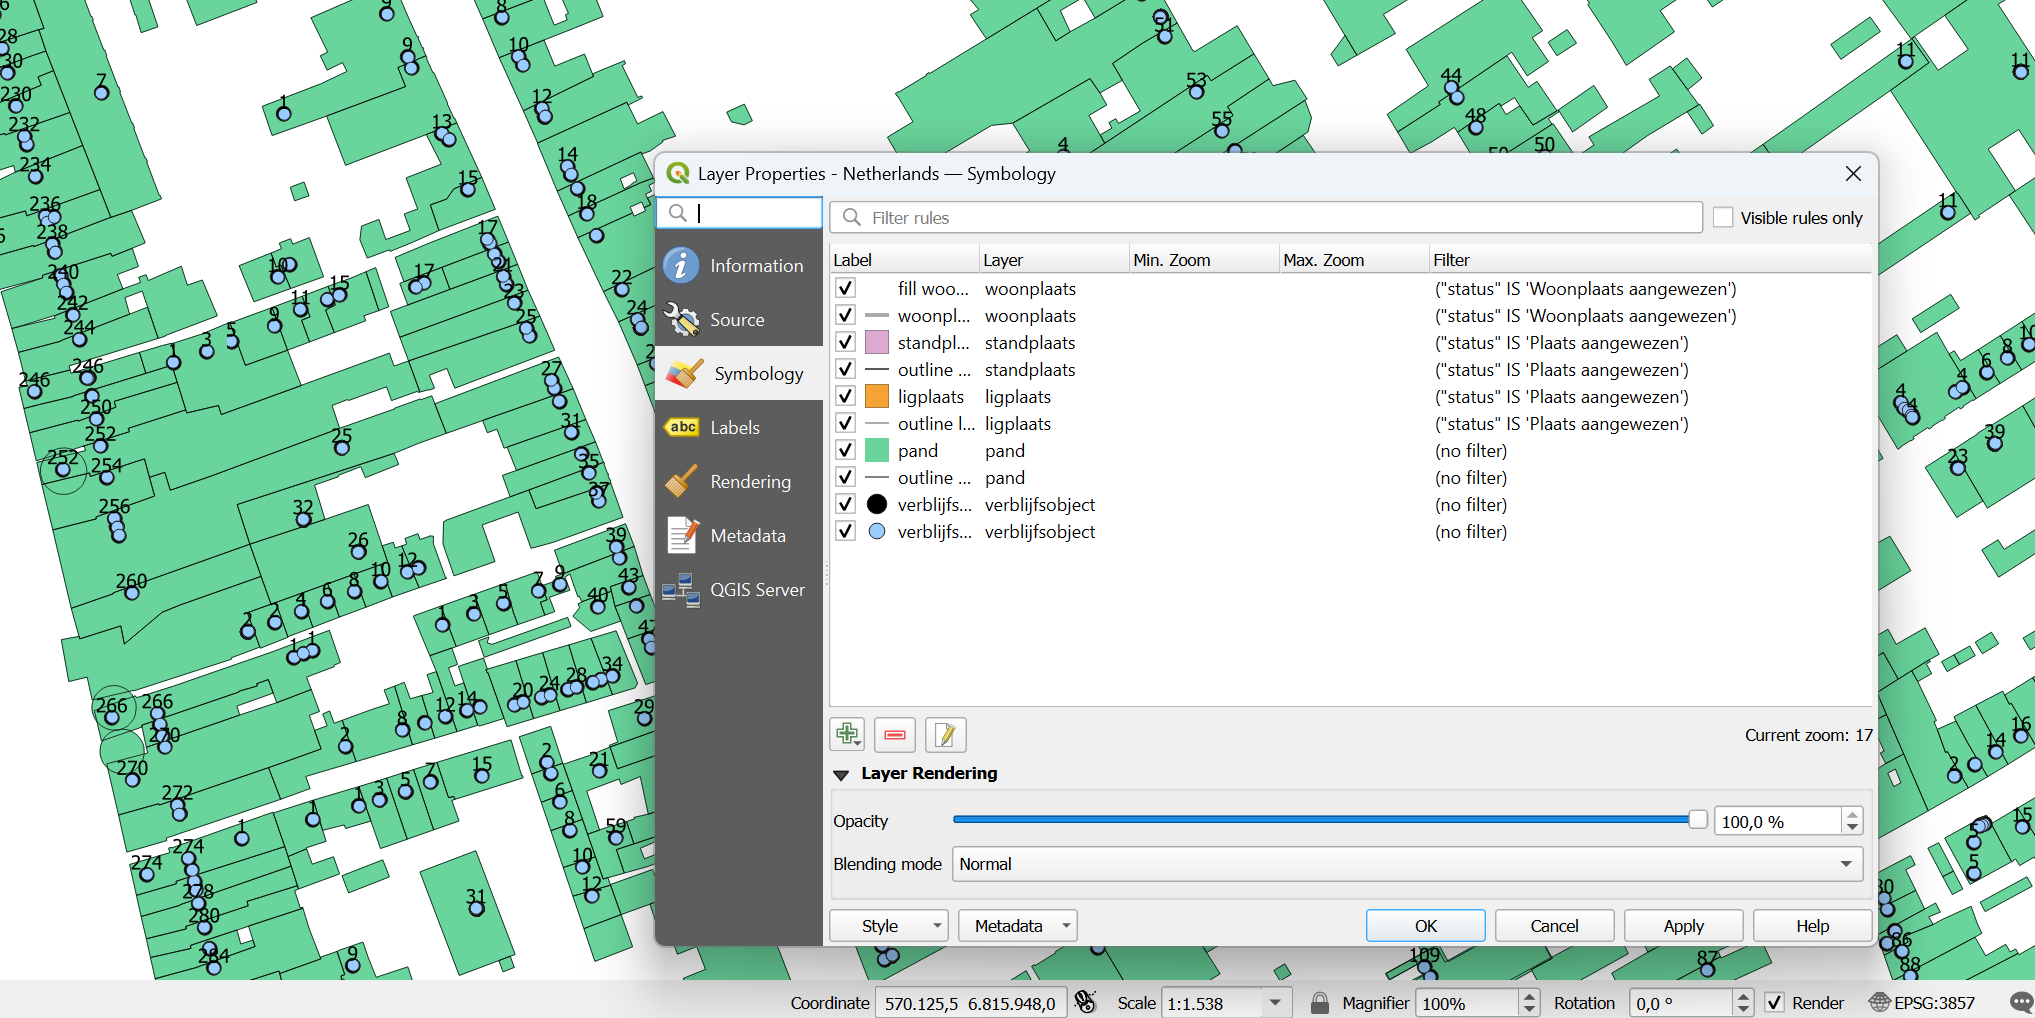
Fig. 19.3 Vector Tile Layer Symbology
19.3.3.1. Setting rules
As vector tiles consist of point, line and polygon geometries, the respective symbols are available. To apply a cartographic style (with symbology and/or labels), you can either:
Use a Style URL when creating the Vector Tiles Connection. The symbology will be shown immediately in the
 Symbology tab
after the layer is loaded in QGIS.
Symbology tab
after the layer is loaded in QGIS.Or build your own symbology and labeling in the corresponding tabs of the layer properties. By default, QGIS assigns an identical symbol to the features based on their geometry type.
In both cases, setting a style for a vector tile relies on a set of rules applied to the features, indicating:
a Label, a title for comprehensive identification of the rule
the name of a particular Layer the rule should apply to, if not applied to
(all layers)a Min. Zoom and a Max. Zoom, for the range of display. Symbology and labeling can be dependent on the zoom level.
a Filter, a QGIS expression to identify the features to apply the style to
Each rule is added pressing the  Add rule button
and selecting the type of symbols (Marker, Line, Fill)
corresponding to the features geometry type.
You can as well
Add rule button
and selecting the type of symbols (Marker, Line, Fill)
corresponding to the features geometry type.
You can as well  Remove selected rules or
  Edit current rule.
At the bottom the Current Zoom is shown.
Check the  Visible rules only option at the top of the dialog
to filter the list of rules to only those that are visible at the current zoom level.
This makes it easier to work with complex vector styling and to locate troublesome rules.
The
Visible rules only option at the top of the dialog
to filter the list of rules to only those that are visible at the current zoom level.
This makes it easier to work with complex vector styling and to locate troublesome rules.
The  Filter rules text box also helps you easily find a rule,
by searching the Label, Layer and Filter fields.
Filter rules text box also helps you easily find a rule,
by searching the Label, Layer and Filter fields.
In Fig. 19.3 we set up style for the OpenStreetMap landuse layer.
For better visibility most of the rules are deselected.
19.3.3.2. Layer rendering
From the Symbology tab, you can also set some options that invariably act on all features of the layer:
Nepermatomumas: Naudodami šį įrankį jūs galite žemiau esantį sluoksnį matomu. Naudokite slankiklį, kad pritaikytumėte jūsų vektorinio sluoksnio matomumą pagal poreikius. Jūs taipogi galite tiksliai nurodyti matomumo procentą laukelyje greta slankiklio.
Blending mode: You can achieve special rendering effects with these tools that you may previously only know from graphics programs. The pixels of your overlaying and underlaying layers are mixed through the settings described in Blending Modes.
19.3.3.3. Styles
Available at the bottom of most of the tabs, the menu provides shortcuts to save, load, create, switch styles to apply to the vector tiles. Vector tiles can have their style saved from QGIS as QML files and they can be imported as:
QML files (QML - The QGIS Style File Format)
MapBox GL Json style configuration files
More details at Save and Share Layer Properties.
19.3.4. Rendering Properties
Under Scale dependent visibility,
you can set the Maximum (inclusive)
and Minimum (exclusive) scales,
defining a range of scales in which features will be visible.
Out of this range, they are hidden.
The  Set to current canvas scale button helps you
use the current map canvas scale as boundary of the range visibility.
See Visibility Scale Selector for more information.
Set to current canvas scale button helps you
use the current map canvas scale as boundary of the range visibility.
See Visibility Scale Selector for more information.
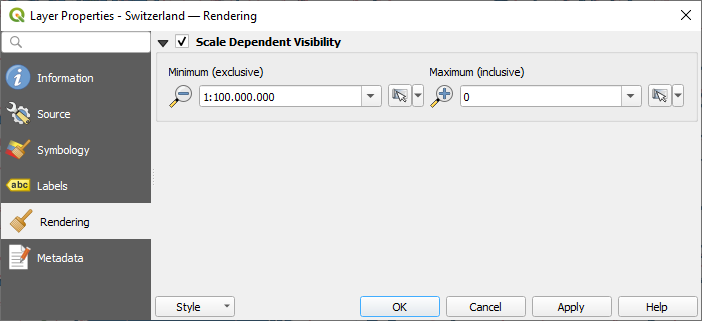
Fig. 19.4 Vector Tiles Properties - Rendering Dialog
19.3.5. Metaduomenų savybės
The  Metadata tab provides you with options
to create and edit a metadata report on your layer.
See Metadata for more information.
Metadata tab provides you with options
to create and edit a metadata report on your layer.
See Metadata for more information.