14.2. Lesson: Georeferencing a Map
A common forestry task would be the update of the information for a forestry area. It is possible that the previous information for that area dates several years back and was collected analogically (that is, in paper) or perhaps it was digitized but all you have left is the paper version of that inventory data.
Most likely you would like to use that information in your GIS to, for example, compare later with later inventories. This means that you will need to digitize the information at hand using your GIS software. But before you can start the digitizing, there is an important first step to be done, scanning and georeferencing your paper map.
The goal for this lesson: To learn to use the Georeferencer tool in QGIS.
14.2.1. ★☆☆ Scan the map
The first task you will have to do is to scan your map. If your map is too big, then you can scan it in different parts but keep in mind that you will have to repeat preprocessing and georeferencing tasks for each part. So if possible, scan the map in as few parts as possible.
If you are going to use a different map that the one provided with this manual, use your own scanner to scan the map as an image file, a resolution of 300 DPI will do. If your map has colors, scan the image in color so that you can later use those colors to separate information from your map into different layers (for ex., forest stands, contour lines, roads…).
For this exercise you will use a previously scanned map, you can find it as
rautjarvi_map.tif in the data folder exercise_data/forestry
14.2.2. ★☆☆ Follow Along: Georeferencing the scanned map
Open QGIS and set the project’s CRS to
EPSG:3067 - ETRS89 / TM35FIN(E,N)in , which is the currently used CRS in Finland.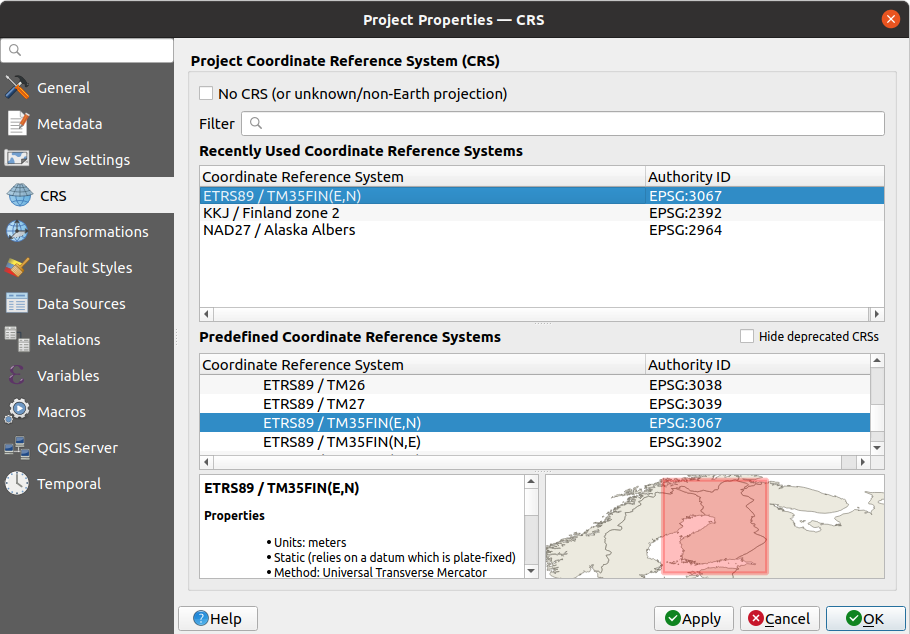
Save the QGIS project as
map_digitizing.qgs.
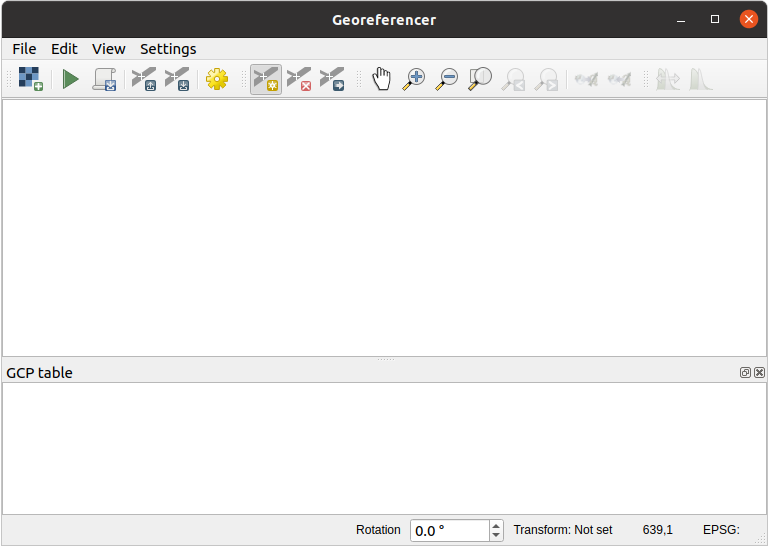
You will use the georeferencing tool from QGIS named Georeferencer. To georeference the map:
Open the georeference tool,
 .
.
Add the map image file,
rautjarvi_map.tif, as the image to georeference, .Click OK.
Next you should define the transformation settings for georeferencing the map:
Open .
Set the Transformation type to
Linearand the Resampling method toNearest neighbour.Press the
 Select CRS button next to
the Target SRS option and select the
Select CRS button next to
the Target SRS option and select the EPSG:2392 - KKJ / Finland zone 2CRS; it is the CRS that was used in Finland back in 1994 when this map was created.Click the icon next to the Output raster box, go to the folder and create the folder
exercise_data\forestry\digitizingand name the file asrautjarvi_georef.tif.Check
 Load in QGIS when done
Leave the rest of parameters as default.
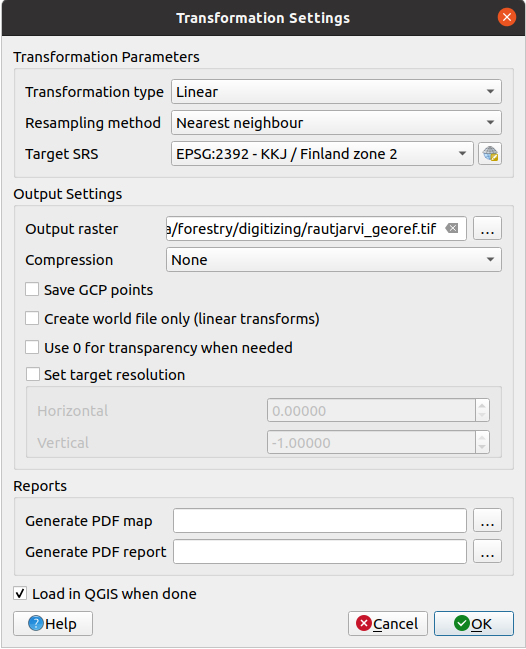
Click OK.
The map contains several cross-hairs marking the coordinates in the map, we will use those to georeference this image. You can use the zooming and panning tools as you usually do in QGIS to inspect the image in the Georeferencer’s window.
Zoom in to the left lower corner of the map and note that there is a cross-hair with a coordinate pair, X and Y, that as mentioned before are in
KKJ / Finland
zone 2
CRS. You will use this point as the first ground control point for the georeferencing your map.Select the Add point tool and click in the intersection of the cross-hairs (pan and zoom as needed).
In the Enter map coordinates dialogue write the coordinates that appear in the map (X: 2557000 and Y: 6786000) and their CRS (
EPSG:2392 - KKJ / Finland zone 2)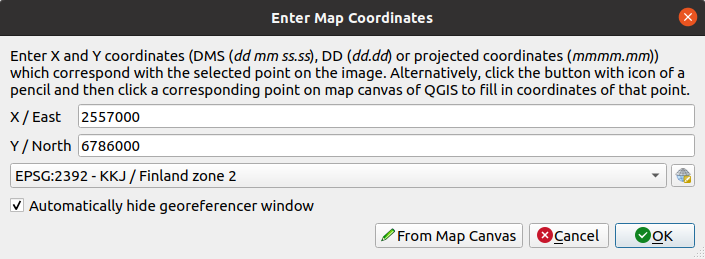
Click OK.
The first coordinate for the georeferencing is now ready.
Look for other black cross-hairs in the image, they are separated 1000 meters from each other both in North and East direction. You should be able to calculate the coordinates of those points in relation to the first one.
Zoom out in the image and move to the right or the top until you find other cross-hair, and estimate how many kilometres you have moved. Try to get ground control points as far from each other as possible.
Digitize at least three more ground control points in the same way you did the first one. You should end up with something similar to this:
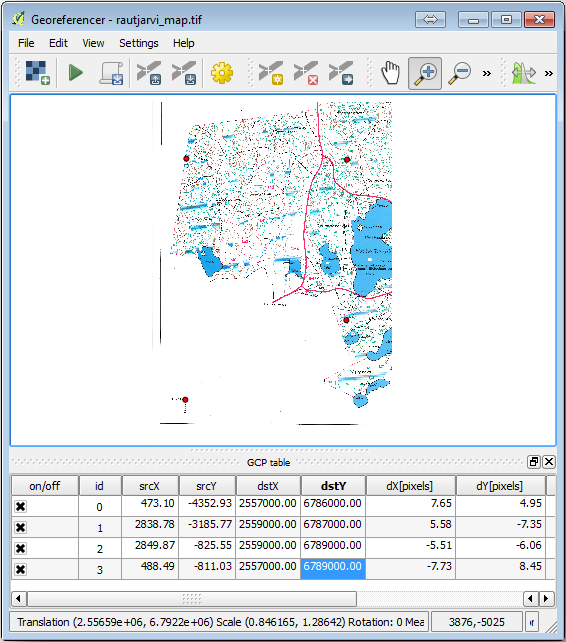
With already three digitized ground control points you will be able to see the georeferencing error as a red line coming out of the points. The error in pixels can be seen also in the GCP table in the dX[pixels] and dY[pixels] columns. The error in pixels should not be higher than 10 pixels. If it is, you should review the points you have digitized and the coordinates you have entered to find what the problem is. You can use the image above as a guide.
Once you are happy with your control points, you can save them for later use:
Go to .
In the folder
exercise_data\forestry\digitizing, name the filerautjarvi_map.tif.points.
Finally, georeference your map:
Go to .
Note that you named the file already as
rautjarvi_georef.tifwhen you edited the Georeferencer settings.Now you can see the map in QGIS project as a georeferenced raster. Note that the raster seems to be slightly rotated, but that is simply because the data is in
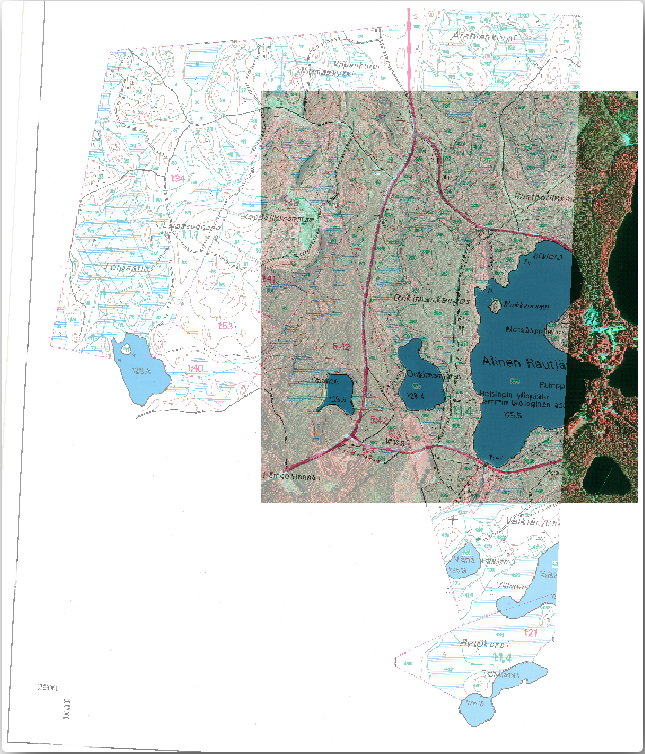
KKJ / Finland zone 2and your project is inETRS89 / TM35FIN(E,N).To check that your data is properly georeferenced, you can
Open the aerial image in the
exercise_data\forestryfolder, namedrautjarvi_aerial.tif.Your map and this image should match quite well: set the map transparency to 50% and compare it to the aerial image.
Save the changes to your QGIS project, you will continue from this point for the next lesson.
14.2.3. In Conclusion
You have now georeferenced a paper map, making it possible to use it as a map layer in QGIS.
14.2.4. What’s Next?
In the next lesson, you will digitize the forest stands in your map as polygons and add the inventory data to them.