18.18. More complex models
Not
In this lesson we will work with a more complex model in the graphical modeler.
The first model that we created in the previous chapter was a very simple one, with just one input and 3 algorithms. More complex models can be created, with different types of inputs and containing more step. For this chapter we will work with a model that creates a vector layer with watersheds, based on a DEM and a threshold value. That will be very useful for calculating several vector layers corresponding to different thresholds, without having to repeat each single step each time.
This lesson does not contain instructions about how to create you model. You already know the necessary steps (we saw them in a previous lesson) and you have already seen the basic ideas about the modeler, so you should try it yourself. Spend a few minutes trying to create your model, and don’t worry about making mistakes. Remember: first add the inputs and then add the algorithms that use them to create the workflow.
In case you could not create the full model yourself and you need some extra help, the data folder corresponding to this lesson contains an ‘almost’ finished version of it. Open the modeler and then open the model file that you will find in the data folder. You should see something like this.
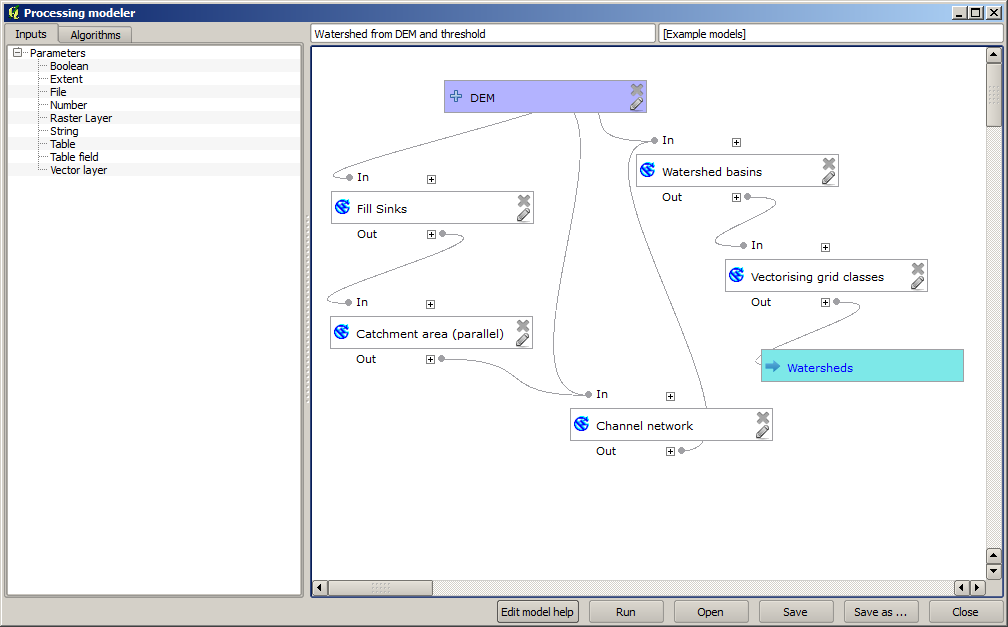
This model contains all the steps needed to complete the calculation, but it just has one input: the DEM. That means that the threshold for channel definition use a fixed value, which makes the model not as useful as it could be. That is not a problem, since we can edit the model, and that is exactly what we will do.
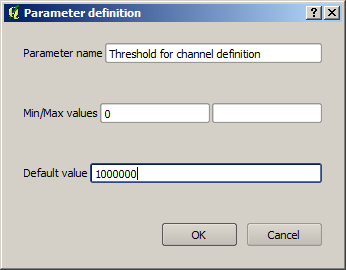
First, let’s add a numerical input. That will ask the user for a numerical input that we can use when such a value is needed in any of the algorithms included in our model. Click on the Number entry in the inputs tree, and you will see the corresponding dialog. Fill it with the values shown next.
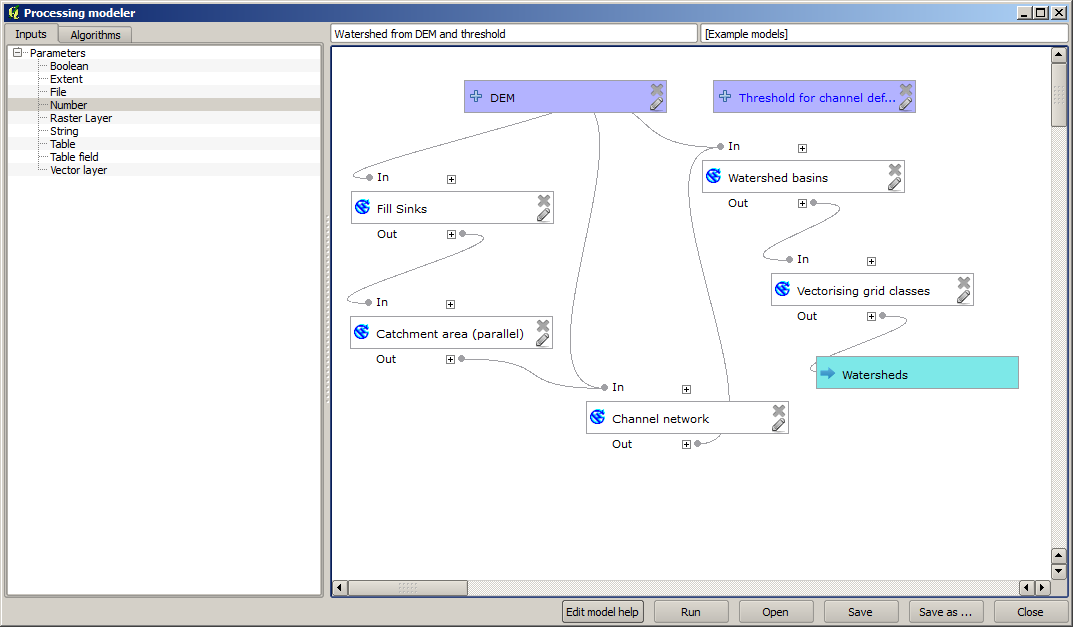
Now your model should look like this.
The input that we have just added is not used, so the model hasn’t actually changed. We have to link that input to the algorithm that uses it, in this case the Channel network one. To edit an algorithm that already exists in the modeler, just click on the pen icon on the corresponding box in the canvas. If you click on the Channel network algorithm, you will see something like this.
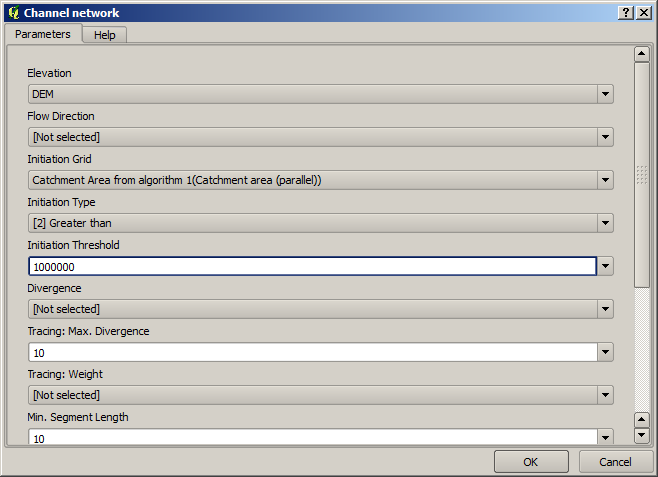
The dialog is filled with the current values used by the algorithm. You can see that the threshold parameter has a fixed value of 1,000,000 (this is also the default value of the algorithm, but any other value could be put in there). However, you might notice that the parameter is not entered in a common text box, but in an option menu. If you unfold it, you will see something like this.
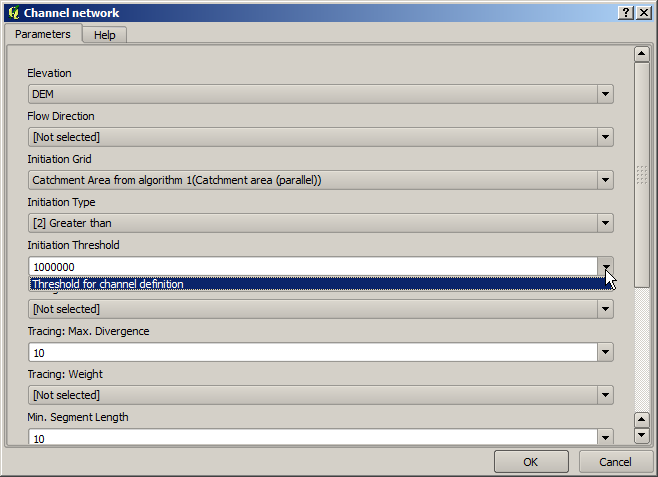
The input that we added is there and we can select it. Whenever an algorithm in a model requires a numerical value, you can hardcode it and directly type it, or you can use any of the available inputs and values (remember that some algorithms generate single numerical values. We will see more about this soon). In the case of a string parameter, you will also see string inputs and you will be able to select one of them or type the desired fixed value.
Select the Threshold input in the Threshold parameter and click on OK to apply the changes to your model. Now the design of the model should look like this.
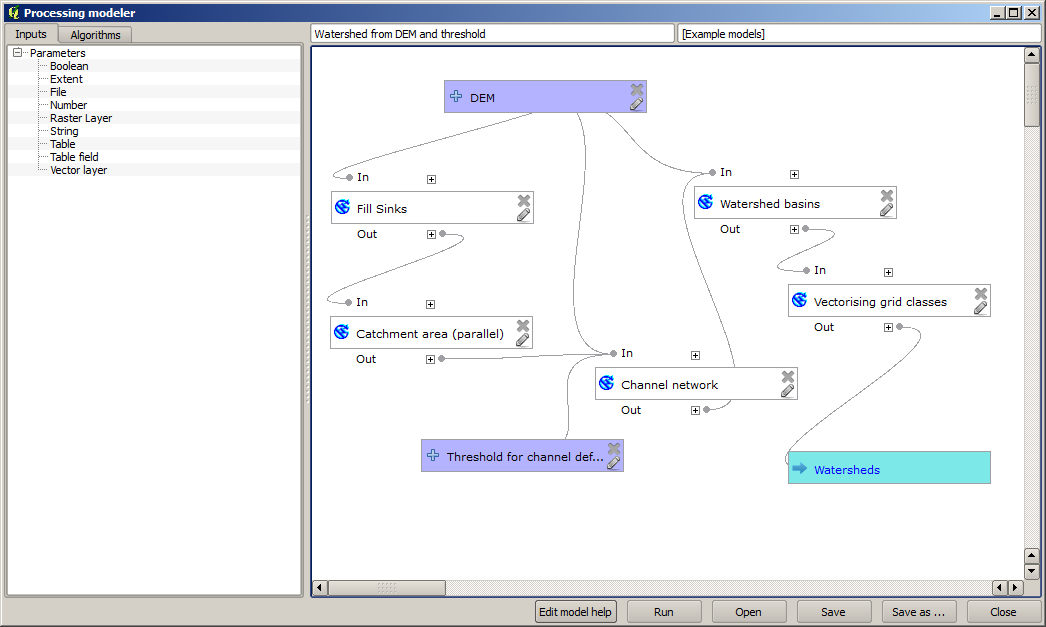
The model is now complete. Try to run it using the DEM that we have used in previous lessons, and with different threshold values. Here you have a sample of the result obtained for different values. You can compare with the result for the default value, which is the one we obtained in the hydrological analysis lesson.
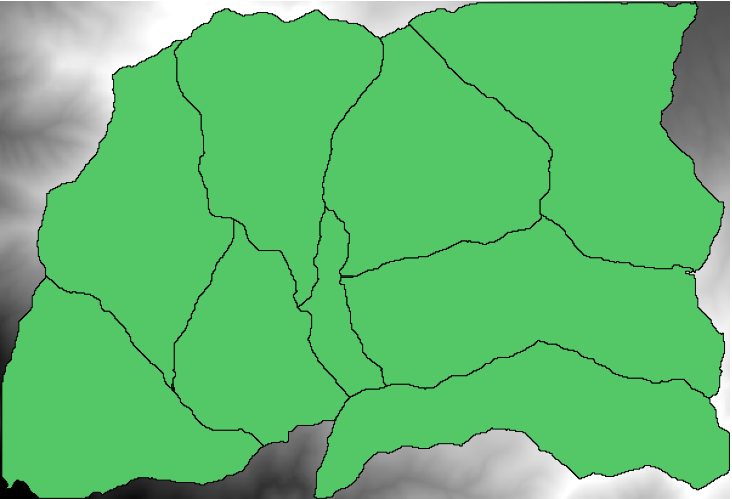
Threshold = 100,000
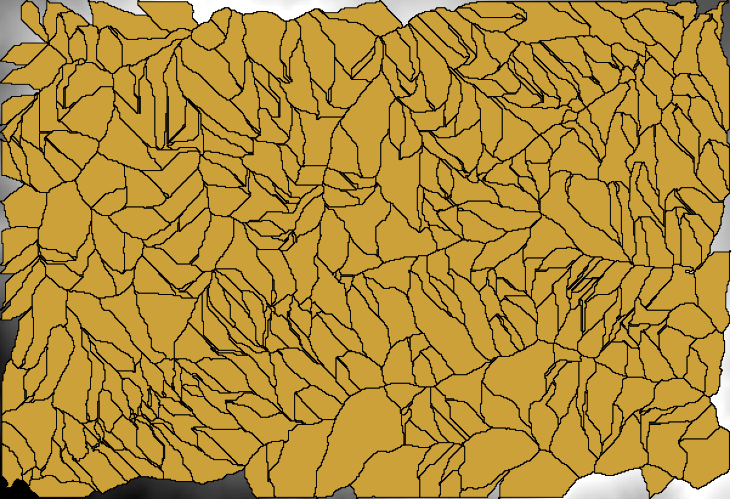
Threshold = 1,0000,000