1.2. A preparar os dados do exercício
The sample data provided with the Training Manual refers to the town of Swellendam and its surroundings. Swellendam is located about 2 hours’ east of Cape Town in the Western Cape of South Africa. The dataset contains feature names in both English and Afrikaans.
Anyone can use this dataset without difficulty, but you may prefer to use data from your own country or home town. If you choose to do so, your localised data will be used in all lessons from Module 3 to Module 7.2. Later modules use more complex data sources which may or may not be available for your region.
Note
This process is intended for course conveners, or more experienced QGIS users who wish to create localised sample data sets for their course. Default data sets are provided with the Training Manual, but you may follow these instructions if you wish to replace the default data sets.
Note
The sample data used throughout the manual can be downloaded here: https://github.com/qgis/QGIS-Training-Data/archive/QGIS-Training-Data-v1.0.zip. You can save the files in a folder named exercise_data.
1.2.1.  Try Yourself
Note
These instructions assume you have a good knowledge of QGIS and are not intended to be used as teaching material.
If you wish to replace the default data set with localised data for your course, this can easily be done with tools built into QGIS. The region you choose to use should have a good mix of urban and rural areas, containing roads of differing significance, area boundaries (such as nature reserves or farms) and surface water, such as streams and rivers.
- Open a new QGIS project
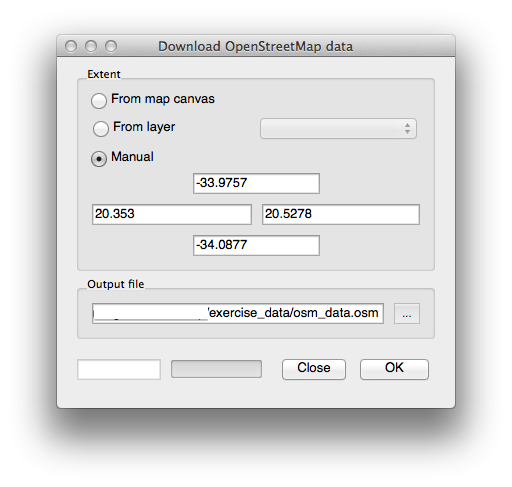
- In the Vector menu dropdown, select OpenStreetMap ‣ Download Data. You can then manually enter the co-ordinates of the region you wish to use, or you can use an existing layer to set the co-ordinates.
- Choose a location to save the resulting .osm file and click Ok:
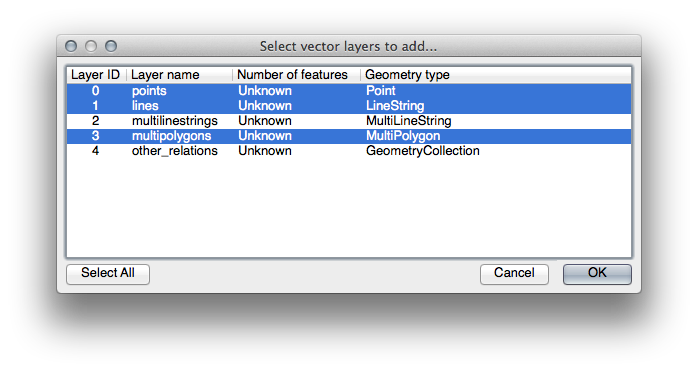
- You can then open the .osm file using the Add Vector Layer button. You may need to select All files in the browser window. Alternatively, you can drag and drop the file into the QGIS window.
- In the dialog which opens, select all the layers, except the other_relations and multilinestrings layer:
This will load three layers into your map which relate to OSM’s naming
conventions (you may need to  Zoom Full to see the
vector data).
Zoom Full to see the
vector data).

We need to extract the useful data from these layers, rename them and create corresponding shape files:
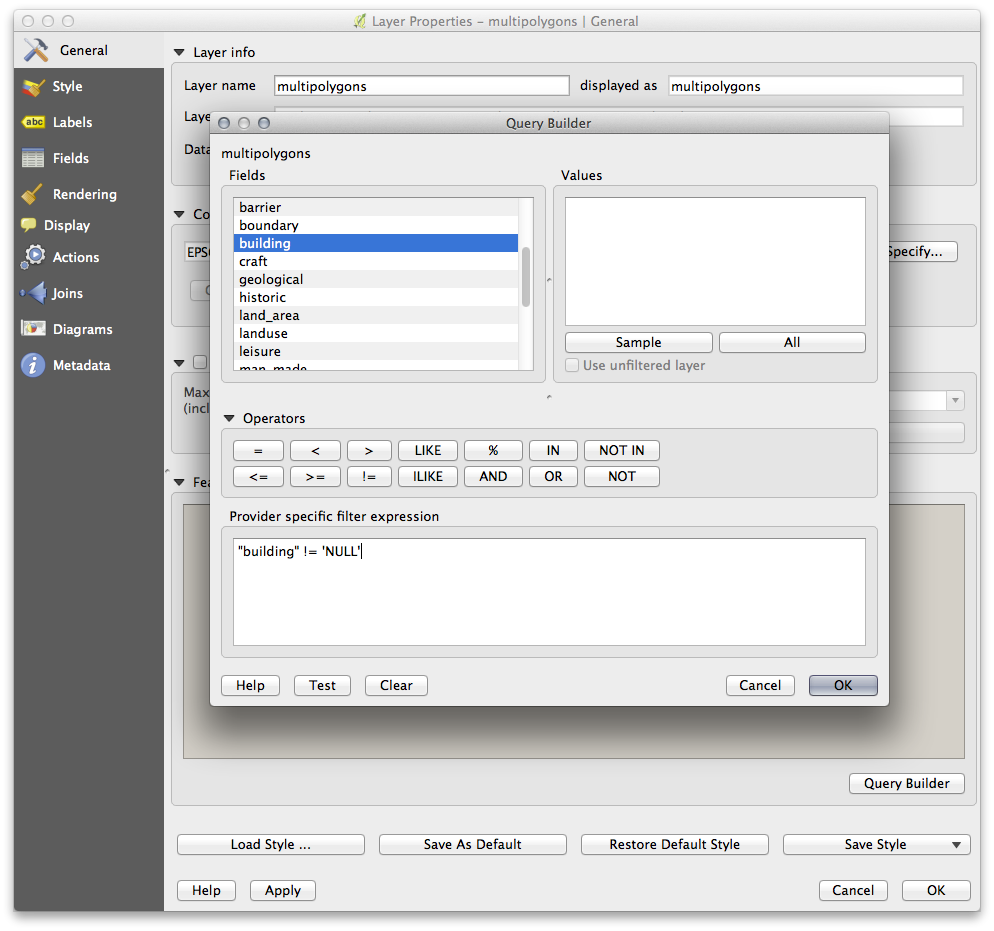
- First, double-click the multipolygons layer to open the Layer properties dialog.
- In the General tab, click Query Builder to open the Query builder window.
This layer contains three fields whose data we will need to extract for use throughout the Training Manual:
- building
- natural (specifically, water)
- landuse
You can sample the data your region contains in order to see what kind of results your region will yield. If you find that “landuse” returns no results, then feel free to exclude it.
You’ll need to write filter expressions for each field to extract the data we need. We’ll use the “building” field as an example here:
- Enter the following expression into the text area: building != "NULL" and click Test to see how many results the query will return. If the number of results is small, you may wish to have a look at the layer’s Attribute Table to see what data OSM has returned for your region:
- Click Ok and you’ll see that the layer elements which are not buildings have been removed from the map.
We now need to save the resulting data as a shapefile for you to use during your course:
- Right-click the multipolygons layer and select Save As...
- Make sure the file type is ESRI Shapefile and save the file in your new exercise_data directory, under a directory called “epsg4326”.
- Make sure No Symbology is selected (we’ll add symbology as part of the course later on).
- You can also select Add saved file to map.
Once the buildings layer has been added to the map, you can repeat the process for the natural and landuse fields using the following expressions:
Note
Make sure you clear the previous filter (via the Layer properties dialog) from the multipolygons layer before proceeding with the next filter expression!
- natural: “natural = ‘water’”
- landuse: “landuse != ‘NULL’”
Each resulting data set should be saved in the “epsg4326” directory in your new exercise_data directory (i.e. “water”, “landuse”).
You should then extract and save the following fields from the lines and points layers to their corresponding directories:
- lines: “highway != ‘NULL’” to roads, and “waterway != ‘NULL’” to rivers
- points: “place != ‘NULL’” to places
Once you have finished extracting the above data, you can remove the multipolygons, lines and points layers.
You should now have a map which looks something like this (the symbology will certainly be very different, but that is fine):
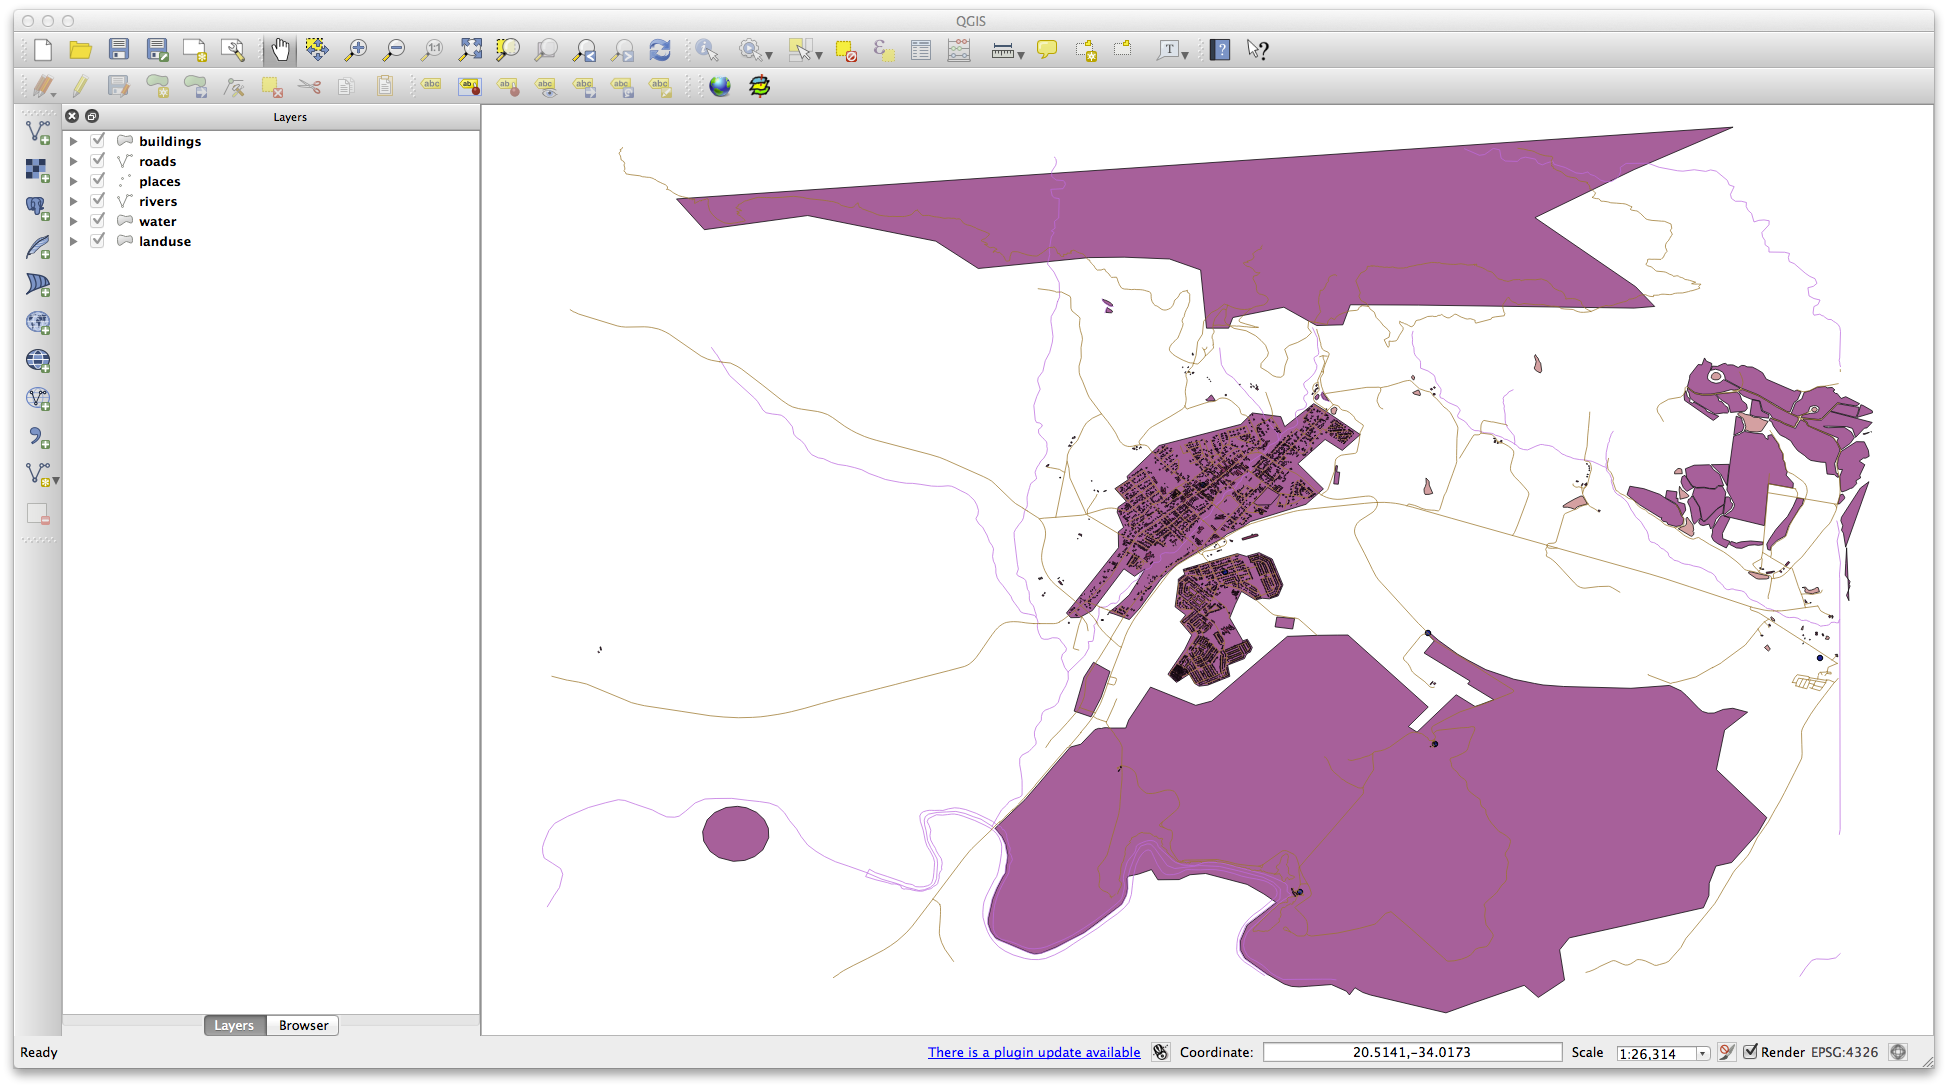
The important thing is that you have 6 layers matching those shown above and that all those layers have some data.
The last step is to create a spatiallite file from the landuse layer for use during the course:
- Right-click the landuse layer and select Save as...
- Select SpatialLite as the format and save the file as landuse under the “epsg4326” directory.
- Click Ok.
- Delete the landuse.shp and its related files (if created).
1.2.2. Try Yourself Create SRTM DEM tiff Files
For Module 6 (Creating Vector Data) and Module 8 (Rasters), you’ll also need raster images (SRTM DEM) which cover the region you have selected for your course.
The CGIAR-CGI (http://srtm.csi.cgiar.org/) provides some SRTM DEM you can download from http://srtm.csi.cgiar.org/SELECTION/inputCoord.asp.
You’ll need images which cover the entire region you have chosen to use. If you kept same data as the training manual, you can use the extent shown in the figure_set_osm_region figure above, otherwise adapt your extent. Keep the GeoTiff format. Once the form is filled, click on the Click here to Begin Search >> button and download the file(s).
Once you have downloaded the required file(s), they should be saved in the exercise_data directory, under raster/SRTM subfolders.
1.2.3. Try Yourself Create imagery tiff Files
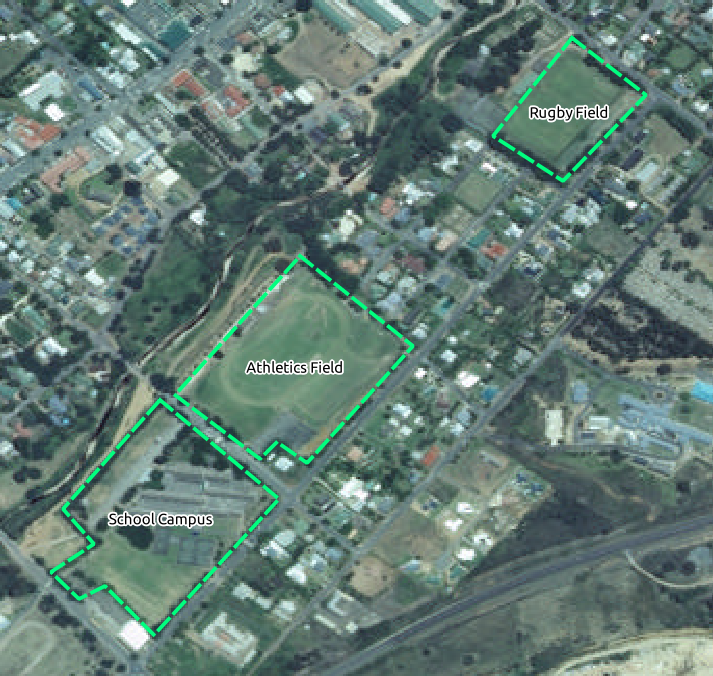
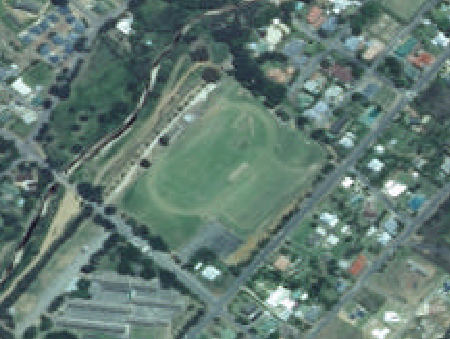
In Module 6, Lesson 1.2 shows close-up images of three school sports fields which students are asked to digitize. You’ll therefore need to reproduce these images using your new SRTM DEM tiff file(s). There is no obligation to use school sports fields: any three school land-use types can be used (e.g. different school buildings, playgrounds or car parks).
For reference, the images in the example data are:
1.2.4.  Try Yourself Replace Tokens
Having created your localised dataset, the final step is to replace the tokens in the conf.py file so that the appropriate names will appear in your localised version of the Training Manual.
The tokens you need to replace are as follows:
- majorUrbanName: this defaults to “Swellendam”. Replace with the name of the major town in your region.
- schoolAreaType1: this defaults to “athletics field”. Replace with the name of the largest school area type in your region.
- largeLandUseArea: this defaults to “Bontebok National Park”. Replace with the name of a large landuse polygon in your region.
- srtmFileName: this defaults to srtm_41_19.tif. Replace this with the filename of your SRTM DEM file.
- localCRS: this defaults to WGS 84 / UTM 34S. You should replace this with the correct CRS for your region.