` `
Complemento Estatística Zonal
With the  Zonal statistics plugin, you can analyze
the results of a thematic classification. It allows you to calculate several values
of the pixels of a raster layer with the help of a polygonal vector layer (see
figure_zonal_statistics). Choosing a color band, the plugin generates output
columns in the vector layer with an user-defined prefix and calculates for each
polygon, statistics on pixels that are within.
The available statistics are :
Zonal statistics plugin, you can analyze
the results of a thematic classification. It allows you to calculate several values
of the pixels of a raster layer with the help of a polygonal vector layer (see
figure_zonal_statistics). Choosing a color band, the plugin generates output
columns in the vector layer with an user-defined prefix and calculates for each
polygon, statistics on pixels that are within.
The available statistics are :
- Count: to count the number of pixels
Sum: para somar os valores de pixel
- Mean: to get the mean of pixel values
- Median: to get the median of pixel values
- StDev: to get the standard deviation of pixel values
- Min: to get the minimum of pixel values
- Max: to get the maximum of pixel values
- Range: to get the range (max - min) of pixel values
- Minority: to get the less represented pixel value
- Majority: to get the most represented pixel value
- Variety: to count the number of distinct pixel values
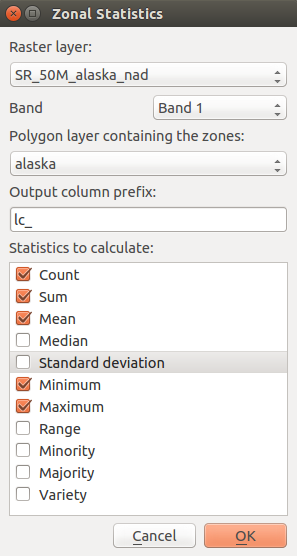
Zonal statistics dialog