7.1. Lesson: Gegevens opnieuw projecteren en transformeren
Laten we het nog eens hebben over Coördinaten ReferentieSystemen (CRS-en). We hebben dit eerder kort behandeld, maar we hebben niet besproken wat het in de praktijk betekent.
Het doel voor deze les: Vector-gegevenssets opnieuw projecteren en transformeren.
7.1.1.  Follow Along: Projecties
Het CRS waarin alle gegevens en ook de kaart nu staan wordt WGS84 genoemd. Dit is een vrij algemeen Geografisch CoördinatenSysteem (GCS) voor het weergeven van gegevens. Maar er is een probleem, zoals we zullen zien.
- Save your current map.
- Then open the map of the world which you’ll find under exercise_data/world/world.qgs.
- Zoom in to South Africa by using the Zoom In tool.
- Try setting a scale in the Scale field, which is in the Status Bar along the bottom of the screen. While over South Africa, set this value to 1:5000000 (one to five million).
- Pan around the map while keeping an eye on the Scale field.
Notice the scale changing? That’s because you’re moving away from the one point that you zoomed into at 1:5000000, which was at the center of your screen. All around that point, the scale is different.
Denk aan een wereldbol om dit te begrijpen. Die heeft lijnen lopen van Noord naar Zuid. Deze lijnen voor de lengtegraad staan ver van elkaar af aan de evenaar, maar ontmoeten elkaar aan de polen.
In een GCS werkt u met deze bol, maar uw scherm is plat. Wanneer u de bol op een plat oppervlak probeert weer te geven, treedt vervorming op, soortgelijk aan die welke zal optreden als u een tennisbal opent en die probeert plat te maken. Wat dit betekent op een kaart is dat de lijnen voor de lengtegraad op gelijke afstand van elkaar blijven, zelfs aan de polen (waar zij verondersteld worden samen te komen). Dit betekent dat, als u op uw kaart vanaf de evenaar weg reist, de schaal van de objecten die u ziet groter en groter worden. Wat dit voor ons in de praktijk betekent is dat er geen constante schaal op uw kaart is!
Laten we in plaats daarvan een geProjecteerd Coördinaten Systeem (PCS) gebruiken, om dit op te lossen. Een PCS “projecteert” of converteert de gegevens op een manier die het mogelijk maakt dat de schaal wijzigt en corrigeert die. Daarom, om de schaal constant te houden, zouden we onze gegevens opnieuw moeten projecteren en een PCS gebruiken.
7.1.2. Follow Along: “Direct” opnieuw projecteren
QGIS allows you to reproject data “on the fly”. What this means is that even if the data itself is in another CRS, QGIS can project it as if it were in a CRS of your choice.
- To enable “on the fly” projection, click on the CRS Status button in the Status Bar along the bottom of the QGIS window:

- In the dialog that appears, check the box next to Enable ‘on the fly’ CRS transformation.
- Type the word global into the Filter field. One CRS (NSIDC EASE-Grid Global) should appear in the list below.
- Click on the NSIDC EASE-Grid Global to select it, then click OK.
Merk op hoe de vorm van Zuid Afrika verandert. Alle projecties werken door de uiterlijke vormen van objecten op aarde te wijzigen.
- Zoom in to a scale of 1:5000000 again, as before.
Schuif over de kaart.
Merk op dat de schaal nu hetzelfde blijft!
“Direct” opnieuw projecteren wordt ook gebruikt voor het combineren van gegevenssets die in verschillende CRS-en staan.
- Deactivate “on the fly” re-projection again:
- Click on the CRS Status button again.
- Un-check the Enable ‘on the fly’ CRS transformation box.
- Clicking OK.
- In QGIS 2.0, the ‘on the fly’ reprojection is automatically activated when
layers with different CRSs are loaded in the map. To understand what
‘on the fly’ reprojection does, deactivate this automatic setting:
- Go to Settings ‣ Options...
- On the left panel of the dialog, select CRS.
- Un-check Automatically enable ‘on the fly’ reprojection if layers have different CRS.
- Click OK.
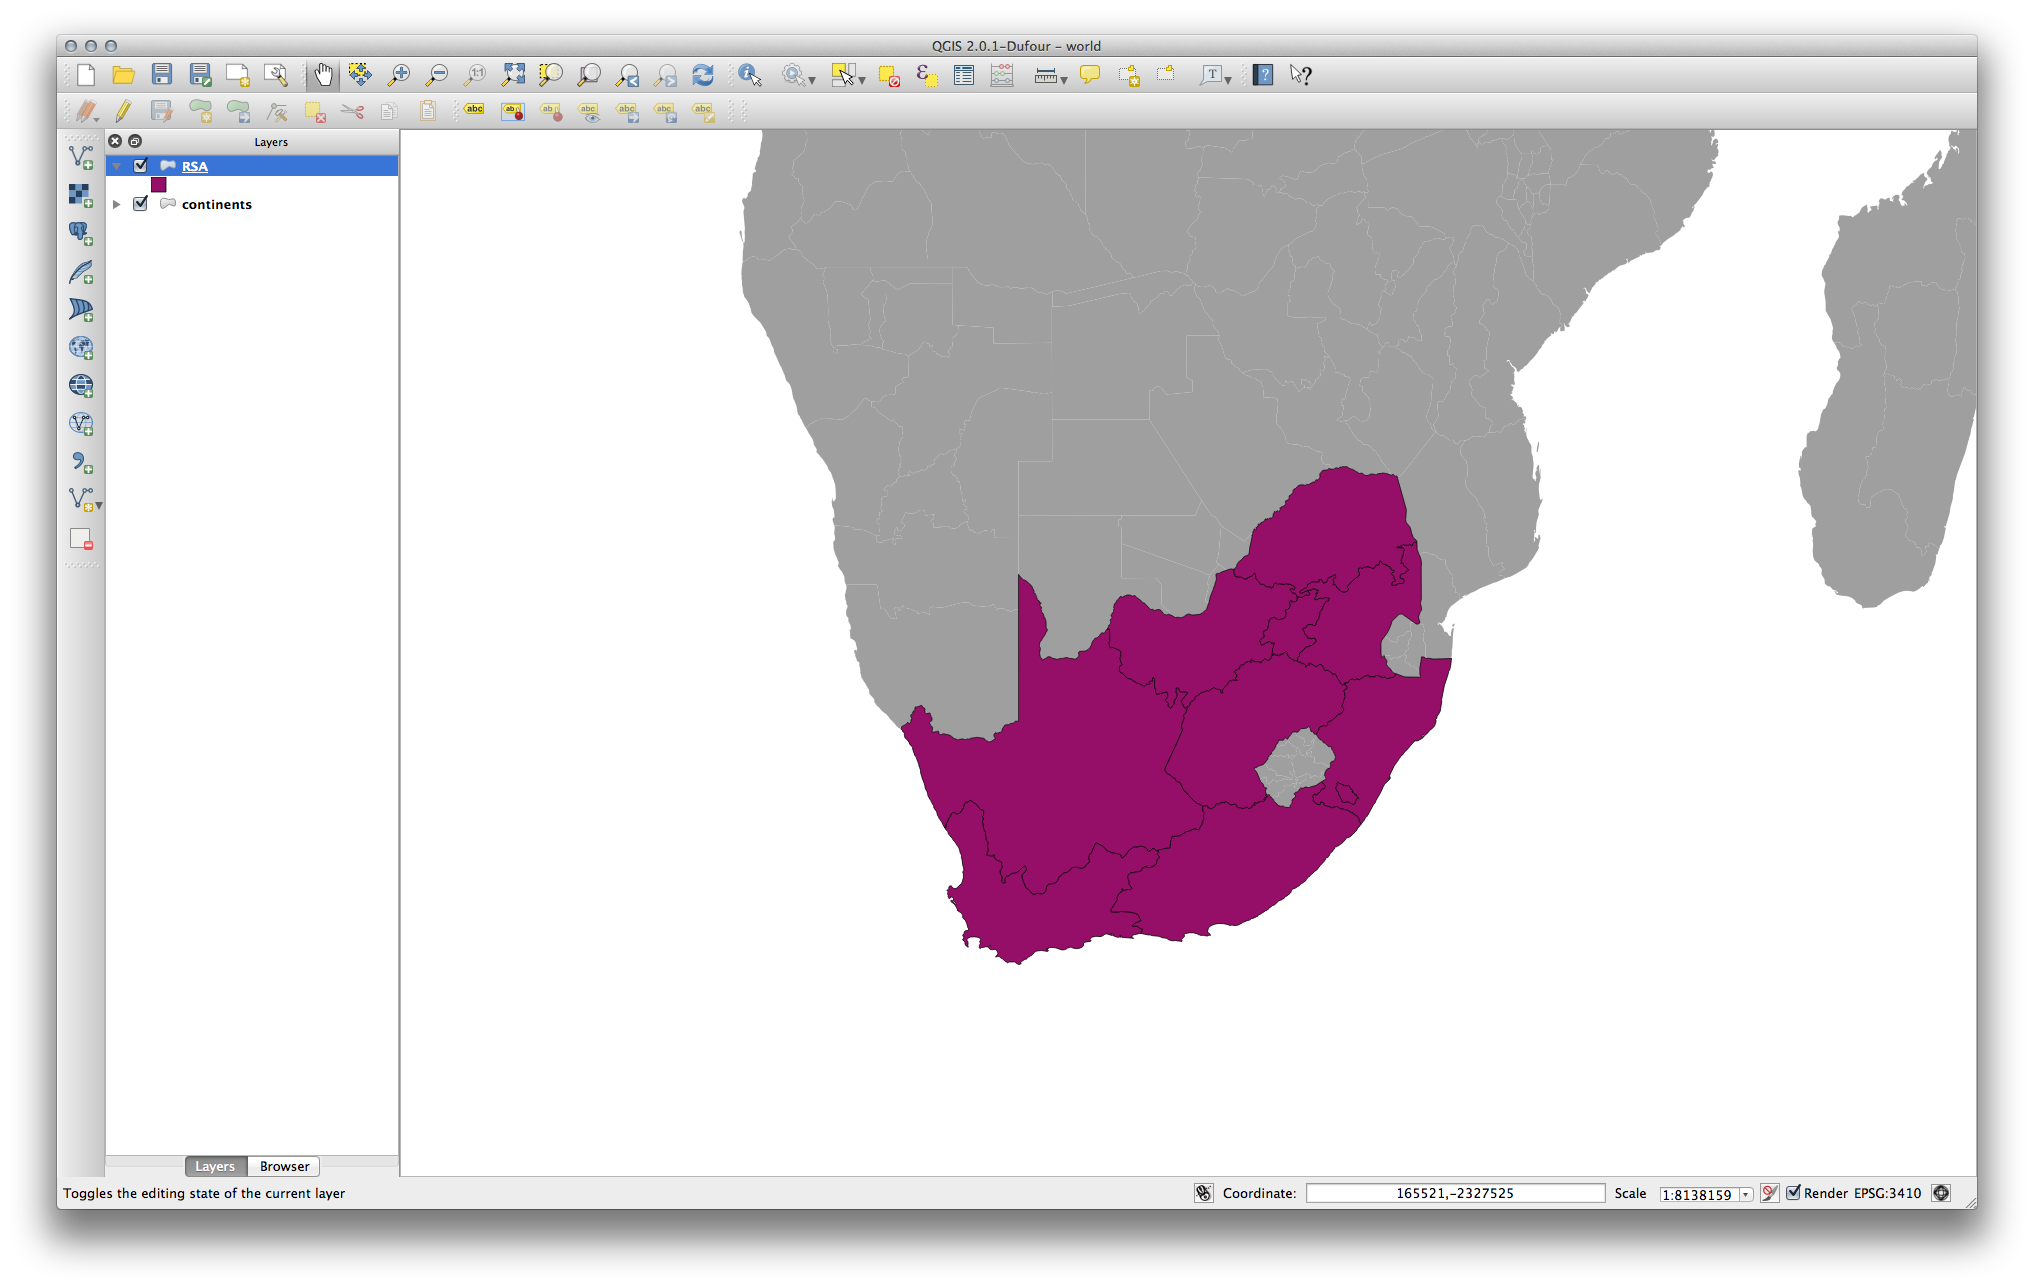
- Add another vector layer to your map which has the data for South Africa only. You’ll find it as exercise_data/world/RSA.shp.
Wat valt u op?
The layer isn’t visible! But that’s easy to fix, right?
- Right-click on the RSA layer in the Layers list.
- Select Zoom to Layer Extent.
OK, so now we see South Africa... but where is the rest of the world?
It turns out that we can zoom between these two layers, but we can’t ever see them at the same time. That’s because their Coordinate Reference Systems are so different. The continents dataset is in degrees, but the RSA dataset is in meters. So, let’s say that a given point in Cape Town in the RSA dataset is about 4 100 000 meters away from the equator. But in the continents dataset, that same point is about 33.9 degrees away from the equator.
This is the same distance - but QGIS doesn’t know that. You haven’t told it to reproject the data. So as far as it’s concerned, the version of South Africa that we see in the RSA dataset has Cape Town at the correct distance of 4 100 000 meters from the equator. But in the continents dataset, Cape Town is only 33.9 meters away from the equator! You can see why this is a problem.
QGIS doesn’t know where Cape Town is supposed to be - that’s what the data should be telling it. If the data tells QGIS that Cape Town is 34 meters away from the equator and that South Africa is only about 12 meters from north to south, then that is what QGIS will draw.
To correct this:
- Click on the CRS Status button again and switch Enable ‘on the fly’ CRS transformation on again as before.
- Zoom to the extents of the RSA dataset.
Now, because they’re made to project in the same CRS, the two datasets fit perfectly:
When combining data from different sources, it’s important to remember that they might not be in the same CRS. “On the fly” reprojection helps you to display them together.
Before you go on, you probably want to have the ‘on the fly’ reprojection to be automatically activated whenever you open datasets having different CRS:
- Open again Settings ‣ Options... and select CRS.
- Activate Automatically enable ‘on the fly’ reprojection if layers have different CRS.
7.1.3.  Follow Along: Een gegevensset opslaan in een anderCRS
Remember when you calculated areas for the buildings in the Classification lesson? You did it so that you could classify the buildings according to area.
- Open your usual map again (containing the Swellendam data).
- Open the attribute table for the buildings layer.
- Scroll to the right until you see the AREA field.
Notice how the areas are all very small; probably zero. This is because these areas are given in degrees - the data isn’t in a Projected Coordinate System. In order to calculate the area for the farms in square meters, the data has to be in square meters as well. So, we’ll need to reproject it.
But it won’t help to just use ‘on the fly’ reprojection. ‘On the fly’ does what it says - it doesn’t change the data, it just reprojects the layers as they appear on the map. To truly reproject the data itself, you need to export it to a new file using a new projection.
- Right-click on the buildings layer in the Layers list.
- Select Save As... in the menu that appears. You will be shown the Save vector layer as... dialog.
- Click on the Browse button next to the Save as field.
- Navigate to exercise_data/ and specify the name of the new layer as buildings_reprojected.shp.
- Leave the Encoding unchanged.
- Change the value of the Layer CRS dropdown to Selected CRS.
- Click the Browse button beneath the dropdown.
- The CRS Selector dialog will now appear.
- In its Filter field, search for 34S.
- Choose WGS 84 / UTM zone 34S from the list.
- Leave the Symbology export unchanged.
The Save vector layer as... dialog now looks like this:
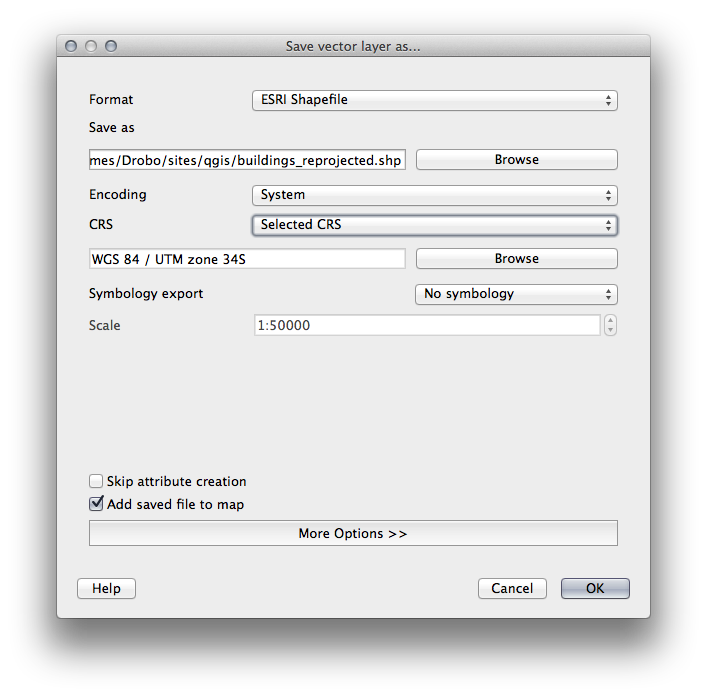
- Click OK.
- Start a new map and load the reprojected layer you just created.
Refer back to the lesson on Classification to remember how you calculated areas.
- Update (or add) the AREA field by running the same expression as before:
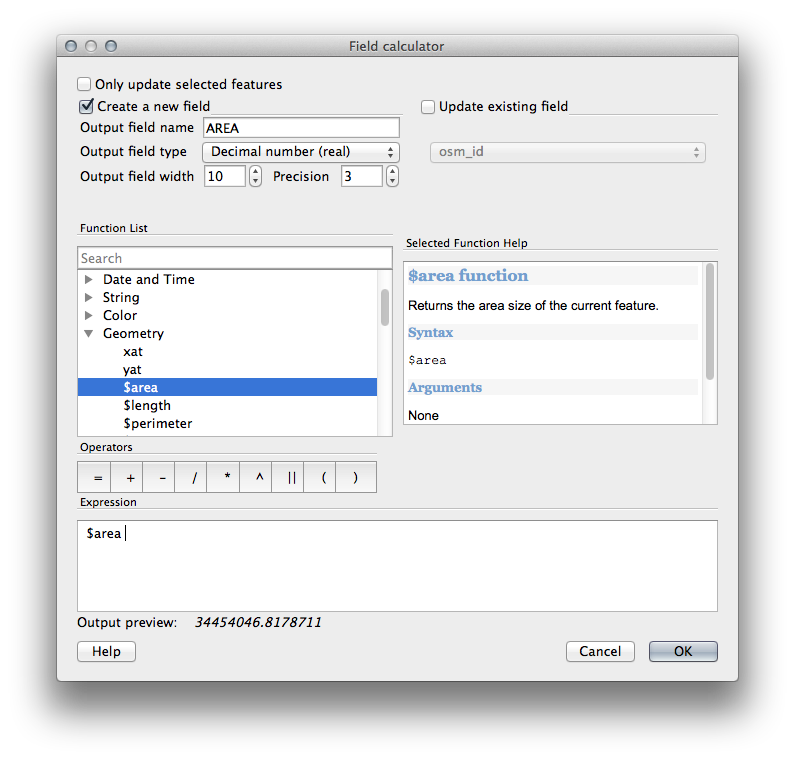
This will add an AREA field with the size of each building in square meters
- To calculate the area in another unit of measurement, for example hectares, use the AREA field to create a second column:
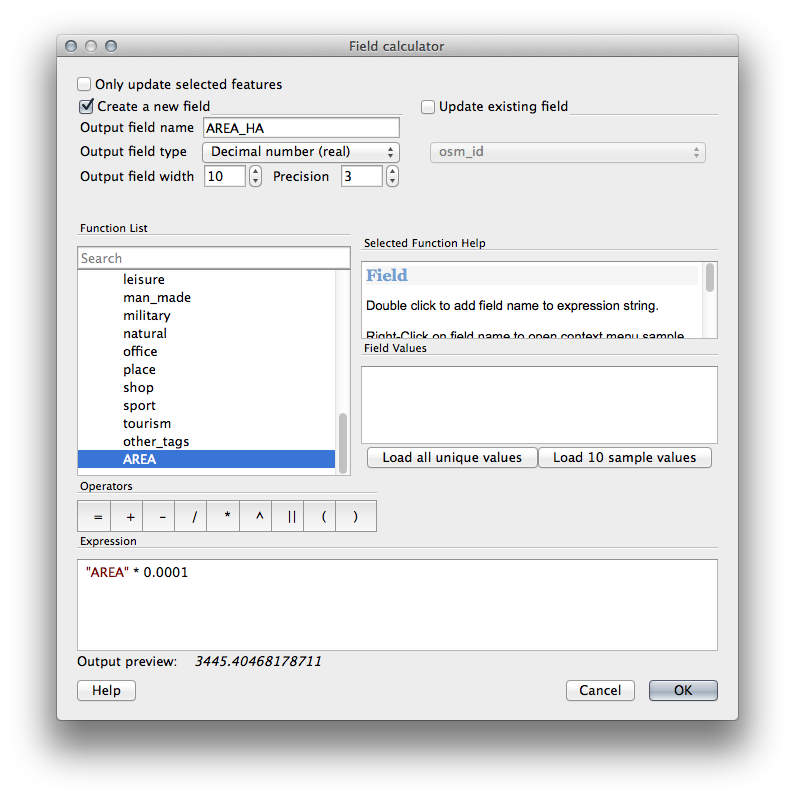
Look at the new values in your attribute table. This is much more useful, as people actually quote building size in meters, not in degrees. This is why it’s a good idea to reproject your data, if necessary, before calculating areas, distances, and other values that are dependent on the spatial properties of the layer.
7.1.4.  Follow Along: Uw eigen projectie maken
Er zijn nog veel meer projecties dan die welke standaard zijn opgenomen in QGIS. U kunt ook uw eigen projecties maken.
- Start a new map.
- Load the world/oceans.shp dataset.
- Go to Settings ‣ Custom CRS... and you’ll see this dialog:
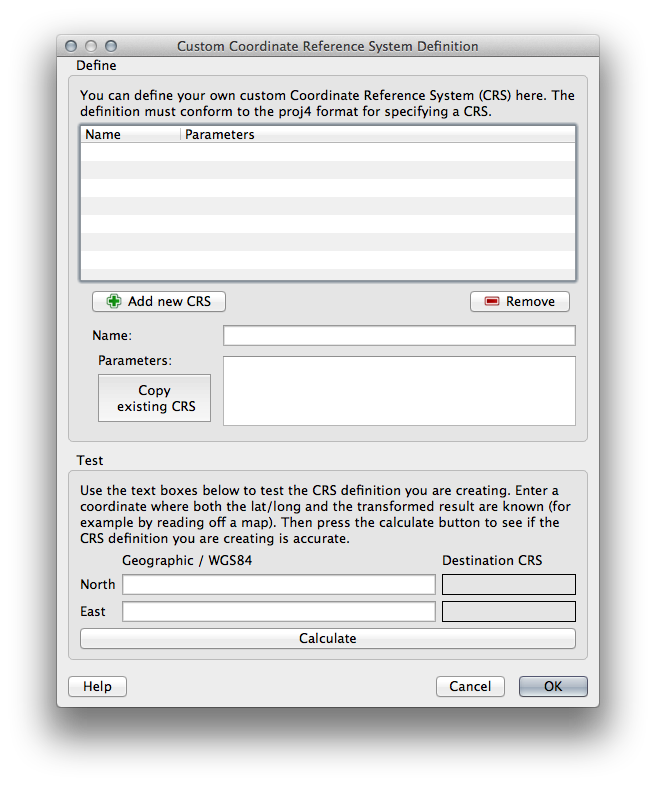
- Click on the Add new CRS button to create a new projection.
An interesting projection to use is called Van der Grinten I.
- Enter its name in the Name field.
Deze projectie geeft de Aarde weer op een cirkelvormig veld in plaats van op een rechthoekig, zoals de meeste andere projecties doen.
- For its parameters, use the following string:
+proj=vandg +lon_0=0 +x_0=0 +y_0=0 +R_A +a=6371000 +b=6371000 +units=m +no_defs
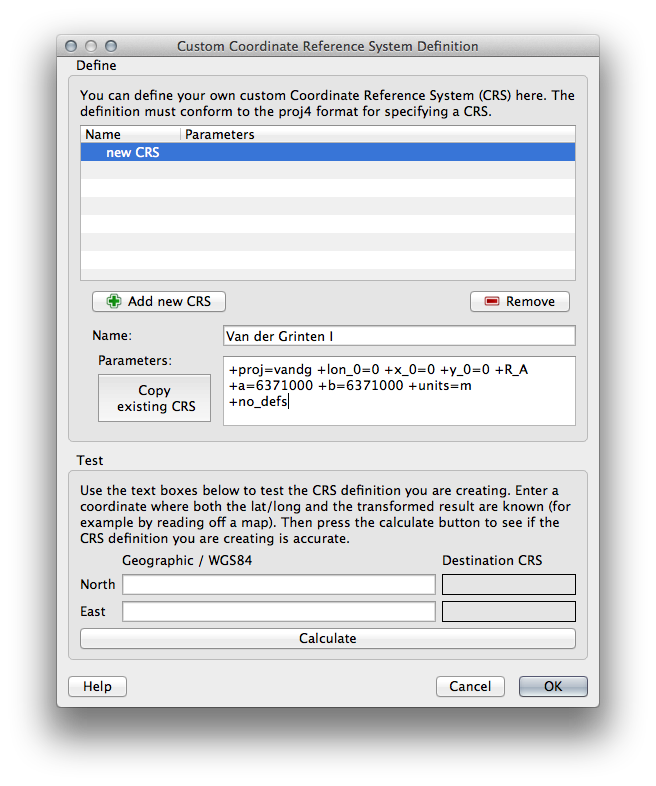
- Click OK.
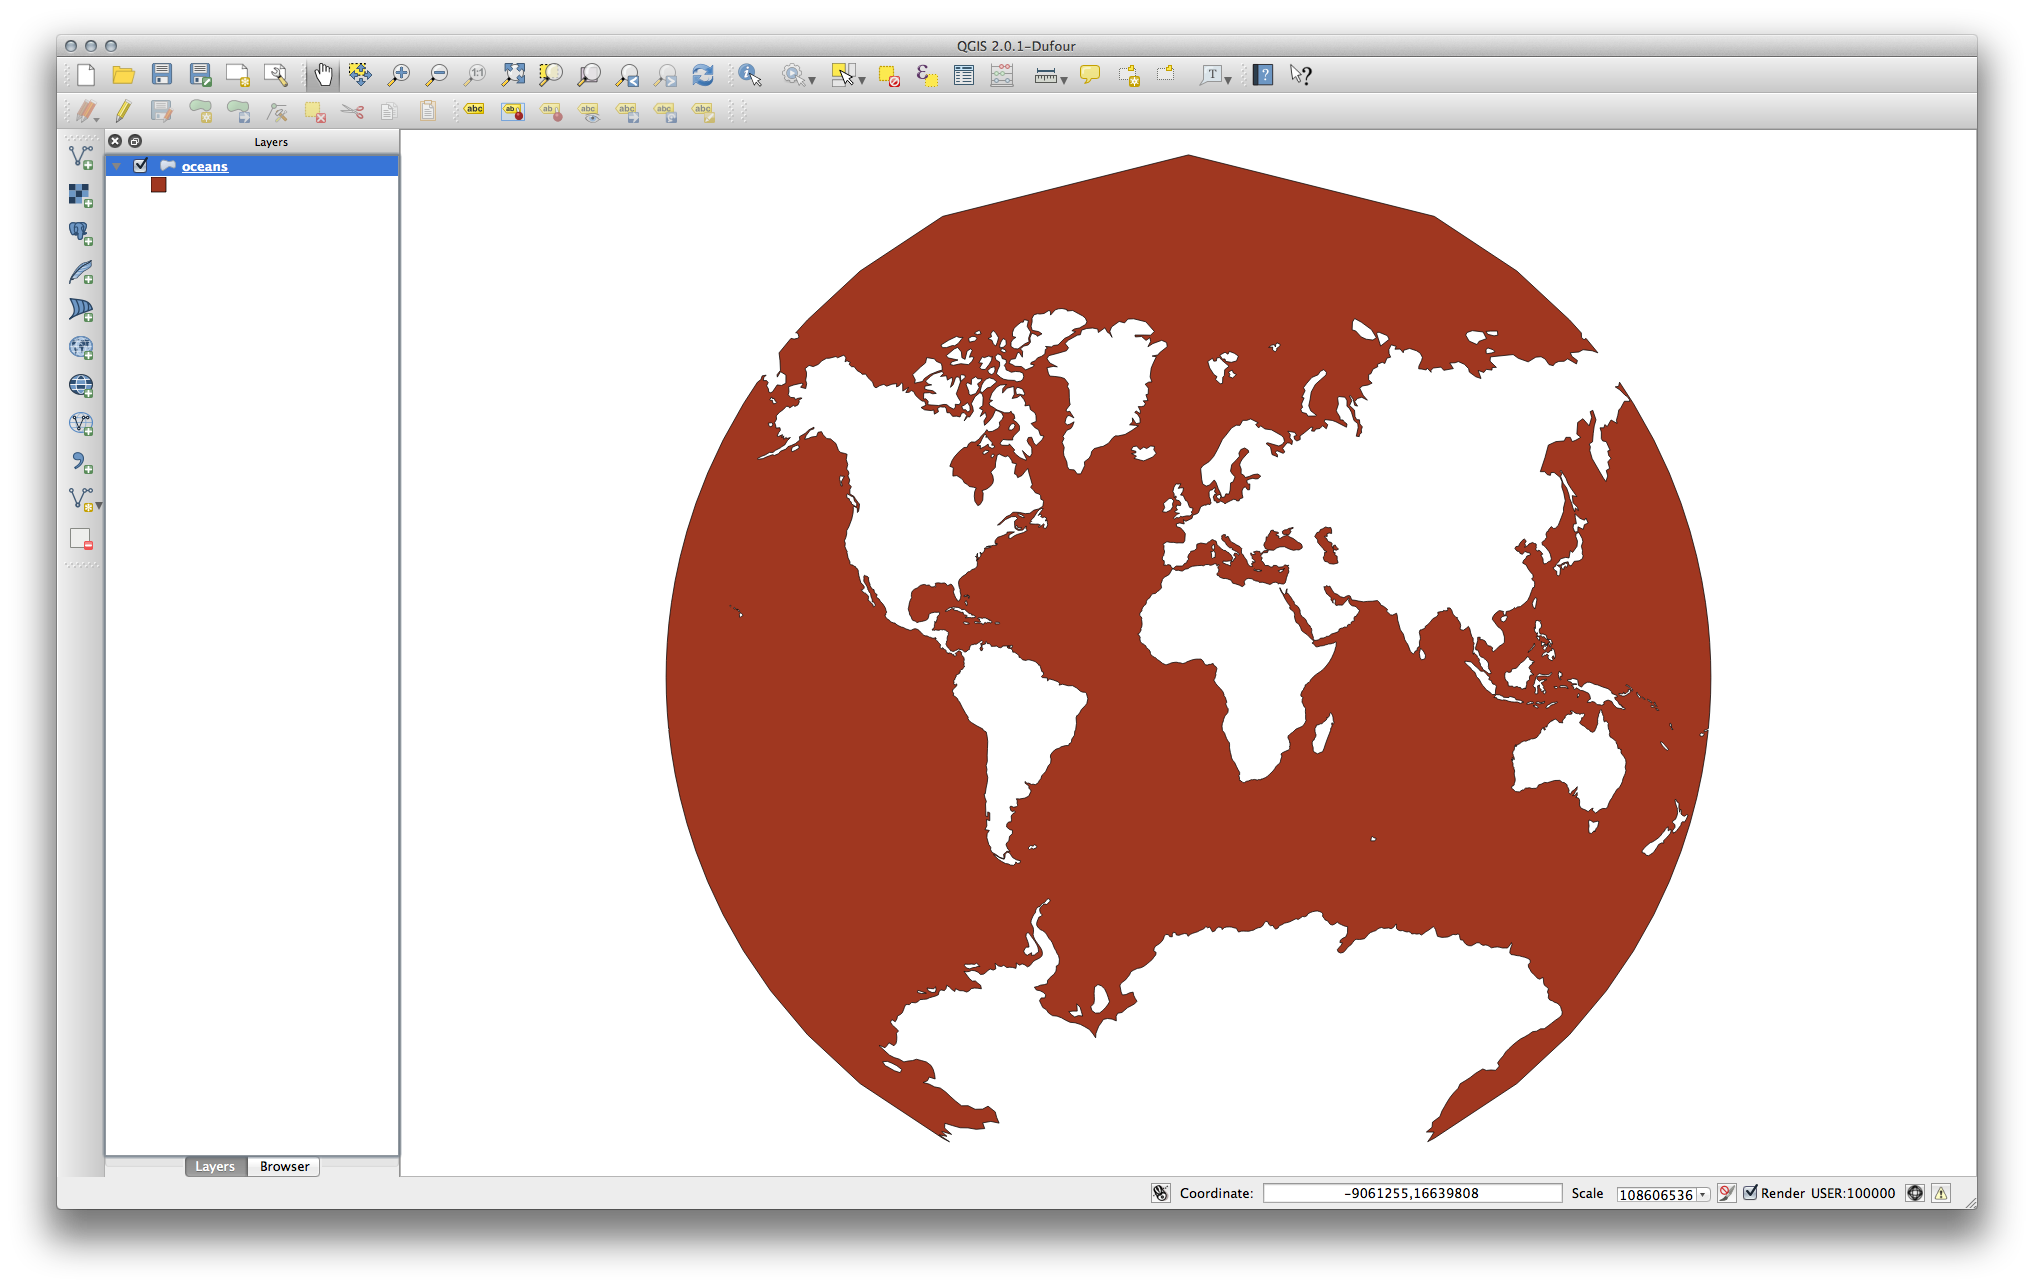
- Enable “on the fly” reprojection.
- Choose your newly defined projection (search for its name in the Filter field).
Bij het toepassen van deze projectie, zal de kaart opnieuw geprojecteerd worden als:
7.1.5. In Conclusion
Verschillende projecties zijn handige voor verschillende doeleinden. Door de juiste projectie te kiezen kunt u er voor zorgen dat de objecten op uw kaart nauwkeurig worden weergegeven.
7.1.6. Further Reading
Materials for the Advanced section of this lesson were taken from this article.
Further information on Coordinate Reference Systems is available here.
7.1.7. What’s Next?
In de volgende les zult u leren hoe u vectorgegevens kunt analyseren met behulp van de verschillende gereedschappen voor vectoranalyse in QGIS.