3.1. Lesson: Werken met vectorgegevens
Vector data is arguably the most common kind of data you will find in the daily use of GIS. It describes geographic data in terms of points, that may be connected into lines and polygons. Every object in a vector dataset is called a feature, and is associated with data that describes that feature.
Het doel voor deze les: De structuur van vectorgegevens te leren en hoe vector-gegevenssets in een kaart moeten worden geladen.
3.1.1.  Follow Along: Laagattributen bekijken
Het is belangrijk te weten dat de gegevens waarmee u gaat werken niet alleen weergeven waar objecten in de ruimte staan, maar ook dat ze u vertellen wat die objecten zijn.
From the previous exercise, you should have the roads layer loaded in your map. What you can see right now is merely the position of the roads.
To see all the data available to you, with the roads layer selected in the Layers panel:
- Click on this button:

It will show you a table with more data about the roads layer. This extra data is called attribute data. The lines that you can see on your map represent where the roads go; this is the spatial data.
Deze definities worden veel gebruikt in GIS, het is dus essentieel om ze te onthouden!
U mag nu de attributentabel sluiten.
Vector data represents features in terms of points, lines and polygons on a coordinate plane. It is usually used to store discrete features, like roads and city blocks.
3.1.2. Follow Along: Loading Vector Data From Shapefiles
The Shapefile is a specific file format that allows you to store GIS data in an associated group of files. Each layer consists of several files with the same name, but different file types. Shapefiles are easy to send back and forth, and most GIS software can read them.
Refer back to the introductory exercise in the previous section for instructions on how to add vector layers.
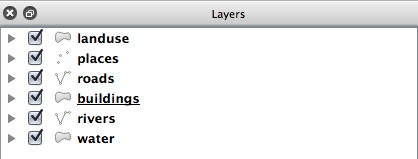
Load the data sets from the epsg4326 folder into your map following the same method:
- “places”
- “water”
- “rivers”
- “buildings”
3.1.3. Follow Along: Loading Vector Data From a Database
Databases allow you to store a large volume of associated data in one file. You may already be familiar with a database management system (DBMS) such as Microsoft Access. GIS applications can also make use of databases. GIS-specific DBMSes (such as PostGIS) have extra functions, because they need to handle spatial data.
- Click on this icon:

(If you’re sure you can’t see it at all, check that the Manage Layers toolbar is enabled.)
It will give you a new dialog. In this dialog:
- Click the New button.
- In the same epsg4326 folder, you should find the file landuse.sqlite. Select it and click Open.
You will now see the first dialog again. Notice that the dropdown select above the three buttons now reads “landuse.sqlite@...”, followed by the path of the database file on your computer.
- Click the Connect button. You should see this in the previously empty box:
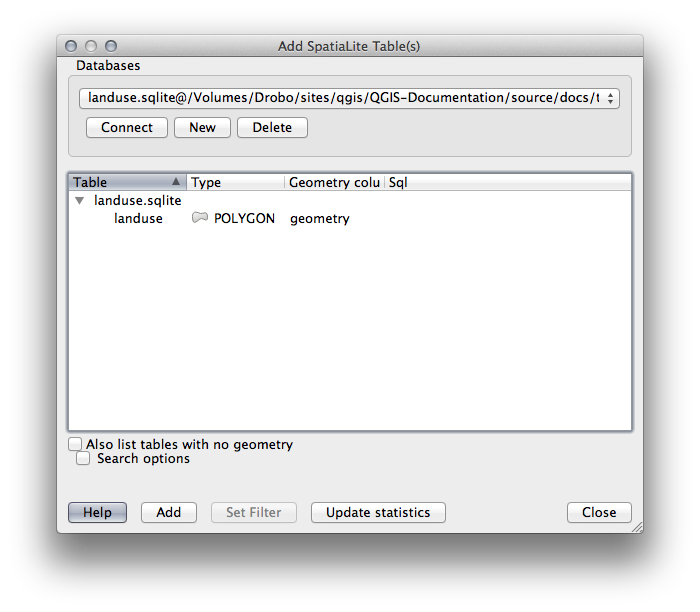
- Click on the landuse layer to select it, then click Add
Notitie
Remember to save the map often! The map file doesn’t contain any of the data directly, but it remembers which layers you loaded into your map.
3.1.4. Follow Along: De lagen opnieuw schikken
De lagen in uw lijst Lagen worden in een bepaalde volgorde op de kaart getekend. De laag onder in de lijst wordt als eerste getekend en de laan aan de bovenkant wordt als laatste getekend. Door de volgorde waarin zij in de lijst zijn weergegeven te wijzigen, kunt u de volgorde wijzigen waarin zij getekend worden.
Notitie
Depending on the version of QGIS that you are using, you may have a checkbox beneath your Layers list reading Control rendering order. This must be checked (switched on) so that moving the layers up and down in the Layers list will bring them to the front or send them to the back in the map. If your version of QGIS doesn’t have this option, then it is switched on by default and you don’t need to worry about it.
De volgorde waarin de lagen zijn geladen in de kaart is in dit stadium waarschijnlijk niet logisch. Het is mogelijk dat de laag met wegen volledig is verborgen omdat andere lagen er bovenop liggen.
Deze volgorde van lagen bijvoorbeeld...
... zou resulteren in verborgen wegen en plaatsen omdat zij onder stedelijke gebieden liggen.
Dit probleem oplossen:
Klik en sleep een laag uit de lijst met Lagen.
Schik ze opnieuw naar deze volgorde:
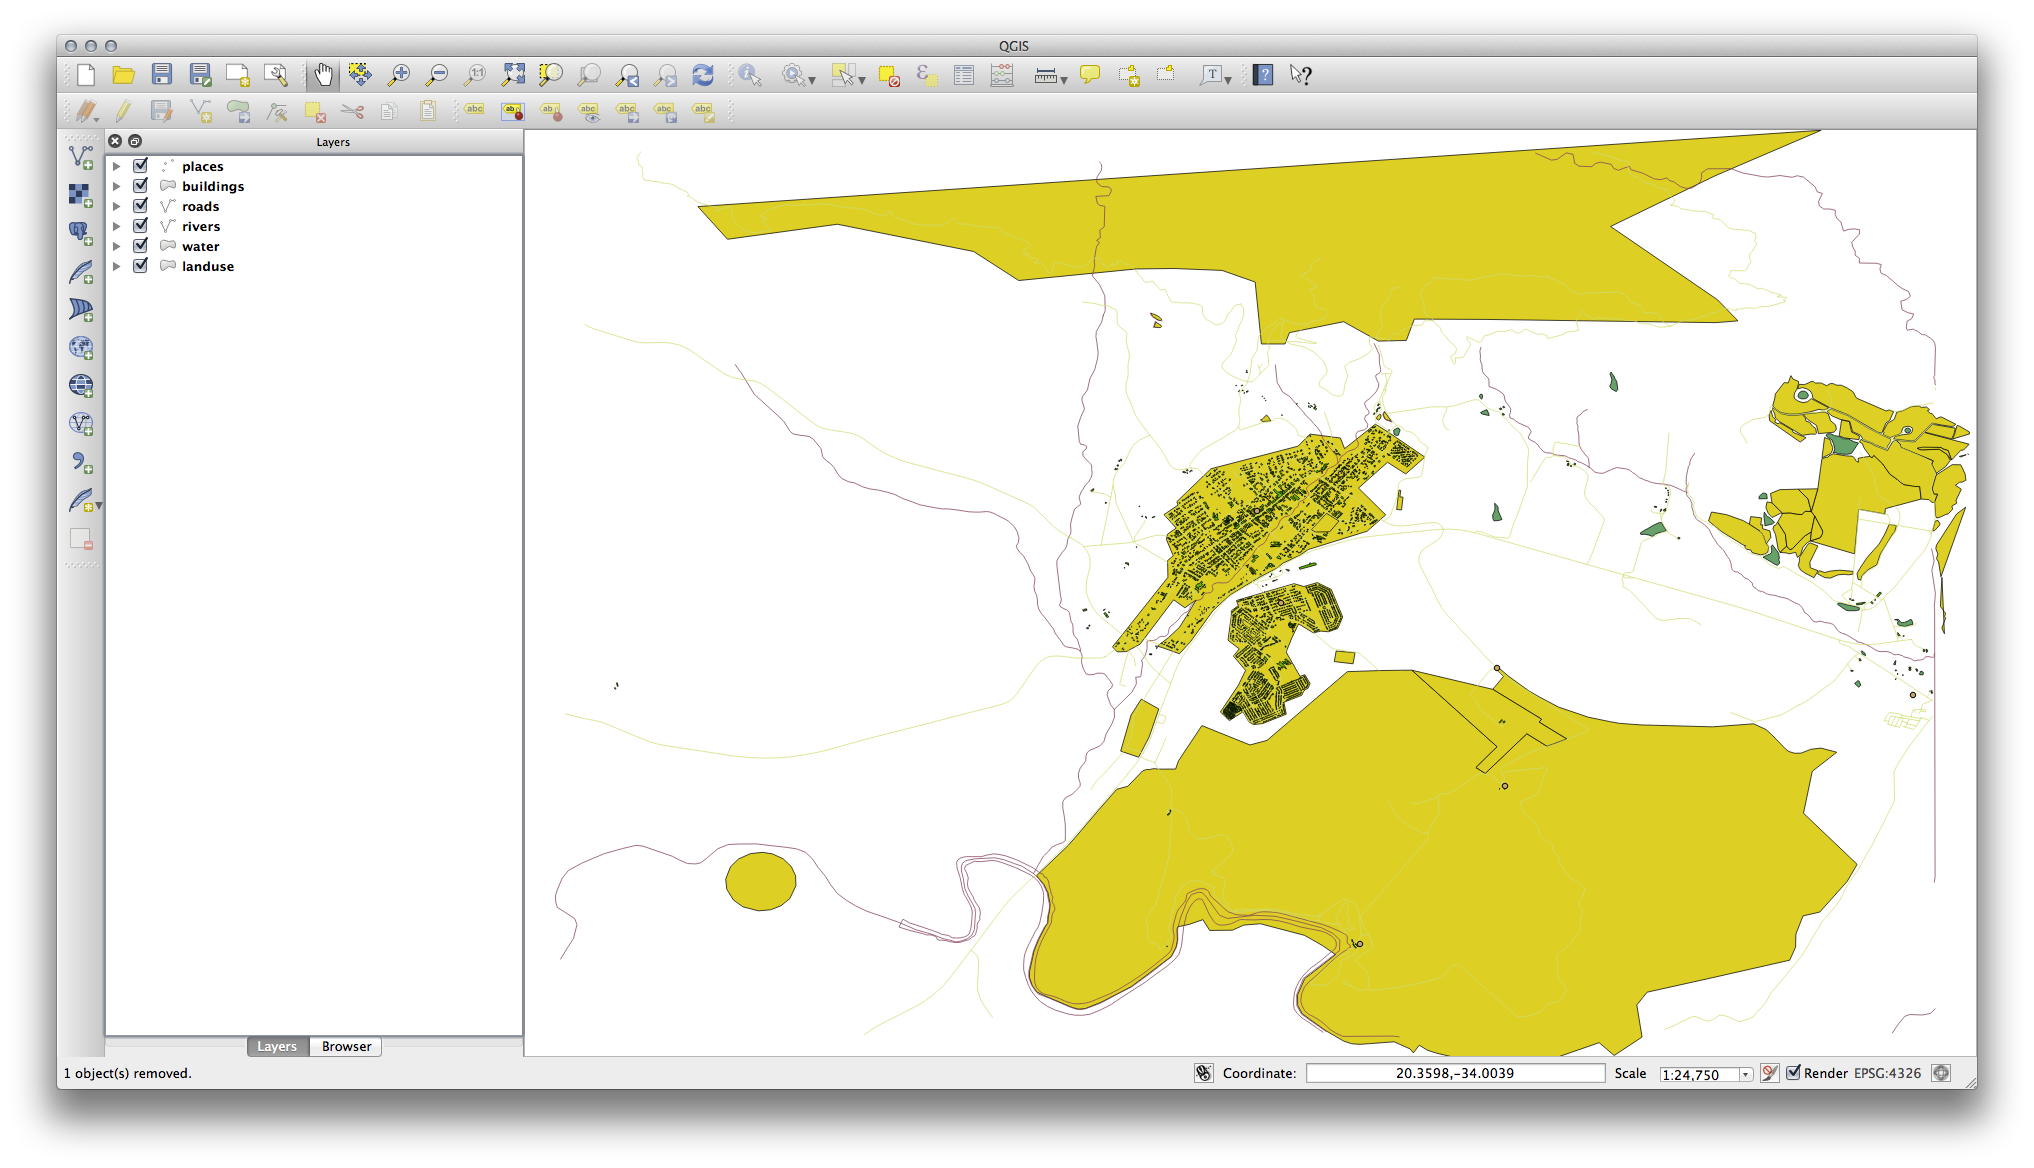
U zult zien dat de kaart visueel nu meer betekenis heeft, met wegen en gebouwen die bovenop de regio’s van landuse verschijnen.
3.1.5. In Conclusion
Nu heeft u alle lagen toegevoegd die u nodig heeft uit verschillende bronnen.
3.1.6. What’s Next?
Door het automatisch toegewezen willekeurige palet bij het laden van de lagen is uw huidige kaart waarschijnlijk niet eenvoudig te lezen. Het verdient aanbeveling om uw eigen keuzes aan kleuren en symbolen toe te voegen. Dat is wat u zult leren te doen in de volgende les.