18.33. Utilizzare gli script R in Processing
Module contributed by Matteo Ghetta - funded by Scuola Superiore Sant’Anna
Processing allows to write and run R scripts inside QGIS.
Avvertimento
R deve essere installato sul tuo computer e PATH deve essere configurato correttamente. Inoltre processing chiama i pacchetti R esterni, ma non è in grado di installarli. Quindi assicurati di installare i pacchetti esterni direttamente in R. Vedi il relativo capitolo nel manuale dell’utente.
Nota
Se hai qualche problema con i pacchetti, forse è legato ai pacchetti obbligatori mancanti richiesti da Processing, come sp, rgdal e raster.
18.33.1. Aggiuni script
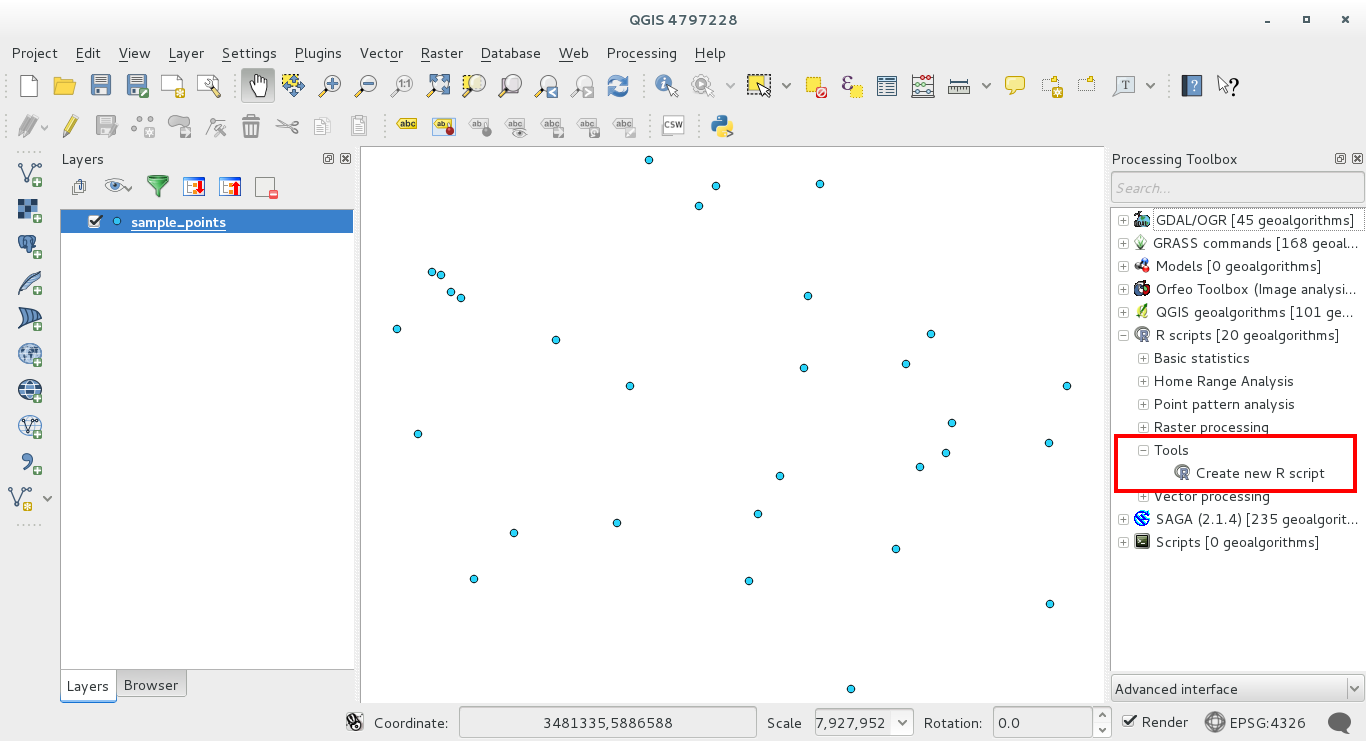
L’aggiunta di uno script è molto semplice. Apri gli Strumenti di Processing e e clicca su R -> Strumenti -> Crea nuovo script R.
Nota
Se non riesci a vedere R in Processing, devi attivarlo in :menuelezione:`Elaborazione -> Opzioni -> Providers`
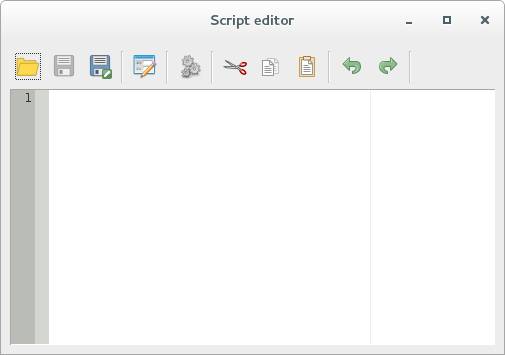
Apre una finestra dell’editor di script in cui in cui devi specificare alcuni parametri prima di poter aggiungere il corpo dello script.
18.33.2. Creating plots
In this tutorial we are going to create a boxplot of a vector layer field.
Open the r_intro.qgs QGIS project under the exercise_data/processing/r_intro/ folder.
18.33.2.1. Script parameters
Open the editor and start writing at the beginning of it.
You must specify some parameters before the script body:
the name of the group in which you want to put your script:
##plots=groupso you will find your script in the plots group in the Processing toolbox.
you have to tell Processing that you want to display a plot (just in this example):
##showplotsthis way in the Result Viewer of Processing you’ll see the plot.
You need also to tell Processing with which kind of data you are working with. In this example we want to create a plot from a field of a vector layer:
##Layer=vectorProcessing knows now that the input is a vector. The name Layer is not important, what matters is the vector parameter.
Finally, you have to specify the input field of the vector layer you want to plot:
##X=Field LayerSo Processing knows that you have called X the Field Layer.
18.33.2.2. Script body
Now that you have set up the heading of the script you can add the function:
boxplot(Layer[[X]])
Notice that boxplot is the name of the R function itself that calls Layer as dataset and X as the field of the dataset.
Avvertimento
The parameter X is within a double square bracket [[]]
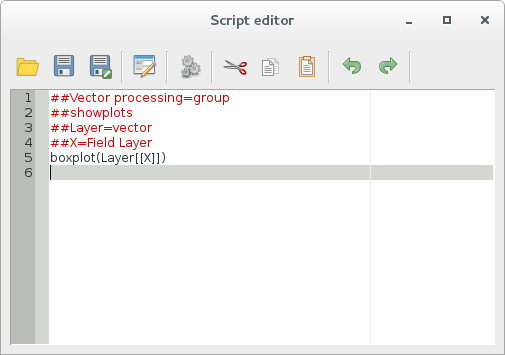
The final script looks like this:
##Vector processing=group
##showplots
##Layer=vector
##X=Field Layer
boxplot(Layer[[X]])
Save the script in the default path suggested by Processing. The name you choose will be the same as the name of the script you’ll find in the Processing toolbox.
Nota
You can save the script in other paths, but Processing isn’t able to upload them automatically and you have to upload all the scripts manually
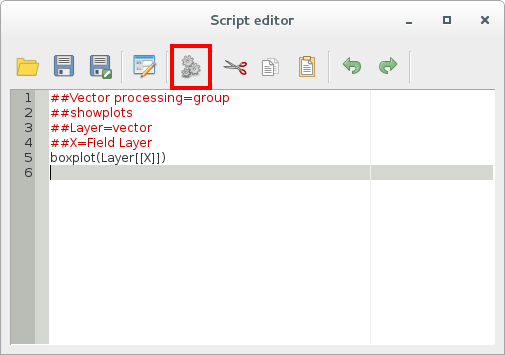
Now just run it using the button on the top of the editor window:
Otherwise, once the editor window has been closed, use the text box of Processing to find your script:
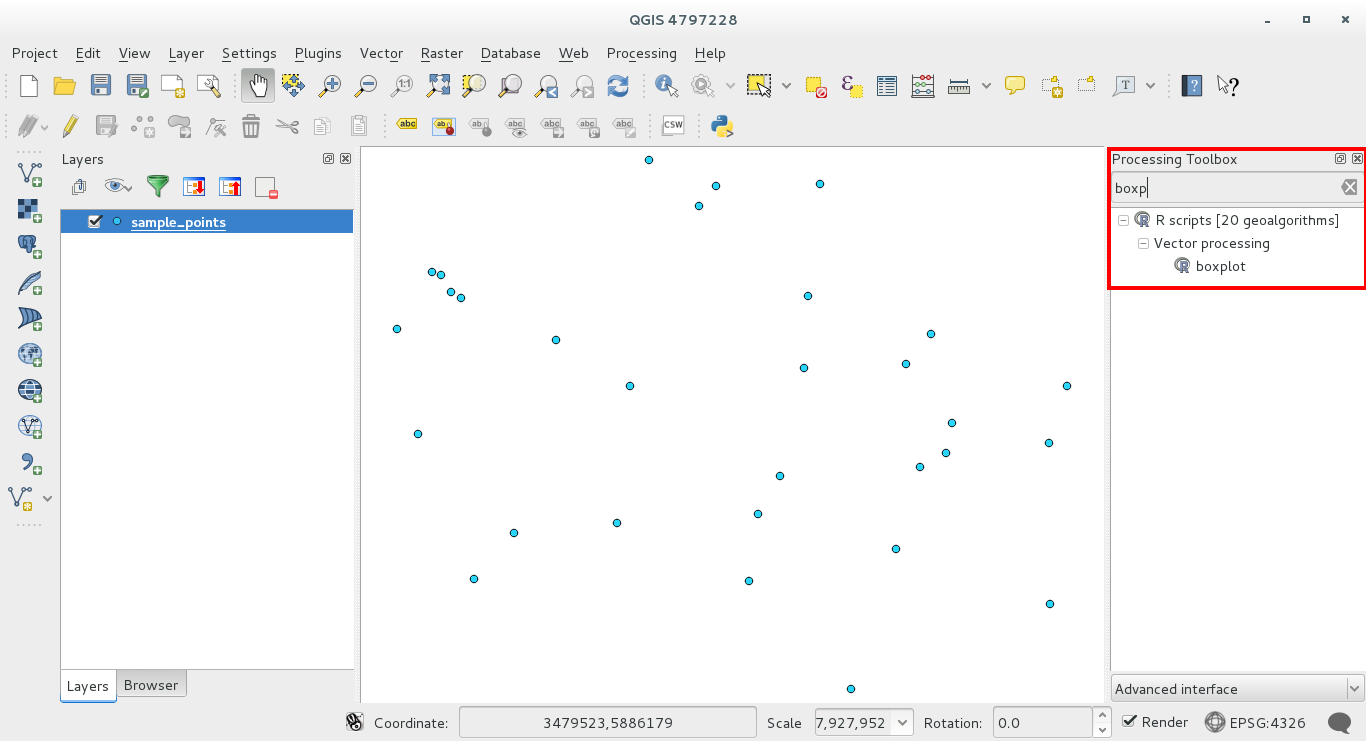
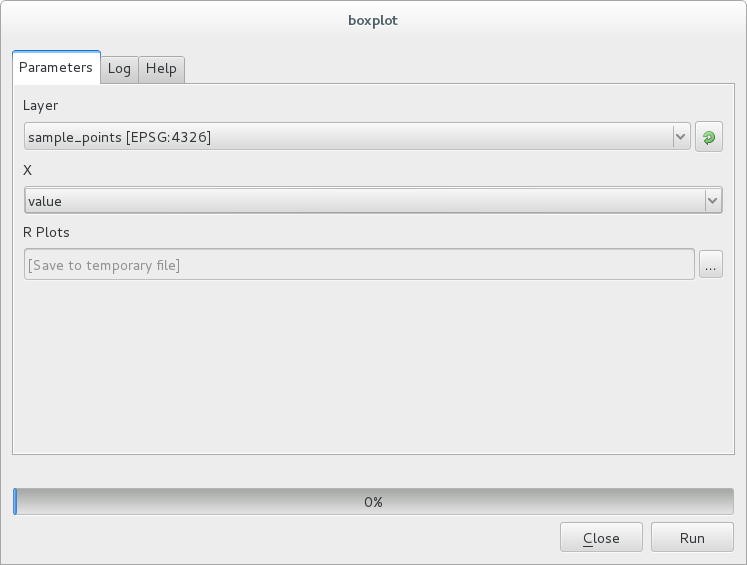
You are now able to fill the parameters required in the Processing algorithm window:
- as Layer choose the sample points one
- fill the X field with the value parameter
Click on Run.
The Result window should be automatically opened, if not, just click on Processing ‣ Result Viewer....
This is the final result you’ll see:
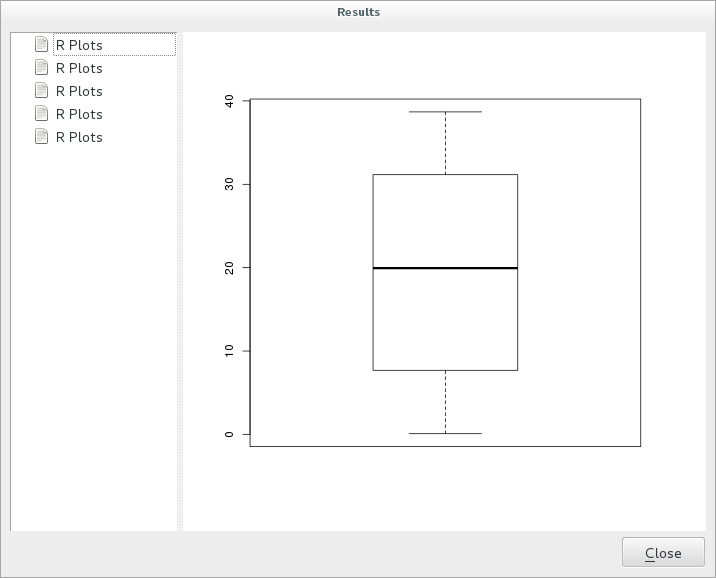
Nota
You can open, copy and save the image by right clicking on the plot
18.33.3. Create a vector
With an R script you can also create a vector and automatically load it in QGIS.
The following example has been taken from the Random sampling grid script that you can download from the online collection R ‣ Tools ‣ Download R scripts from the on-line collection.
The aim of this exercise is to create a random point vector in a layer extent using the spsample function of the sp package.
18.33.3.1. Script parameters
As before we have to set some parameters before the script body:
specify the name of the group in which you want to put your script, for example Point pattern analysis:
##Point pattern analysis=groupset the layer that will contain the random points:
##Layer=vectorset the number of points that are going to be created:
##Size=number 10Nota
10 is going to be the default value. You can change this number or you can leave the parameter without a default number
specify that the output is a vector layer:
##Output= output vector
18.33.3.2. Script body
Now you can add the body of the function:
run the spsample function:
pts=spsample(Layer,Size,type="random")
this way the function takes the extent of the Layer, the number of points is taken from the Size parameter and the point generation is random
Write the line that contains the parameters of the output:
Output=SpatialPointsDataFrame(pts, as.data.frame(pts))
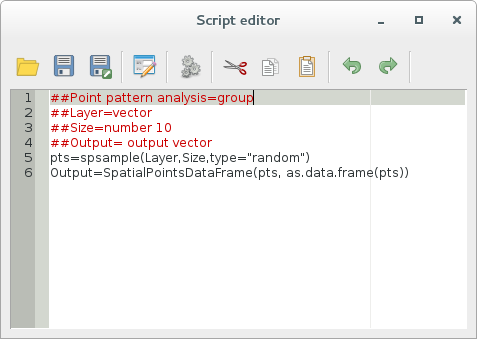
The final script looks like this:
##Point pattern analysis=group
##Layer=vector
##Size=number 10
##Output= output vector
pts=spsample(Layer,Size,type="random")
Output=SpatialPointsDataFrame(pts, as.data.frame(pts))
Save it and run it, clicking on the running button.
In the new window type in the right parameters:
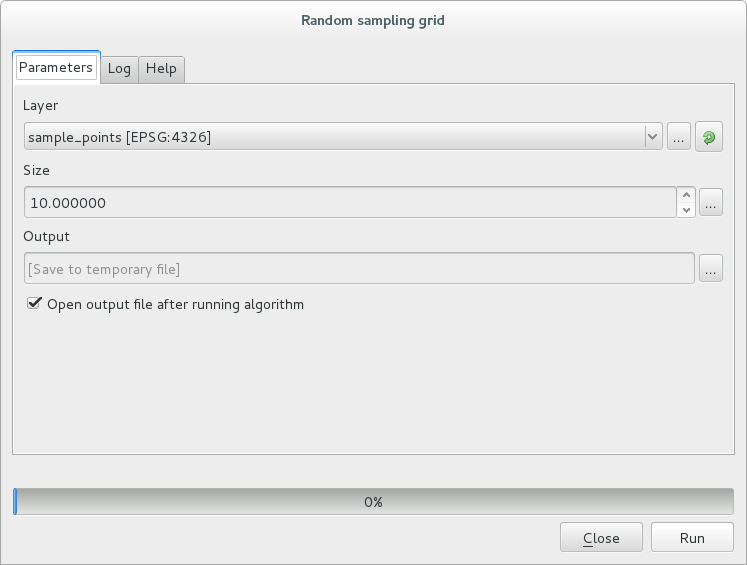
and click on run.
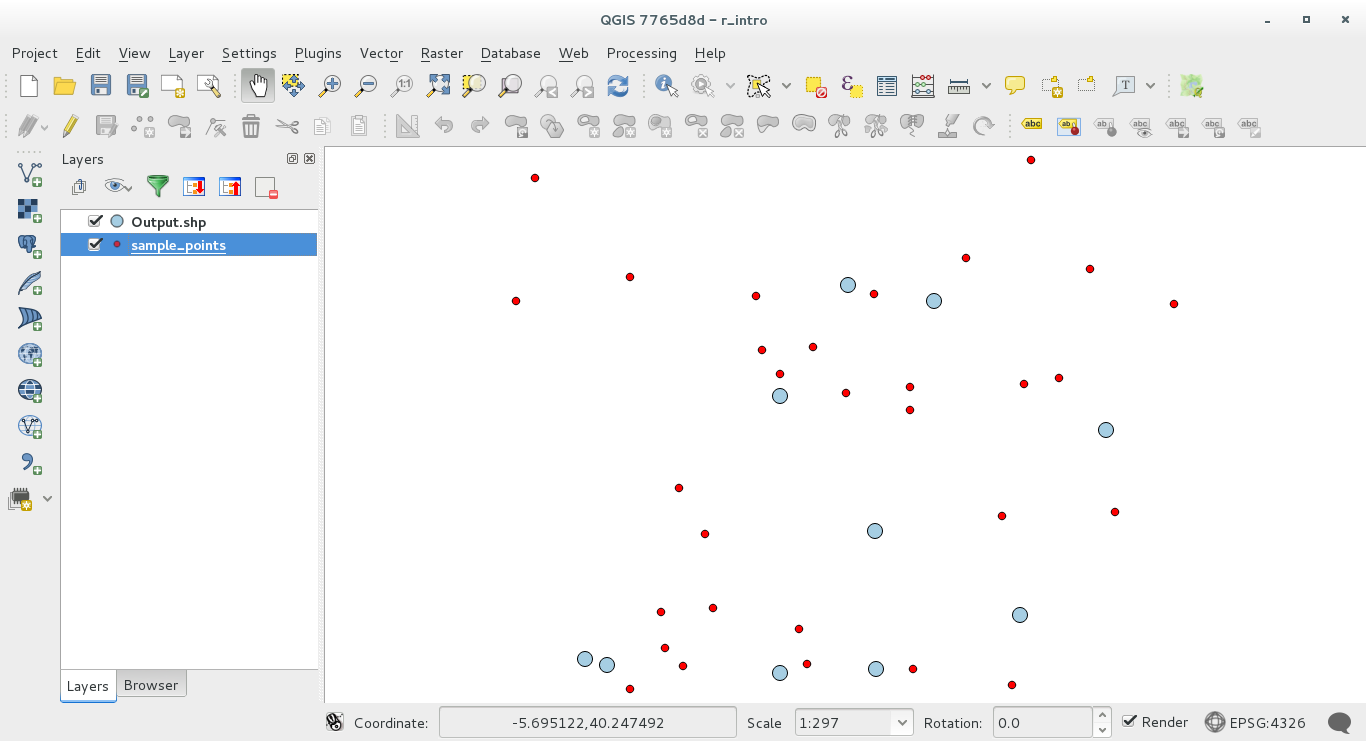
Resulting points will be displayed in the map canvas
18.33.4. R - Processing syntax
Beware that Processing uses some special syntax to get the results out of R:
- > before your command, as in >lillie.test(Layer[[Field]]) means the result should be sent to R output (Result viewer)
- + after a plot to call overlay plots. For example plot(Layer[[X]], Layer[[Y]]) + abline(h=mean(Layer[[X]]))