1.2. Preparazione dei dati dell’esercizio
The sample data provided with the Training Manual refers to the town of Swellendam and its surroundings. Swellendam is located about 2 hours’ east of Cape Town in the Western Cape of South Africa. The dataset contains feature names in both English and Afrikaans.
Chiunque può usare questo dataset senza difficoltà, ma potresti preferire usare dati del tuo paese o della tua città. Se tu scegli di fare così, i tuoi dati georeferenziati verranno usati in tutte le lezioni dal Modulo 3 al Modulo 7.2. In seguito o moduli usano sorgenti di dati più complessi che potrebbero essere o non essere disponibili per la tua regione.
Nota
Questo processo è inteso per organizzatori di corsi o per utenti QGIS con maggiore esperienza, i quali desiderano creare campio di dati georeferenziati per i loro corsi. I dataset predefiniti sono forniti con il Manuale di Formazione, ma puoi seguire queste istruzioni se desideri sostituire i dataset predefiniti.
Nota
The sample data used throughout the manual can be downloaded here: https://github.com/qgis/QGIS-Training-Data/archive/QGIS-Training-Data-v1.0.zip. You can save the files in a folder named exercise_data.
1.2.1.  Try Yourself
Nota
Queste istruzioni presuppongono che tu abbia una buona conoscenza di QGIS e non sono finalizzate ad essere usate come materiale di insegnamento.
Se desideri sostituire i dati predefiniti con i dati georeferenziati del tuo corso, questo può essere facilmente fatto con gli strumenti costruiti in QGIS. La regione che tu scegli di usare dovrebbe avere un buon insieme di aree rurali ed urbane, contenere strade di livello diverso, aree con confini (quali riserve naturali o fattorie) e superfici con acqua, quali corsi d’acqua e fiumi.
Apri un nuovo progetto QGIS
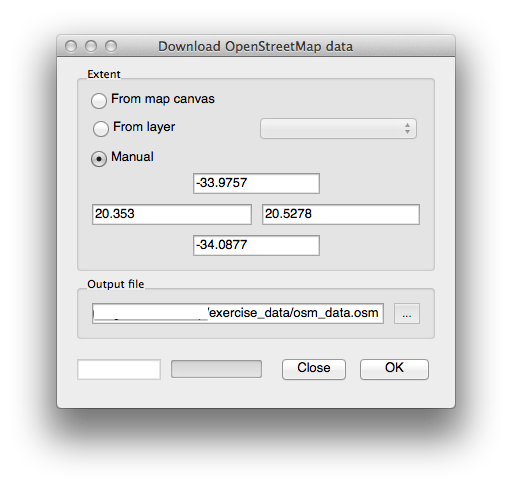
- In the Vector menu dropdown, select OpenStreetMap ‣ Download Data. You can then manually enter the co-ordinates of the region you wish to use, or you can use an existing layer to set the co-ordinates.
- Choose a location to save the resulting .osm file and click Ok:
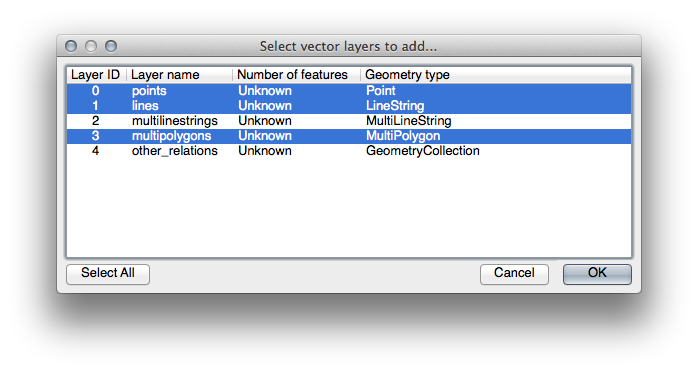
- You can then open the .osm file using the Add Vector Layer button. You may need to select All files in the browser window. Alternatively, you can drag and drop the file into the QGIS window.
- In the dialog which opens, select all the layers, except the other_relations and multilinestrings layer:
This will load three layers into your map which relate to OSM’s naming
conventions (you may need to  Zoom Full to see the
vector data).
Zoom Full to see the
vector data).
We need to extract the useful data from these layers, rename them and create corresponding shape files:
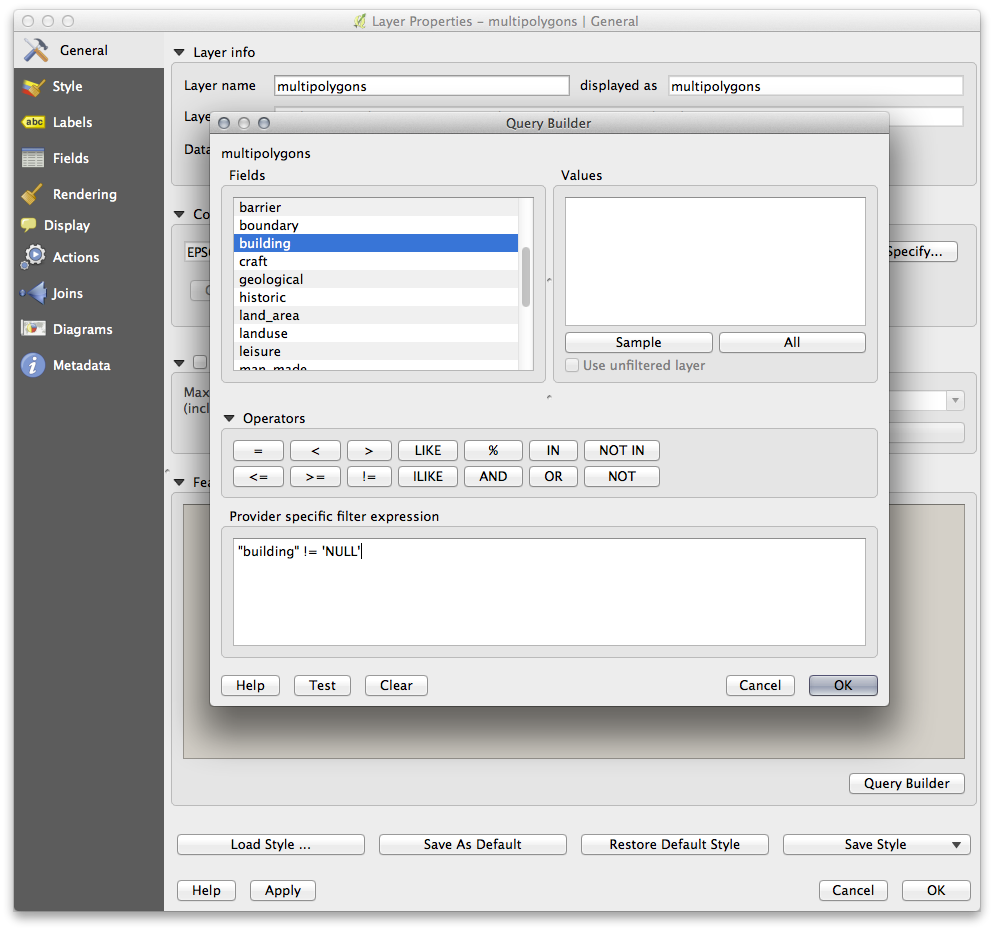
- First, double-click the multipolygons layer to open the Layer properties dialog.
- In the General tab, click Query Builder to open the Query builder window.
This layer contains three fields whose data we will need to extract for use throughout the Training Manual:
- building
- natural (specifically, water)
- landuse
You can sample the data your region contains in order to see what kind of results your region will yield. If you find that “landuse” returns no results, then feel free to exclude it.
You’ll need to write filter expressions for each field to extract the data we need. We’ll use the “building” field as an example here:
- Enter the following expression into the text area: building != "NULL" and click Test to see how many results the query will return. If the number of results is small, you may wish to have a look at the layer’s Attribute Table to see what data OSM has returned for your region:
- Click Ok and you’ll see that the layer elements which are not buildings have been removed from the map.
We now need to save the resulting data as a shapefile for you to use during your course:
- Right-click the multipolygons layer and select Save As...
- Make sure the file type is ESRI Shapefile and save the file in your new exercise_data directory, under a directory called “epsg4326”.
- Make sure No Symbology is selected (we’ll add symbology as part of the course later on).
- You can also select Add saved file to map.
Once the buildings layer has been added to the map, you can repeat the process for the natural and landuse fields using the following expressions:
Nota
Make sure you clear the previous filter (via the Layer properties dialog) from the multipolygons layer before proceeding with the next filter expression!
- natural: “natural = ‘water’”
- landuse: “landuse != ‘NULL’”
Each resulting data set should be saved in the “epsg4326” directory in your new exercise_data directory (i.e. “water”, “landuse”).
You should then extract and save the following fields from the lines and points layers to their corresponding directories:
- lines: “highway != ‘NULL’” to roads, and “waterway != ‘NULL’” to rivers
- points: “place != ‘NULL’” to places
Once you have finished extracting the above data, you can remove the multipolygons, lines and points layers.
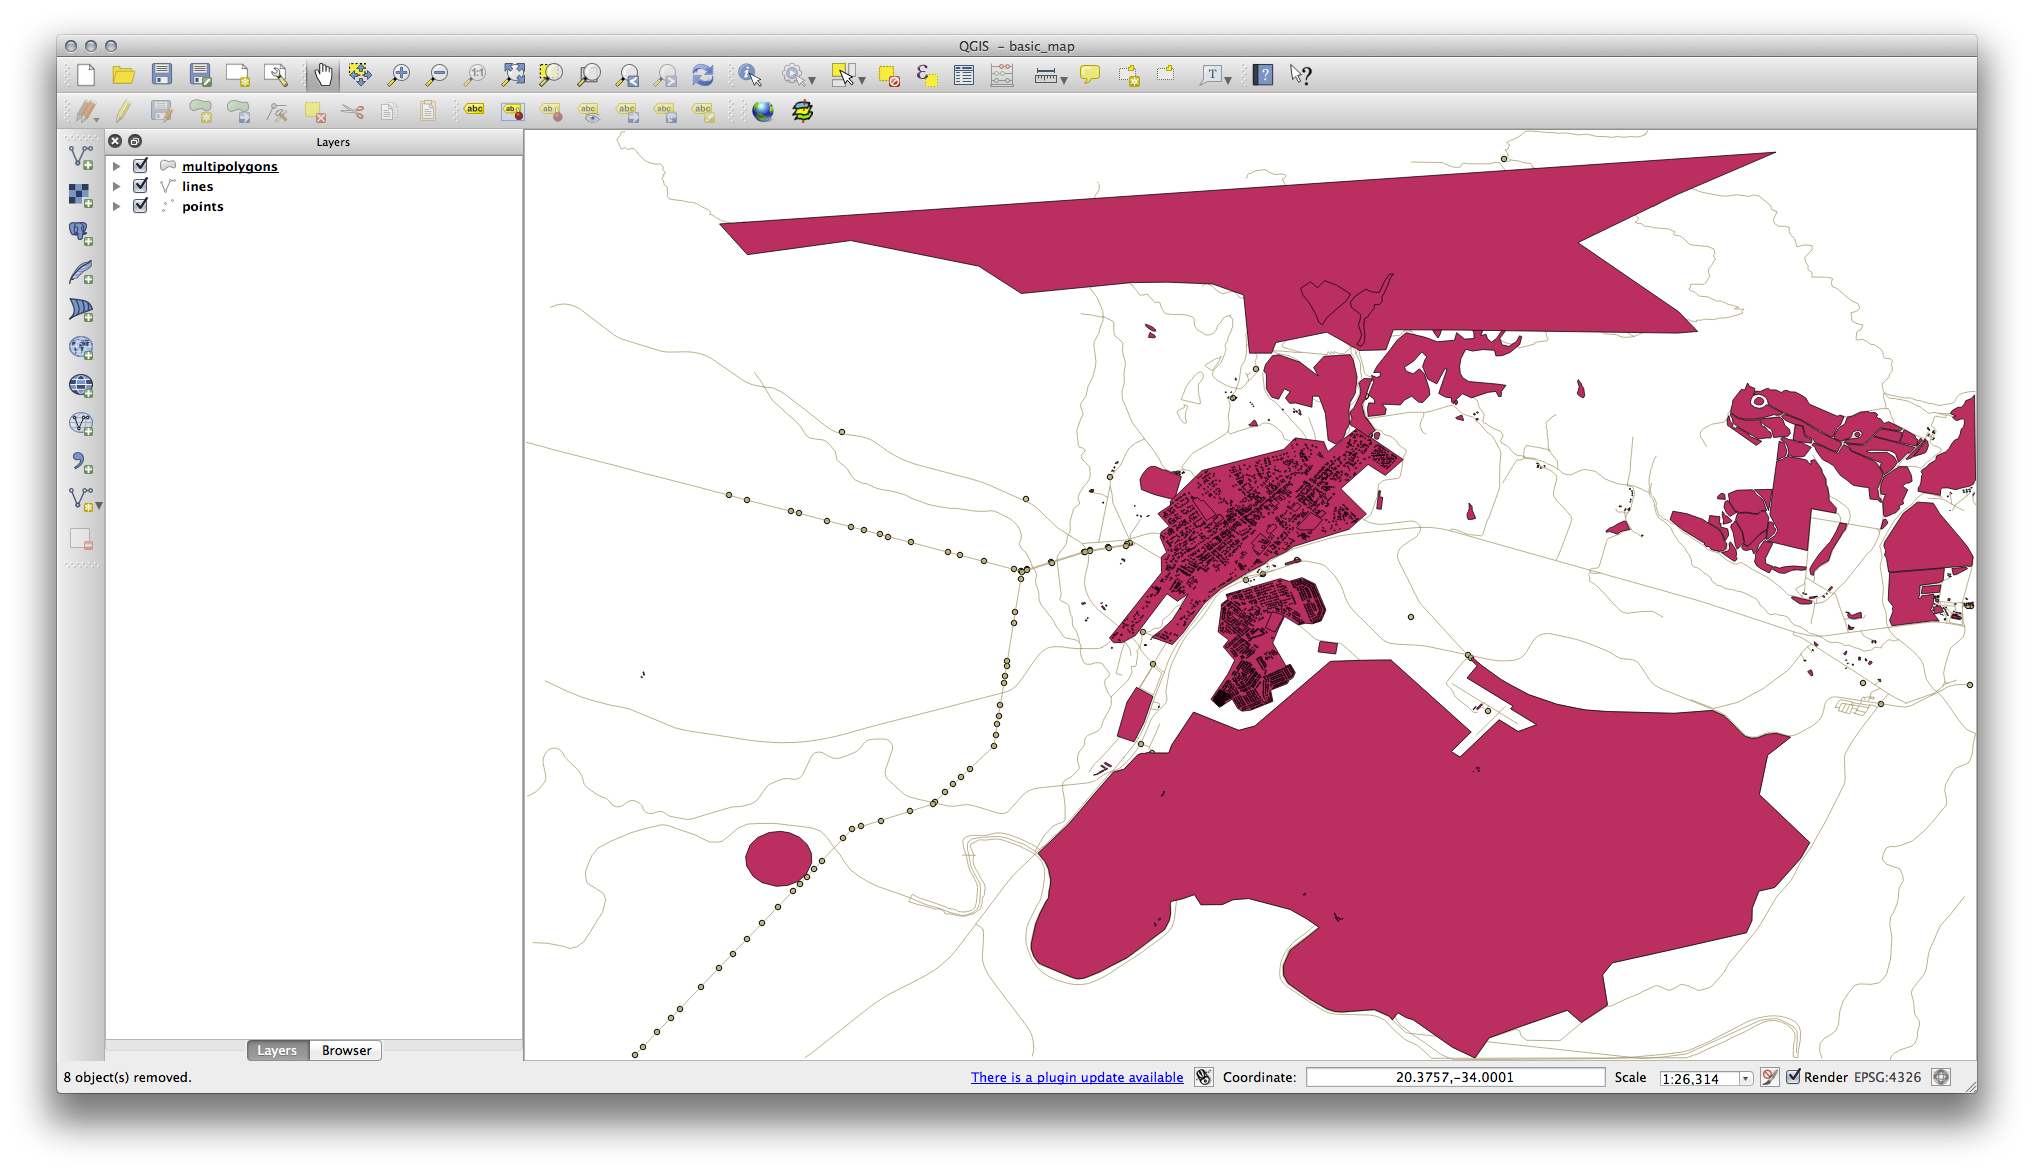
You should now have a map which looks something like this (the symbology will certainly be very different, but that is fine):
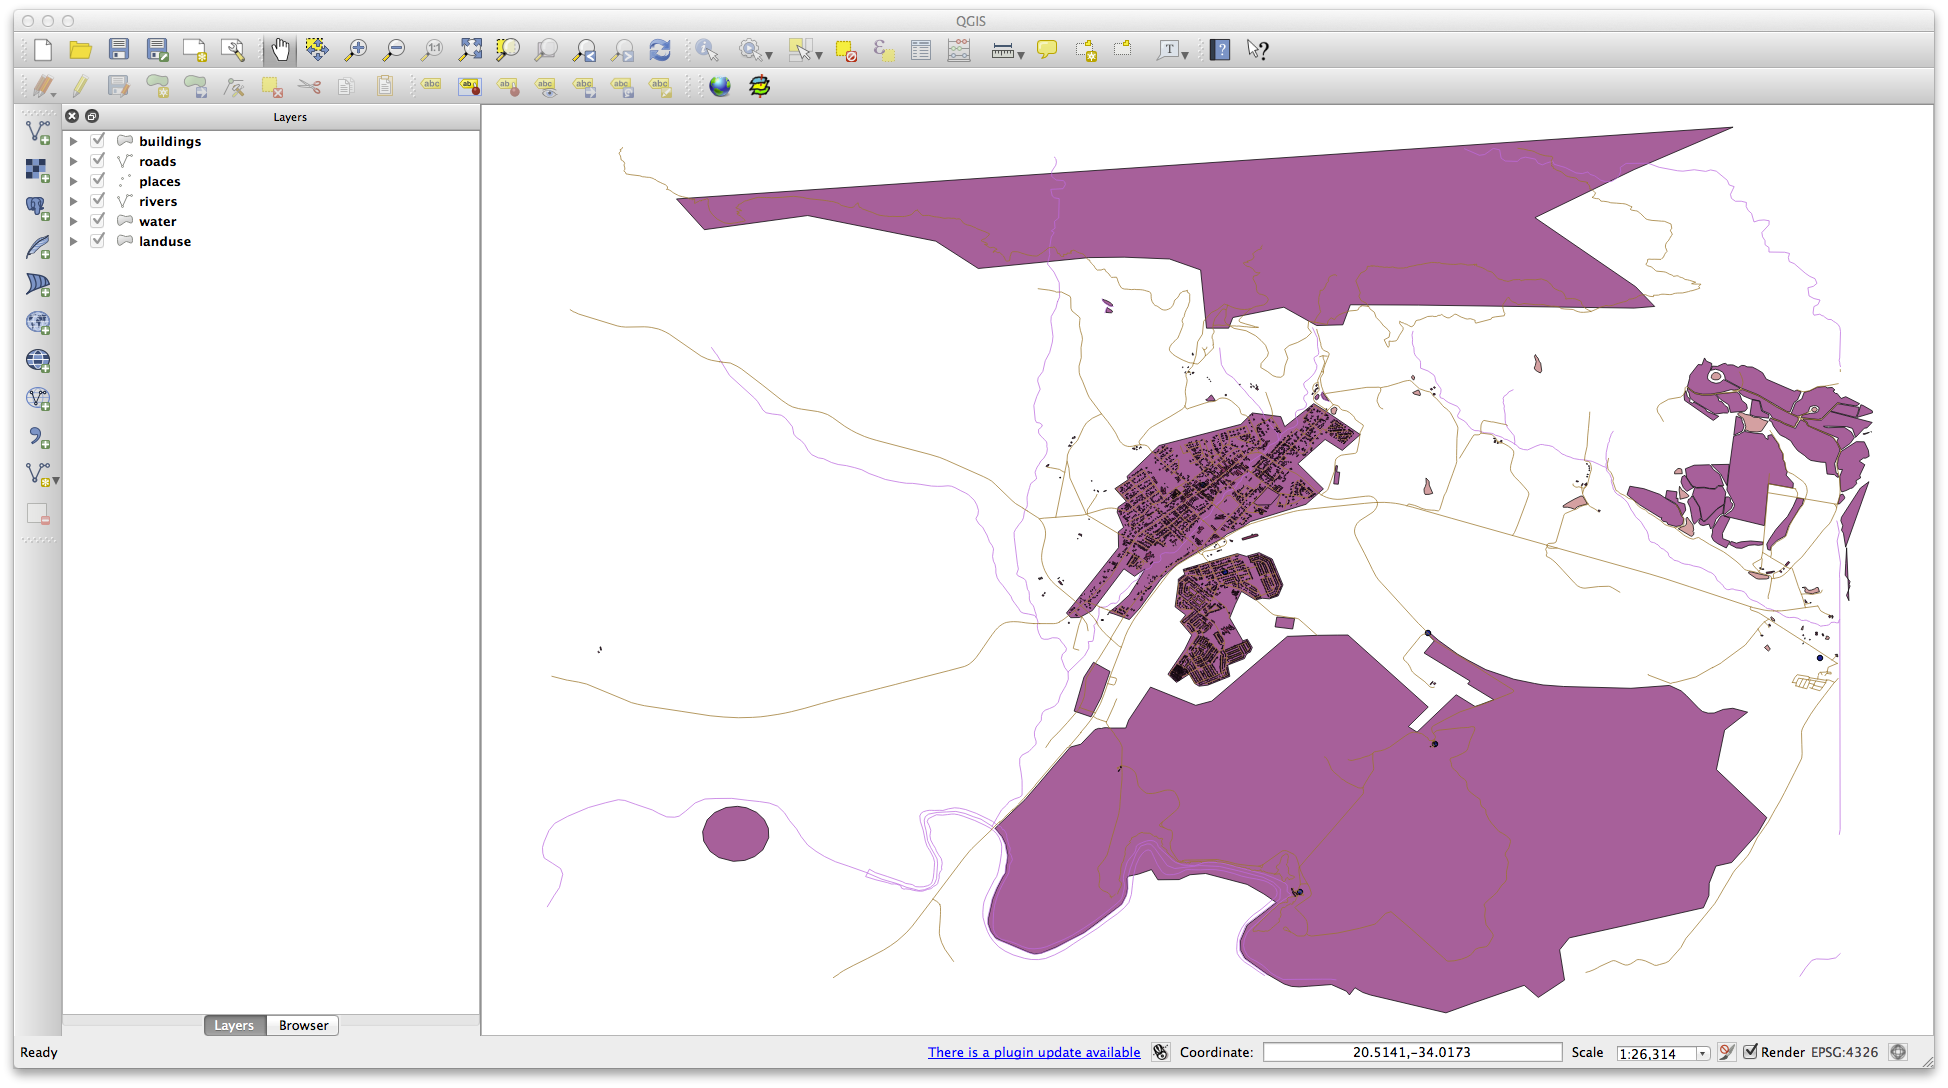
The important thing is that you have 6 layers matching those shown above and that all those layers have some data.
The last step is to create a spatiallite file from the landuse layer for use during the course:
- Right-click the landuse layer and select Save as...
- Select SpatialLite as the format and save the file as landuse under the “epsg4326” directory.
- Click Ok.
- Delete the landuse.shp and its related files (if created).
1.2.2. Try Yourself Crea un DEM SRTM tiff
For Module 6 (Creating Vector Data) and Module 8 (Rasters), you’ll also need raster images (SRTM DEM) which cover the region you have selected for your course.
Il sito CGIAR-CG (http://srtm.csi.cgiar.org/) fornisce alcuni DEM SRTM che puoi scaricare da http://srtm.csi.cgiar.org/SELECTION/inputCoord.asp.
You’ll need images which cover the entire region you have chosen to use. If you kept same data as the training manual, you can use the extent shown in the figure_set_osm_region figure above, otherwise adapt your extent. Keep the GeoTiff format. Once the form is filled, click on the Click here to Begin Search >> button and download the file(s).
Una volta che hai scaricato il file (i files) richiesto, dovranno essere salvati nella cartella exercise_data, all’interno delle sottocartelle raster/SRTM.
1.2.3. Try Yourself Crea un Files tiff di immagine
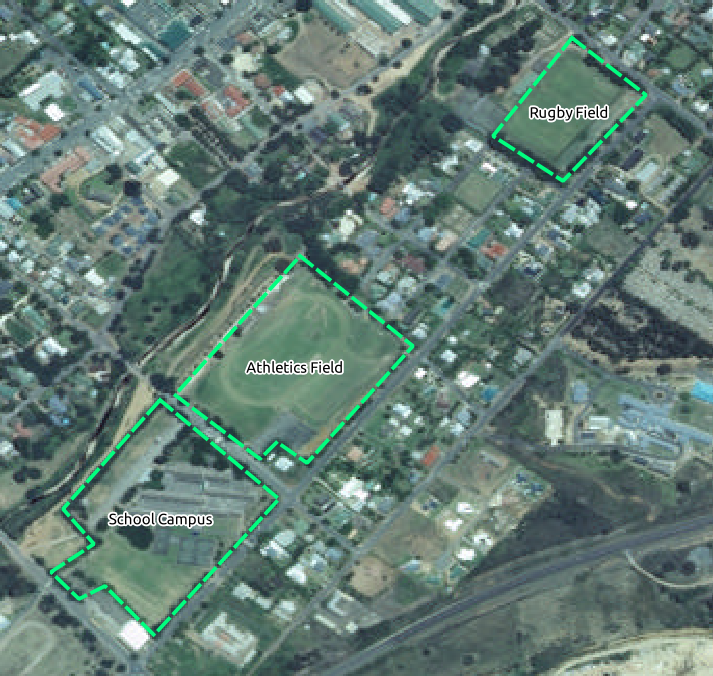
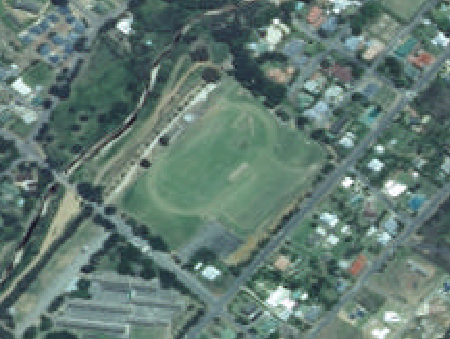
In Module 6, Lesson 1.2 shows close-up images of three school sports fields which students are asked to digitize. You’ll therefore need to reproduce these images using your new SRTM DEM tiff file(s). There is no obligation to use school sports fields: any three school land-use types can be used (e.g. different school buildings, playgrounds or car parks).
For reference, the images in the example data are:
1.2.4.  Try Yourself Sostituisci gli Emblemi
Having created your localised dataset, the final step is to replace the tokens in the conf.py file so that the appropriate names will appear in your localised version of the Training Manual.
Gli emblemi che hai bisogno di sostituire sono i seguenti:
- majorUrbanName: this defaults to “Swellendam”. Replace with the name of the major town in your region.
- schoolAreaType1: this defaults to “athletics field”. Replace with the name of the largest school area type in your region.
- largeLandUseArea: this defaults to “Bontebok National Park”. Replace with the name of a large landuse polygon in your region.
- srtmFileName: this defaults to srtm_41_19.tif. Replace this with the filename of your SRTM DEM file.
- localCRS: this defaults to WGS 84 / UTM 34S. You should replace this with the correct CRS for your region.