15.7. Lesson: Cálculo de los Parámetros Forestales
Estimar los parámetros forestales es un objetivo del inventario forestal. Continuando el ejemplo de la lección anterior, utilizarás la información de inventario recogida en el campo para calcular los parámetros forestales, primero para la totalidad del monte, y luego para las masas que has digitalizado previamente.
El objetivo de esta lección: Calcular parámetros forestales a nivel general y de masas.
15.7.1.  Follow Along: Adición de los Resultados de Inventario
Los equipos de campo visitaron el monte y con ayuda de la información que les proporcionaste, recogieron información sobre el monte en cada parcela de muestreo.
Most often the information will be collected into paper forms in the field, then typed to a spreadsheet. The sample plots information has been condensed into a .csv file that can be easily open in QGIS.
Continue with the QGIS project from the lesson about designing the inventory, you probably named it forest_inventory.qgs.
Primero, añade las medidas de las parcelas de muestreo a tu proyecto QGIS:
Ve a Layer ‣ Add Delimited Text Layer....
- Browse to the file systematic_inventory_results.csv located in exercise_data\forestry\results\.
Asegúrate que la opción Point coordinates está activada.
- Set the fields for the coordinates to the X and Y fields.
Haz clic en OK.
- When prompted, select ETRS89 / ETRS-TM35FIN as the CRS.
Abre la Attribute table de la nueva capa y echa un vistazo a los datos.
You can read the type of data that is contained in the sample plots measurements in the text file legend_2012_inventorydata.txt located in the exercise_data\forestry\results\ folder.
The systematic_inventory_results layer you just added is actually just a virtual representation of the text information in the .csv file. Before you continue, convert the inventory results to a real shapefile:
- Right click on the systematic_inventory_results layer.
- Browse to exercise_data\forestry\results\ folder.
- Name the file sample_plots_results.shp.
Activa Add saved file to map.
- Remove the systematic_inventory_results layer from your project.
15.7.2.  Follow Along: Estimación de los Parámetros del Monte Entero
You can calculate the averages for this whole forest area from the inventory results for the some interesting parameters, like the volume and the number of stems per hectare. Since the systematic sample plots represent equal areas, you can directly calculate the averages of the volumes and number of stems per hectare from the sample_plots_results layer.
Puedes calcular la media de un campo en la capa vectorial utilizando la herramienta Basic statistics:
- Open Vector ‣ Analysis Tools ‣ Basic statistics.
- Select the sample_plots_results as the Input Vector Layer.
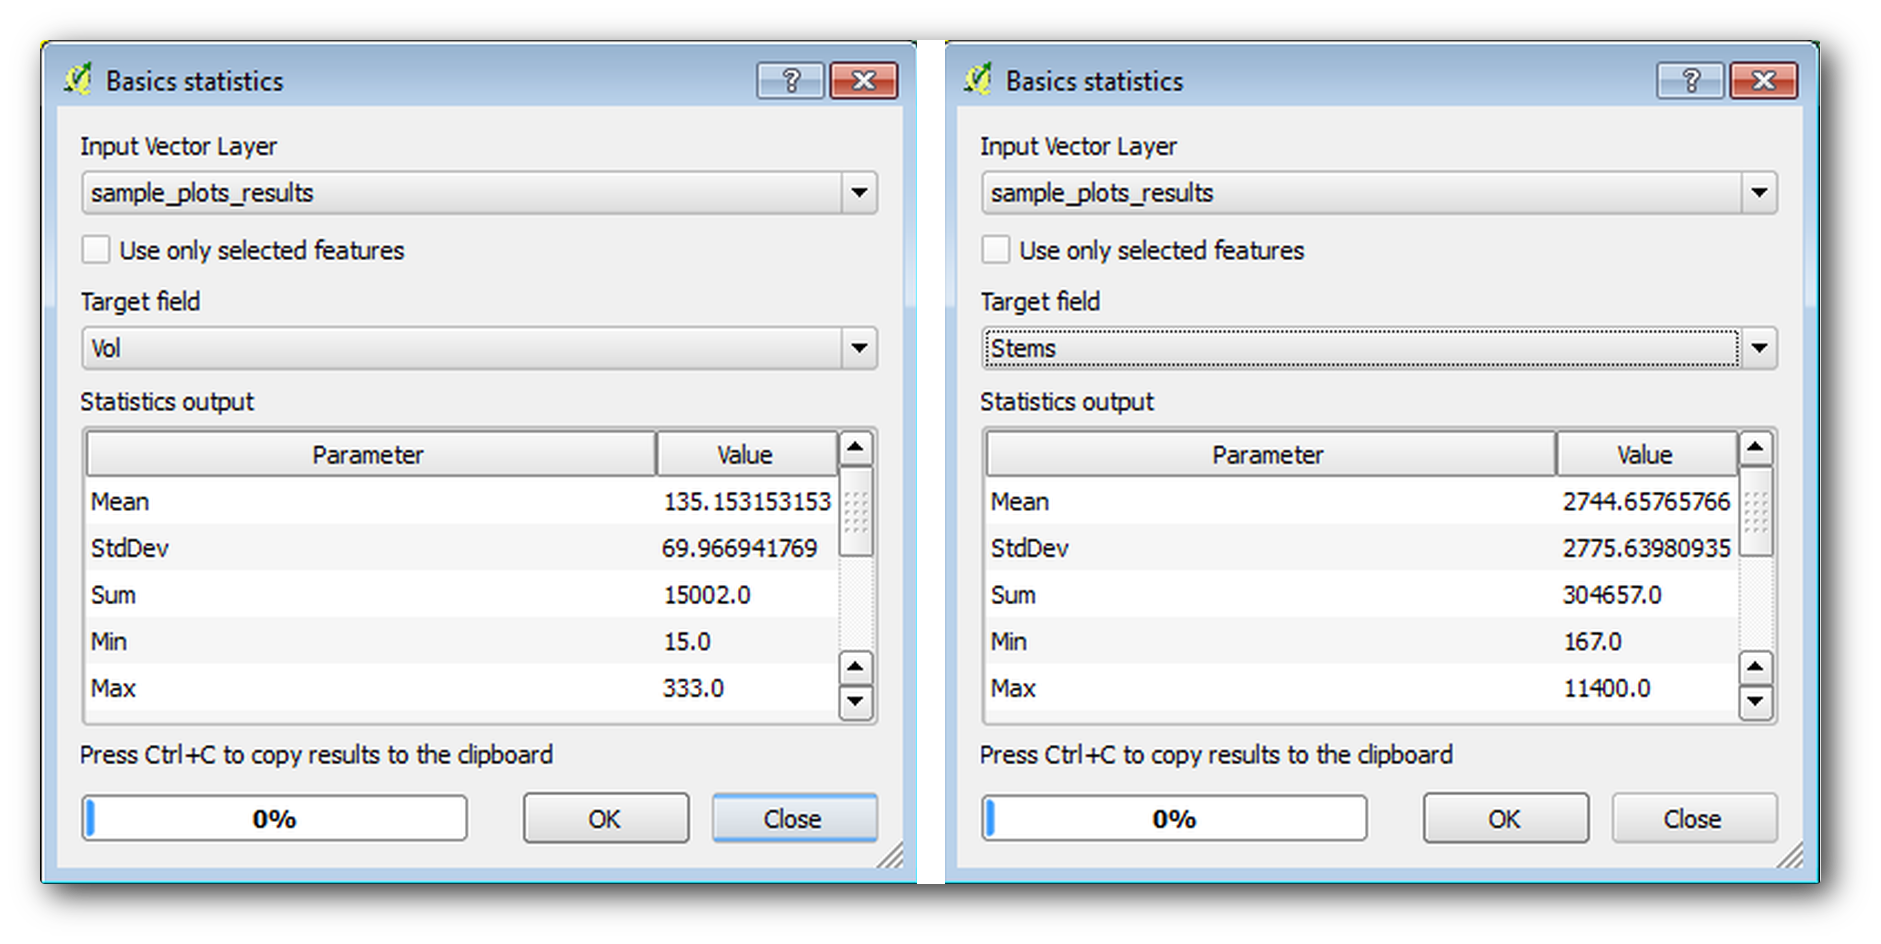
- Select Vol as Target field.
Haz clic en OK.
The average volume in the forest is 135.2 m3/ha.
You can calculate the average for the number of stems in the same way, 2745 stems/ha.

15.7.3.  Follow Along: stimación de los Parámetros por Masa
Puedes utilizar las mismas parcelas de muestreo sistemáticas para calcular estimaciones para diferentes masas forestales que previamente has digitalizado. Algunas de las masas forestales no tuvieron ninguna parcela de muestreo y para esas no obtendrás información. Podrías haber planeado algunas parcelas de muestreo extra cuando planeaste el inventario sistemático, para que los equipos de campo hubieran medido unas pocas parcelas de muestreo para ese propósito. O podrías enviar un equipo de campo luego para obtener la estimación de las masas forestales que falten para completar el inventario de masas. No obstante, obtendrás información para un buen número de masas simplemente utilizando las parcelas planeadas.
Lo que necesitas es obtener las medias de las medias de las parcelas que están incluidas dentro de cada masa forestal. Cuando quieras combinar información basada en sus localidades relativas, realizarás una unión espacial:
Abre la herramienta Vector ‣ Data Management ‣ Join attributes by location.
- Set forest_stands_2012 as the Target vector layer. The layer you want the results for.
- Set sample_plots_results as the Join vector layer. The layer you want to calculate estimates from.
Activa Take summary of intersecting features.
Activa solo el cálculo de Mean.
- Name the result as forest_stands_2012_results.shp and save it in the exercise_data\forestry\results\ folder.
Finalmente selecciona Keep all records..., así luego podrás comprobar las masas que no obtuvieron información.
Haz clic en OK.
Acepta añadir la nueva capa a tu proyecto cuando se requiera.
Cierra la herramienta Join attributes by location.
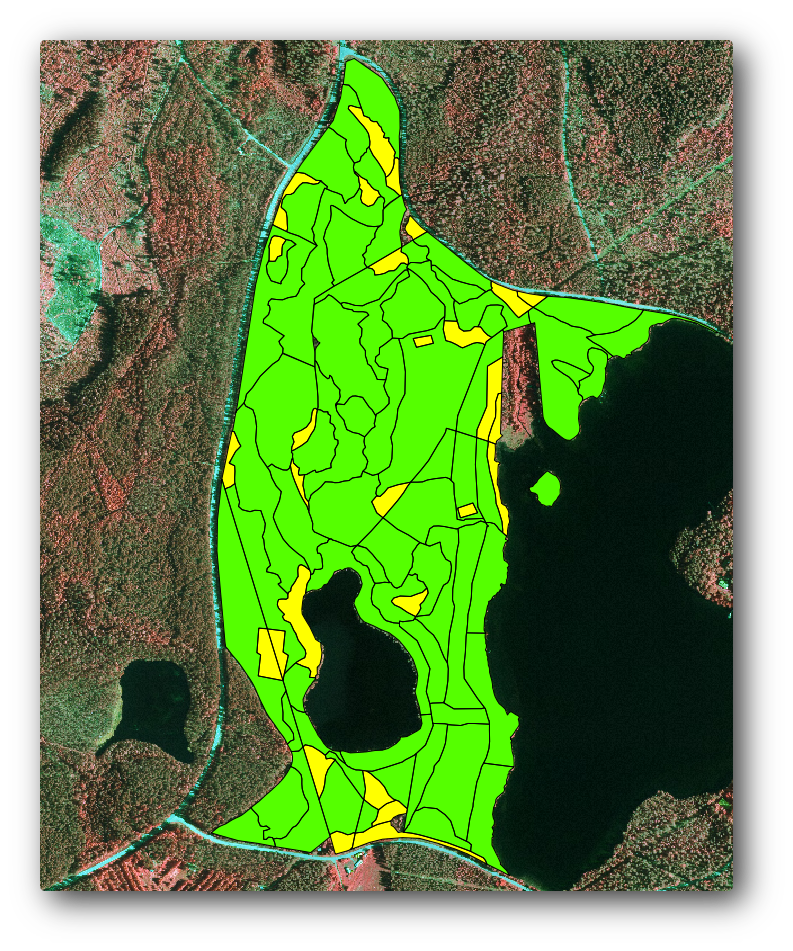
Open the Attribute table for forest_stands_2012_results and review the results you got. Note that a number of forest stands have NULL as the value for the calculations, those are the ones having no sample plots. Select them all review them in the map, they are some of the smaller stands:

Lets calculate now the same averages for the whole forest as you did before, only this time you will use the averages you got for the stands as the bases for the calculation. Remember that in the previous situation, each sample plot represented a theoretical stand of 80x80 m. Now you have to consider the area of each of the stands individually instead. That way, again, the average values of the parameters that are in, for example, m3/ha for the volumes are converted to total volumes for the stands.
Necesitas calcular primero las áreas para las masas y luego calcular volúmenes totales y número de pies para cada una de ellas:
En la Tabla de atributos habilitar la edición.
Abre el Field calculator.
- Create a new field called area.
- Leave the Output field type to Decimal number (real).
- Set the Precision to 2.
- In the Expression box, write $area / 10000. This will calculate the area of the forest stands in ha.
Haz clic en OK.
Ahora calcula un campo con el volumen total y el número de pies estimados para cada masa:
- Name the fields s_vol and s_stem.
Los campos pueden ser números enteros o también puedes utilizar números reales.
- Use the expressions "area" * "MEANVol" and "area" * "MEANStems" for total volumes and total stems respectively.
Guarda la edición cuando hayas terminado.
Desactiva la edición.
En la situación anterior, las áreas representadas por cada parcela de muestreo era la misma, así que era suficiente el cálculo de la media de las parcelas de muestreo. Ahora para calcular las estimaciones, necesitas dividir la suma del volumen de las masas por la suma del área de las masas que contienen información.
- In the Attribute table for the forest_stands_2012_results layer, select all the stands containing information.
- Open Vector ‣ Analysis Tools ‣ Basic statistics.
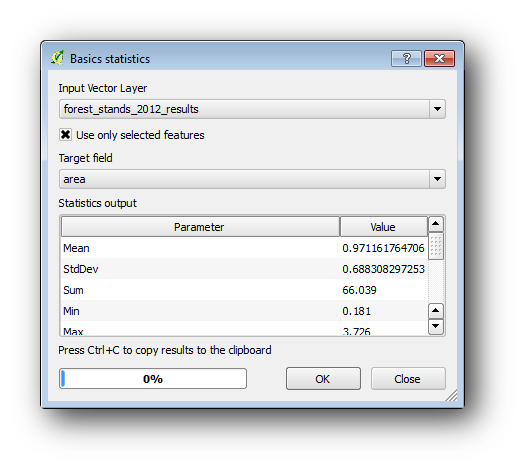
- Select the forest_stands_2012_results as the Input Vector Layer.
- Select area as Target field.
- Check the Use only selected features
Haz clic en OK.

As you can see, the total sum of the stands’ areas is 66.04 ha. Note that the area of the missing forest stands is only about 7 ha.
In the same way, you can calculate that the total volume for these stands is 8908 m3/ha and the total number of stems is 179594 stems.
Utilizando la información de las masas forestales, en lugar de utilizar directamente la de las parcelas de muestreo, te da las siguientes estimaciones medias:
- 184.9 m3/ha and
- 2719 stems/ha.
Save your QGIS project, forest_inventory.qgs.
15.7.4. In Conclusion
Te las has arreglado para calcular las estimaciones forestales para el monte entero utilizando la información de tus parcelas de muestreo sistemáticas, primero sin considerar las características del monte y luego utilizando la interpretación de la imagen aérea de las masas forestales. También obtuviste alguna información valiosa sobre las masas en particular, que podría ser utilizado para planear el manejo del monte en los próximos años.
15.7.5. What’s Next?
En la siguiente lección, la última de este módulo, primero crearás un fondo de sombreado del relieve desde un conjunto de datos LiDAR que utilizarás para preparar un mapa de presentación con los resultados forestales que acabas de calcular.