Vektordaten
 |
Ziele: |
Das Vektordatenmodell von QGIS verstehen. |
Schlüsselwörter: |
Vektor, Punkt, Polylinie, Polygon, Vertex, Geometrie, Maßstab, Datenqualität, Darstellung, Datenquellen |
Übersicht
Vector data provide a way to represent real world features within the GIS environment. A feature is anything you can see on the landscape. Imagine you are standing on the top of a hill. Looking down you can see houses, roads, trees, rivers, and so on (see figure_vector_landscape). Each one of these things would be a feature when we represent them in a GIS Application. Vector features have attributes, which consist of text or numerical information that describe the features.
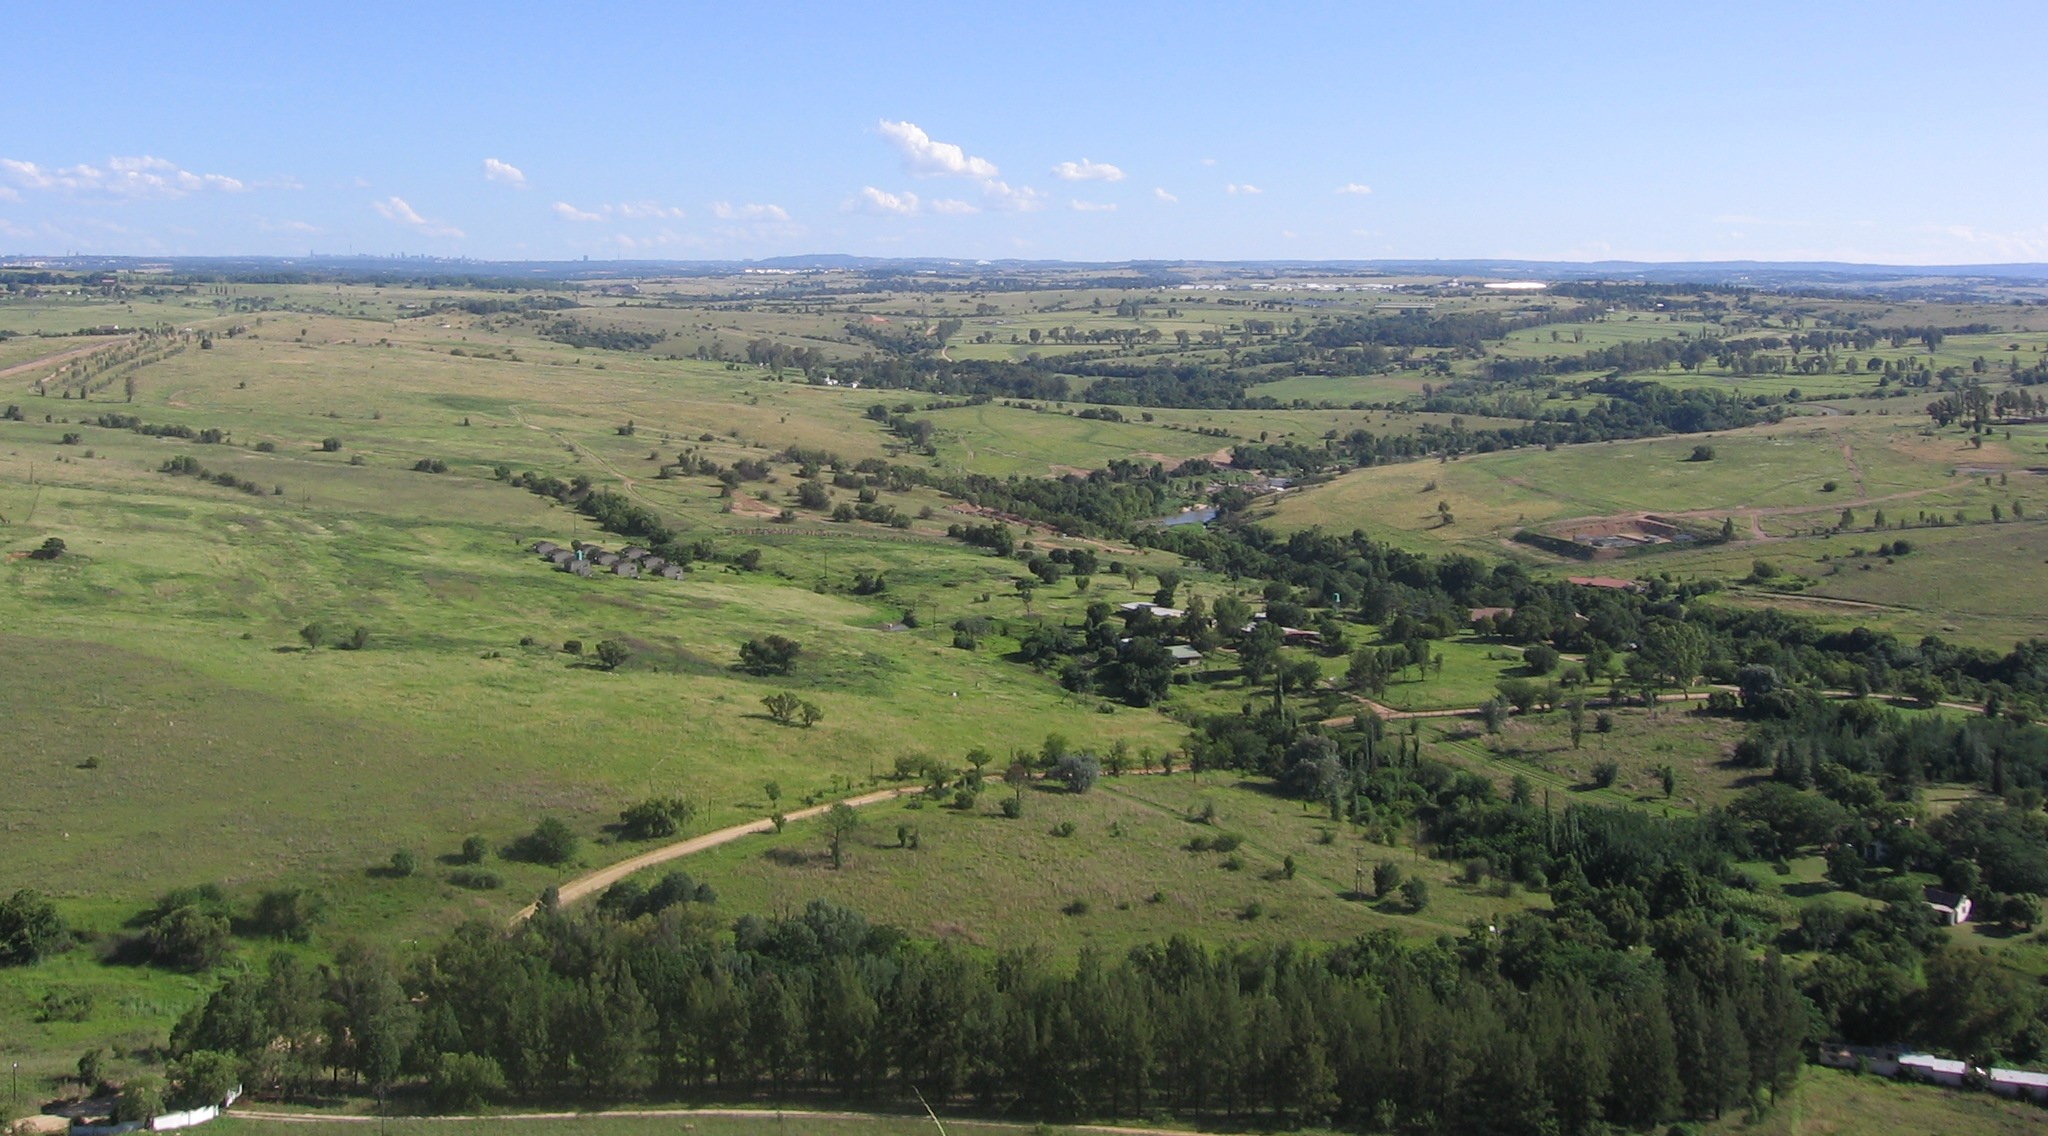
Wenn Sie den Blick über eine Landschaft schweifen lassen, können Sie die Haupt-Features wie Straßen, Häuser und Bäume erkennen.
A vector feature has its shape represented using geometry. The geometry is made up of one or more interconnected vertices. A vertex describes a position in space using an X, Y and optionally z axis. Geometries which have vertices with a Z axis are often referred to as 2.5D since they describe height or depth at each vertex, but not both.
When a feature’s geometry consists of only a single vertex, it is referred to as a point feature (see illustration figure_geometry_point). Where the geometry consists of two or more vertices and the first and last vertex are not equal, a polyline feature is formed (see illustration figure_geometry_polyline). Where three or more vertices are present, and the last vertex is equal to the first, an enclosed polygon feature is formed (see illustration figure_geometry_polygon).
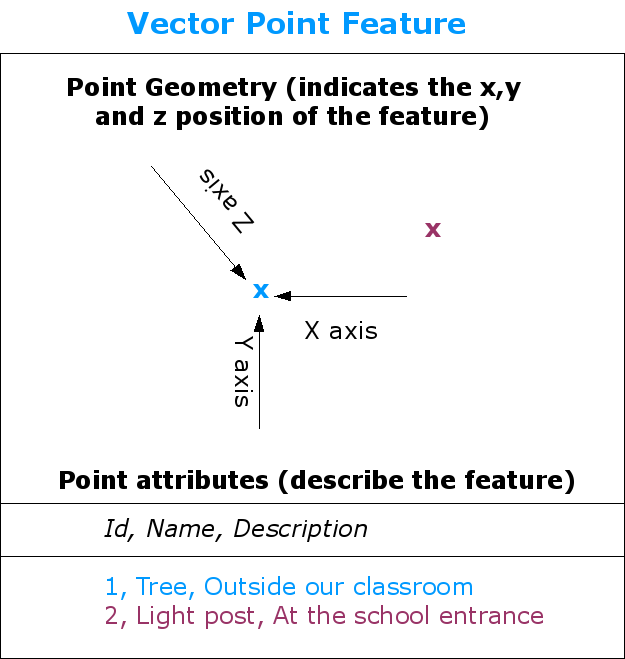
Ein Punkt-Feature wird durch seine X-, Y- und optional Z-Koordinate beschrieben. Die Punktattribute beschreiben den Punkt, z.B. ob es sich um einen Baum oder einen Laternenpfahl handelt.
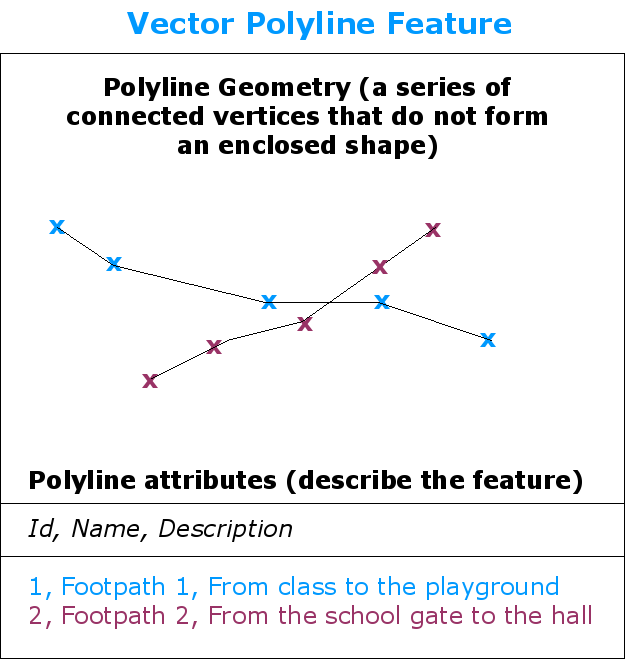
Eine Polylinie ist eine Sequenz verbundener Vertices. Jeder Vertex hat eine X-, Y- (und optional Z-)Koordinate. Die Polylinie wird durch ihre Attribute beschrieben.
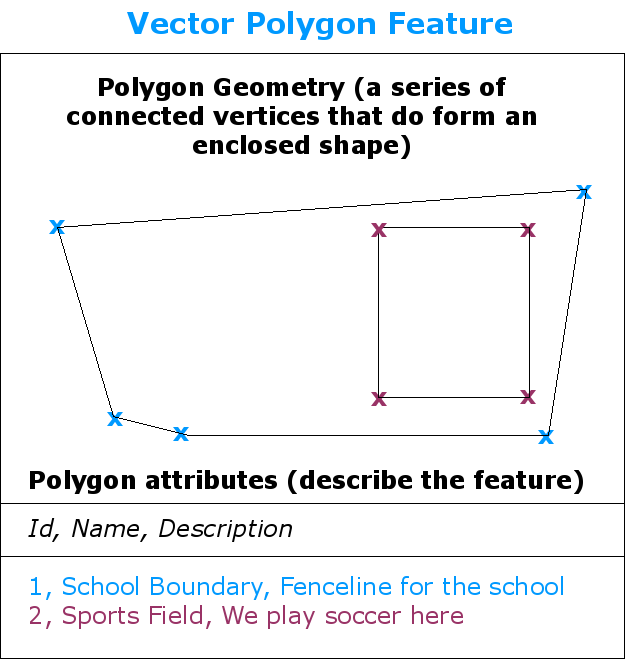
Ein Polygon besteht wie auch eine Polylinie aus einer Sequenz von Vertices. In einem Polygon befinden sich der erste und letzte Vertex jedoch an der gleichen Stelle.
Wenn Sie sich jetzt noch einmal das Landschaftsfoto von eben anschauen, sollten Sie in der Lage sein die verschiedenen Feature-Typen auf die Art zu sehen, wie ein GIS sie jetzt repräsentiert (siehe figure_geometry_landscape).
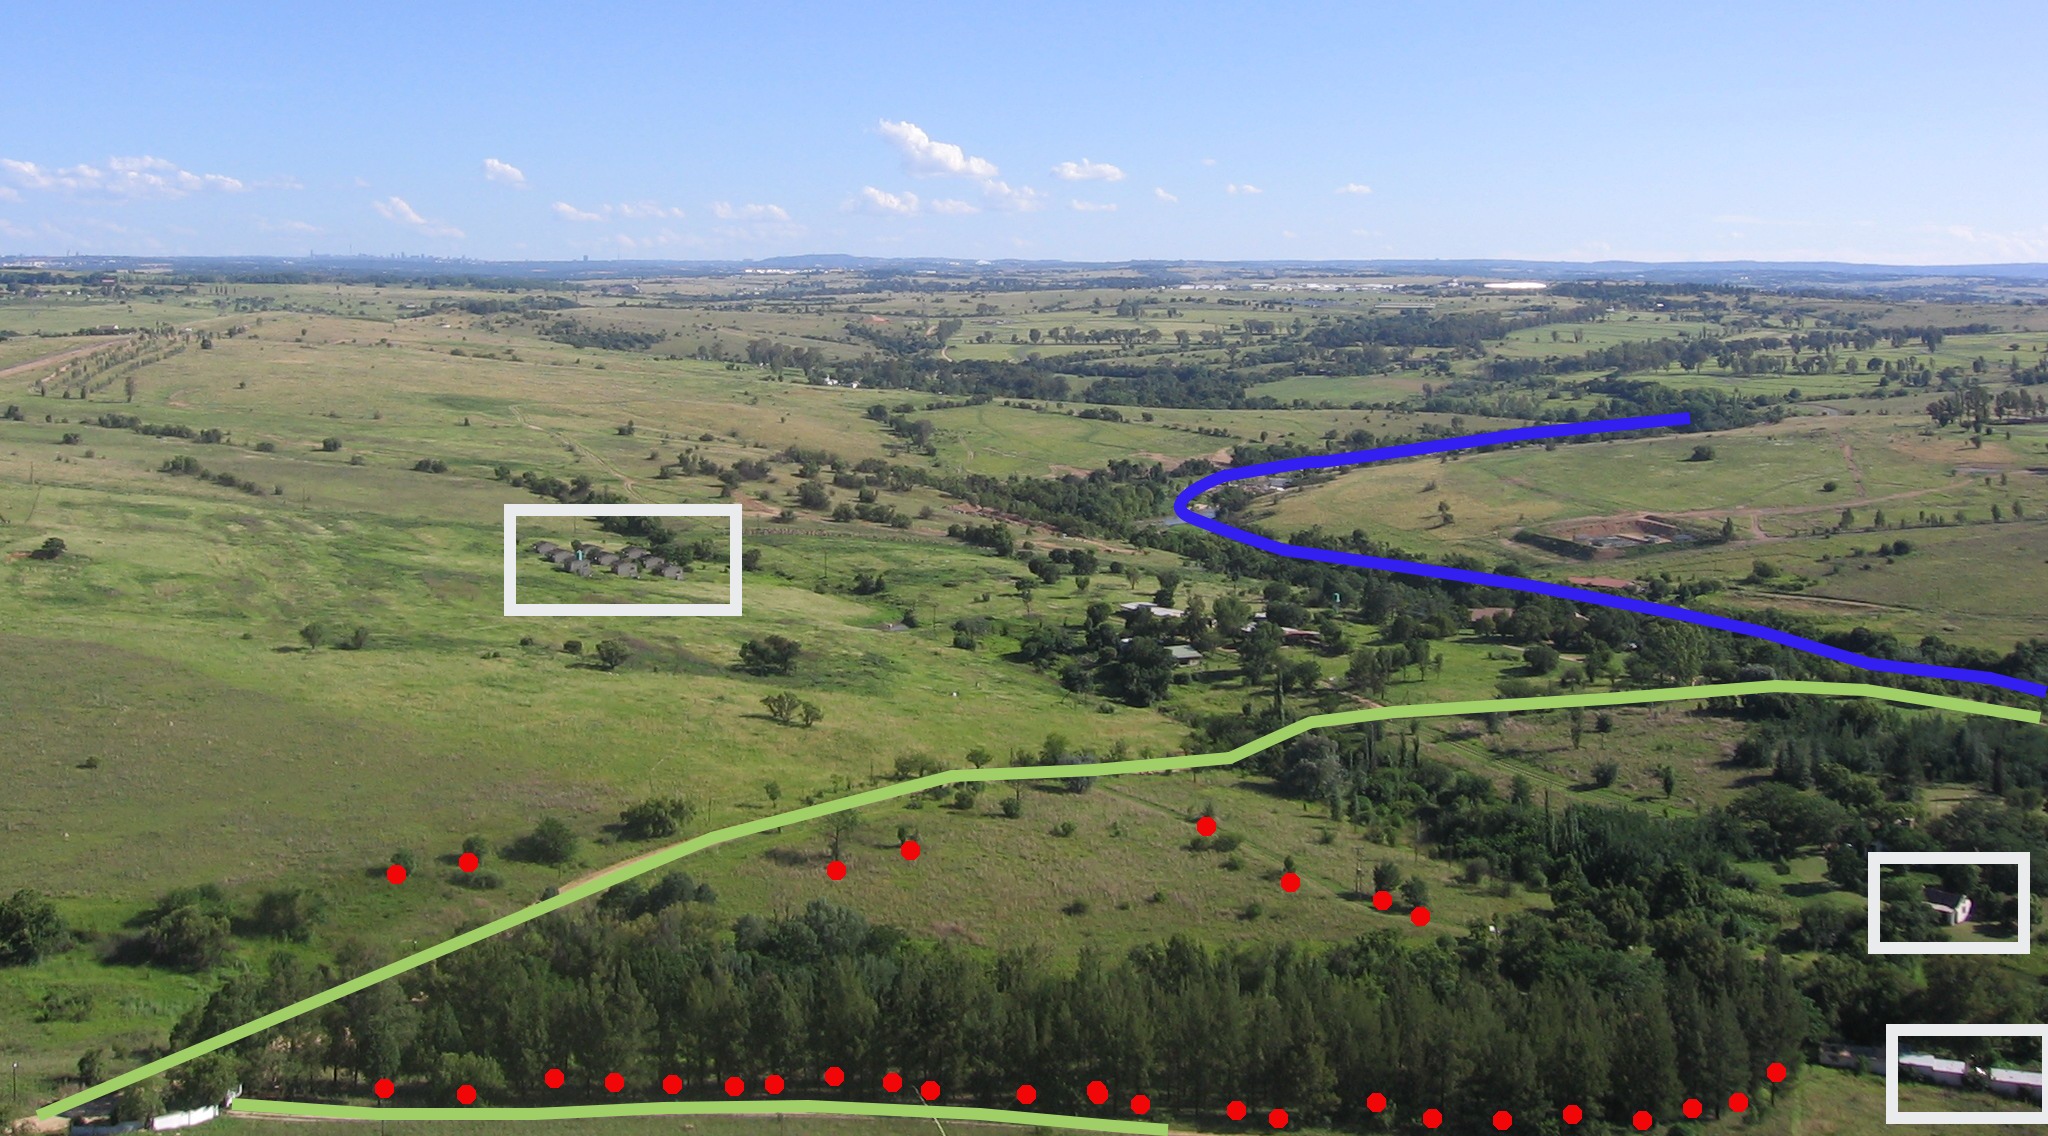
Landschafts-Features, wie wir sie in einem GIS darstellen würden. Flüsse (blau) und Straßen (grün) können als Linien dargestellt werden, Bäume als Punkte (rot) und Häuser als Polygone (weiß).
Punkt-Features im Detail
Wenn wir über Punkt-Features sprechen, müssen wir uns als allererstes vergegenwärtigen, dass ein Punkt in einem GIS Ansichtssache ist, und oftmals vom Maßstab abhängt. Schauen wir uns zum Beispiel Städte an. Wenn Sie eine Karte mit kleinem Maßstab haben (die ein großes Gebiet darstellt), könnte es sinnvoll sein eine Stadt durch ein Punkt-Feature darzustellen. Wenn sie den Kartenausschnitt jedoch vergrößern, ist es sinnvoller das Stadtgebiet als Polygon abzubilden.
Wenn Sie sich dazu entscheiden Punkte zur Darstellung eines Features zu wählen, so ist dies meistens eine Frage von Maßstab (Entfernung bis zum Feature), Bequemlichkeit (es benötigt weniger Zeit und Aufwand Punkt-Features zu erstellen als Polygon-Features) und Feature-Typ (bei manchen Dingen wie z.B. Telefonmasten hat es keinen Sinn sie als Polygone zu speichern).
As we show in illustration figure_geometry_point, a point feature has an X, Y and optionally, Z value. The X and Y values will depend on the Coordinate Reference System (CRS) being used. We are going to go into more detail about Coordinate Reference Systems in a later tutorial. For now let’s simply say that a CRS is a way to accurately describe where a particular place is on the earth’s surface. One of the most common reference systems is Longitude and Latitude. Lines of Longitude run from the North Pole to the South Pole. Lines of Latitude run from the East to West. You can describe precisely where you are at any place on the earth by giving someone your Longitude (X) and Latitude (Y). If you make a similar measurement for a tree or a telephone pole and marked it on a map, you will have created a point feature.
Da wir wissen, dass die Erde keine Scheibe ist, ist es oftmals nützlich dem Punkt-Feature einen Z-Wert hinzuzufügen. Dieser beschreibt die Höhe über dem Meeresspiegel.
Polylinien-Features im Detail
Where a point feature is a single vertex, a polyline has two or more vertices. The polyline is a continuous path drawn through each vertex, as shown in figure_geometry_polyline. When two vertices are joined, a line is created. When more than two are joined, they form a ‘line of lines’, or polyline.
Eine Polylinie wird verwendet um lineare Features wie Straßen, Flüsse, Konturen, Fußwege, Flugrouten usw. darzustellen. Manchmal gibt es für Polylinien zusätzlich zu ihrer Basisgeometrie spezielle Vorschriften. Zum Beispiel dürfen sich Konturlinien berühren (z.B. bei einer Felsklippe), sie dürfen sich aber niemals kreuzen. Gleichermaßen sollten Polylinien, die ein Wegenetz abbilden, an Schnittpunkten miteinander verbunden sein. In manchen GIS-Anwendungen kann man diese speziellen Regeln für den jeweiligen Feature-Typ (z.B. Straßen) einstellen, so dass das GIS gewährleistet, dass diese Polylinien stets diesen Vorgaben entsprechen.
If a curved polyline has very large distances between vertices, it may appear angular or jagged, depending on the scale at which it is viewed (see figure_polyline_jagged). Because of this it is important that polylines are digitised (captured into the computer) with distances between vertices that are small enough for the scale at which you want to use the data.
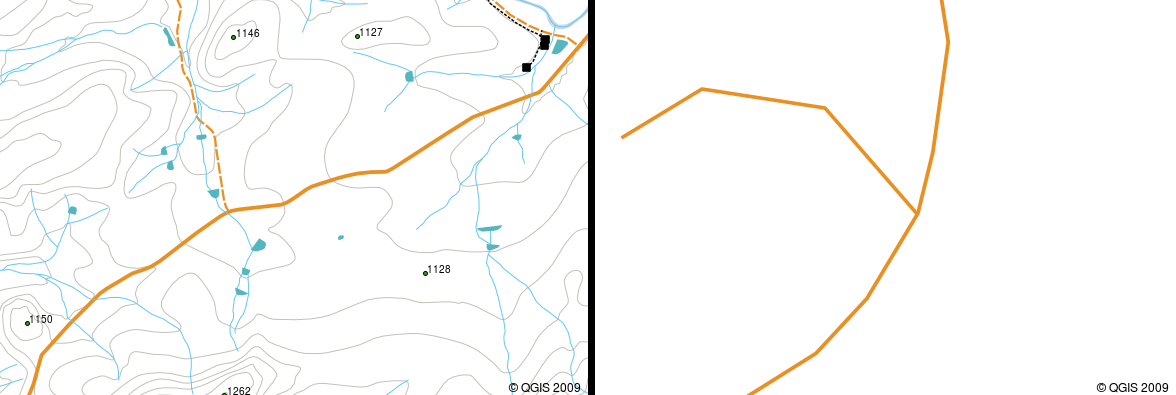
Betrachtet man Polylinien mit kleinerem Maßstab (1:20.000 links im Bild), können sie glatt und gebogen erscheinen. Zoomt man auf einen größeren Maßstab hinein (1:500 rechts im Bild), können sie sehr eckig aussehen.
Die Attribute einer Polylinie beschreiben ihre Eigenschaften und Charakteristika. Zum Beispiel könnte eine Straßen-Polylinie Attribute besitzen, die beschreiben, ob sie mit Schotter oder Teer bedeckt ist, wieviel Fahrspuren sie hat, ob es eine Einbahnstraße ist, usw. Das GIS kann diese Attribute verwenden, um das Polylinien-Feature mit einer passenden Farbe oder Linienart darzustellen.
Polygon-Features im Detail
Polygon-Features sind eingeschlossene Flächen, wie Dämme, Inseln, Ländergrenzen usw. So wie Polylinien-Features werden auch Polygon-Features durch eine Reihe von Vertices gebildet, die durch eine fortlaufende Linie miteinander verbunden sind. Da ein Polygon stets eine eingeschlossene Fläche beschreibt, sollten sich der erste und der letzte Vertex immer an der gleichen Stelle befinden! Polygone haben oftmals gemeinsame Geometrien –– Grenzen, die sie sich mit einem benachbarten Polygon teilen. Viele GIS-Anwendungen bieten die Möglichkeit, dass die Grenzen benachbarter Polygone exakt übereinstimmen. Dies werden wir im Thema Topologie später in diesem Tutorial ergründen.
Wie Punkte und Polylinien besitzen auch Polygone Attribute. Die Attribute beschreiben jedes Polygon. Zum Beispiel könnte ein Damm Attibute für Tiefe und Wasserqualität besitzen.
Vektordaten in Layern
Now that we have described what vector data is, let’s look at how vector data is managed and used in a GIS environment. Most GIS applications group vector features into layers. Features in a layer have the the same geometry type (e.g. they will all be points) and the same kinds of attributes (e.g. information about what species a tree is for a trees layer). For example if you have recorded the positions of all the footpaths in your school, they will usually be stored together on the computer hard disk and shown in the GIS as a single layer. This is convenient because it allows you to hide or show all of the features for that layer in your GIS application with a single mouse click.
Bearbeiten von Vektordaten
The GIS application will allow you to create and modify the geometry data in a layer –– a process called digitising –– which we will look at more closely in a later tutorial. If a layer contains polygons (e.g. farm dams), the GIS application will only allow you to create new polygons in that layer. Similarly if you want to change the shape of a feature, the application will only allow you to do it if the changed shape is correct. For example it won’t allow you to edit a line in such a way that it has only one vertex –– remember in our discussion of lines above that all lines must have at least two vertices.
Creating and editing vector data is an important function of a GIS since it is one of the main ways in which you can create personal data for things you are interested in. Say for example you are monitoring pollution in a river. You could use the GIS to digitise all outfalls for storm water drains (as point features). You could also digitise the river itself (as a polyline feature). Finally you could take readings of pH levels along the course of the river and digitise the places where you made these readings (as a point layer).
As well as creating your own data, there is a lot of free vector data that you can obtain and use. For example, you can obtain vector data that appears on the 1:50 000 map sheets from the Chief Directorate: Surveys and Mapping.
Scale and vector data
Map scale is an important issue to consider when working with vector data in a GIS. When data is captured, it is usually digitised from existing maps, or by taking information from surveyor records and global positioning system devices. Maps have different scales, so if you import vector data from a map into a GIS environment (for example by digitising paper maps), the digital vector data will have the same scale issues as the original map. This effect can be seen in illustrations figure_vector_small_scale and figure_vector_large_scale. Many issues can arise from making a poor choice of map scale. For example using the vector data in illustration figure_vector_small_scale to plan a wetland conservation area could result in important parts of the wetland being left out of the reserve! On the other hand if you are trying to create a regional map, using data captured at 1:1000 000 might be just fine and will save you a lot of time and effort capturing the data.
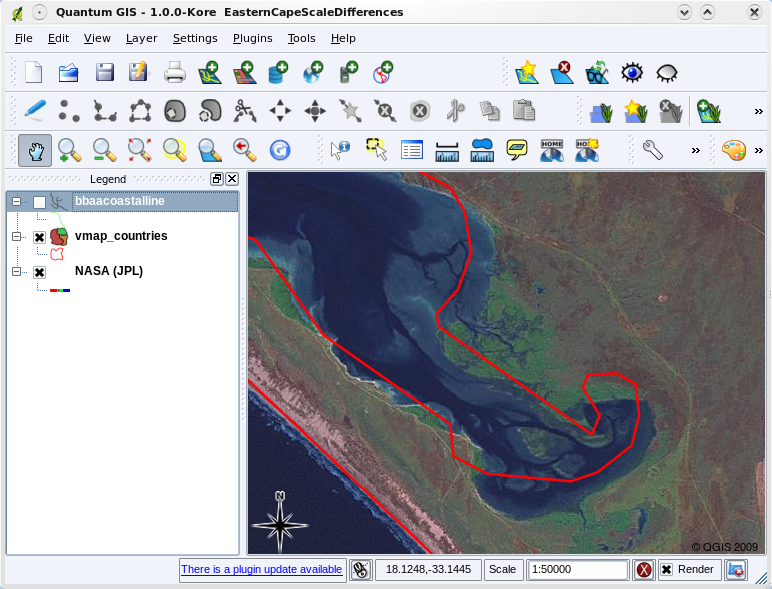
Vector data (red lines) that was digitised from a small scale (1:1000 000) map.
Vector data (green lines) that was digitised from a large scale (1:50 000) map.
Symbology
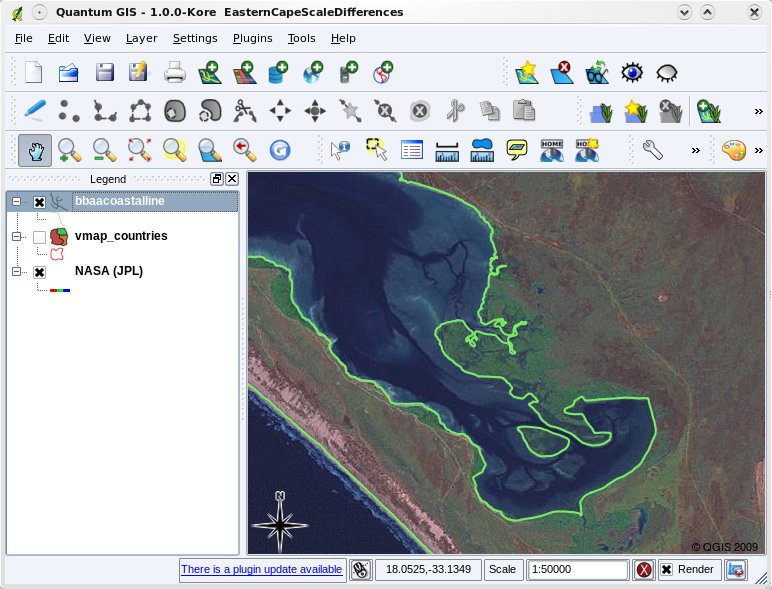
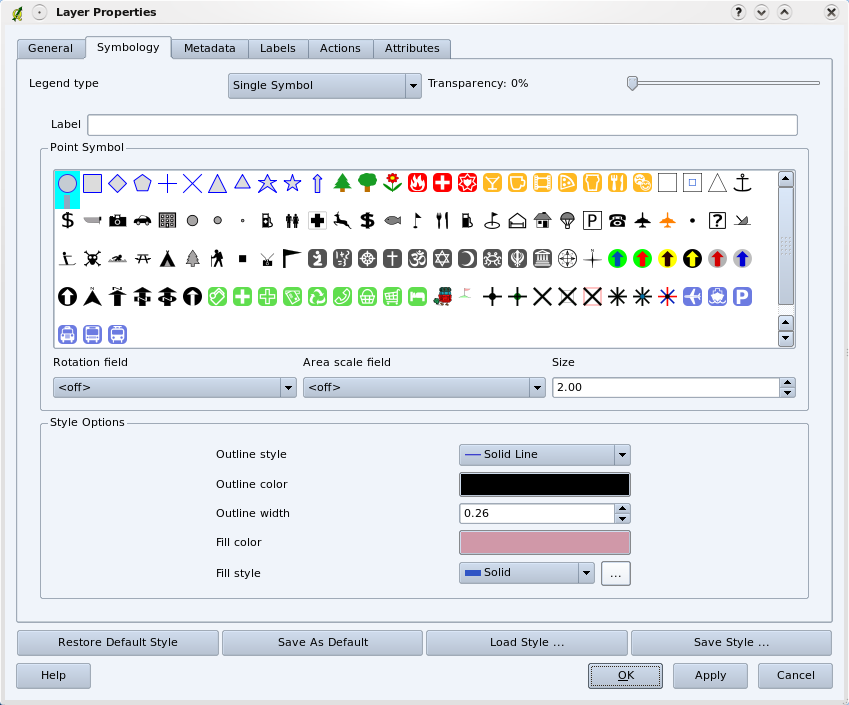
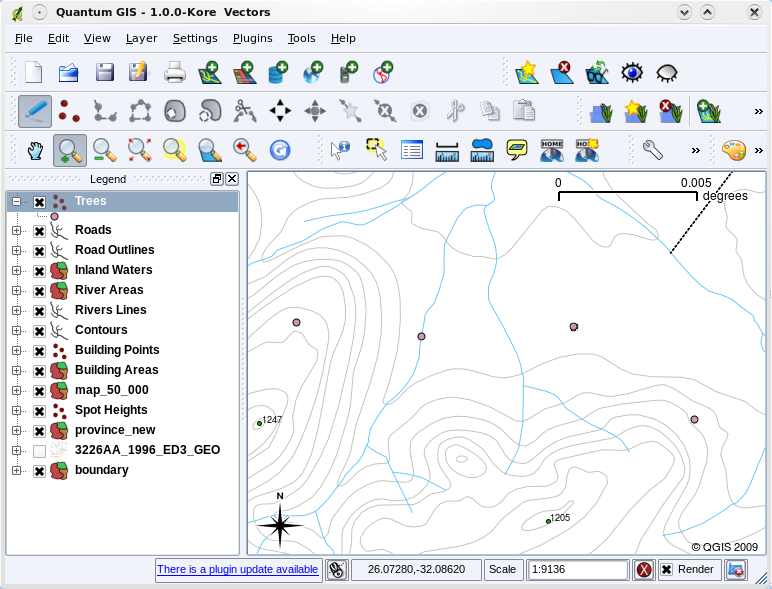
When you add vector layers to the map view in a GIS application, they will be drawn with random colours and basic symbols. One of the great advantages of using a GIS is that you can create personalised maps very easily. The GIS program will let you choose colours to suite the feature type (e.g. you can tell it to draw a water bodies vector layer in blue). The GIS will also let you adjust the symbol used. So if you have a trees point layer, you can show each tree position with a small picture of a tree, rather than the basic circle marker that the GIS uses when you first load the layer (see illustrations figure_vector_symbology, figure_generic_symbology and figure_custom_symbology).
In the GIS, you can use a panel (like the one above) to adjust how features in your layer should be drawn.
When a layer (for example the trees layer above) is first loaded, a GIS application will give it a generic symbol.
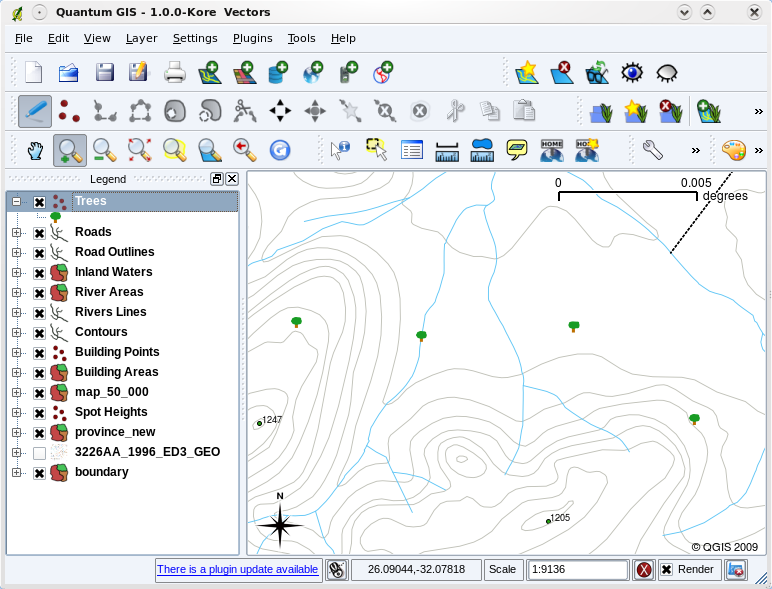
After making our adjustments it is much easier to see that our points represent trees.
Symbology is a powerful feature, making maps come to life and the data in your GIS easier to understand. In the topic that follows (Vektorattributdaten) we will explore more deeply how symbology can help the user to understand vector data.
What can we do with vector data in a GIS?
At the simplest level we can use vector data in a GIS Application in much the same way you would use a normal topographic map. The real power of GIS starts to show itself when you start to ask questions like ‘which houses are within the 100 year flood level of a river?’; ‘where is the best place to put a hospital so that it is easily accessible to as many people as possible?’; ‘which learners live in a particular suburb?’. A GIS is a great tool for answering these types of questions with the help of vector data. Generally we refer to the process of answering these types of questions as spatial analysis. In later topics of this tutorial we will look at spatial analysis in more detail.
Common problems with vector data
Working with vector data does have some problems. We already mentioned the issues that can arise with vectors captured at different scales. Vector data also needs a lot of work and maintenance to ensure that it is accurate and reliable. Inaccurate vector data can occur when the instruments used to capture the data are not properly set up, when the people capturing the data aren’t being careful, when time or money don’t allow for enough detail in the collection process, and so on.
If you have poor quality vector data, you can often detect this when viewing the data in a GIS. For example slivers can occur when the edges of two polygon areas don’t meet properly (see figure_vector_slivers).
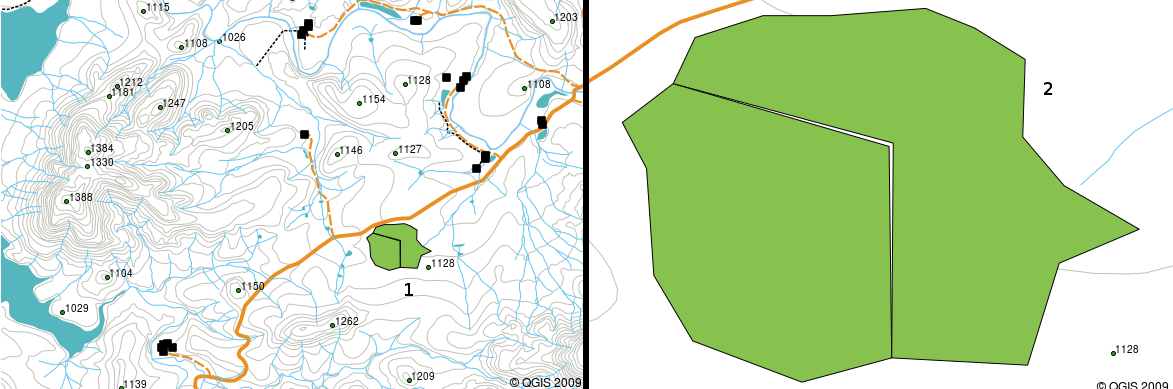
Slivers occur when the vertices of two polygons do not match up on their borders. At a small scale (e.g. 1 on left) you may not be able to see these errors. At a large scale they are visible as thin strips between two polygons (2 on right).
Overshoots can occur when a line feature such as a road does not meet another road exactly at an intersection. Undershoots can occur when a line feature (e.g. a river) does not exactly meet another feature to which it should be connected. Figure figure_vector_shoots demonstrates what undershoots and overshoots look like.
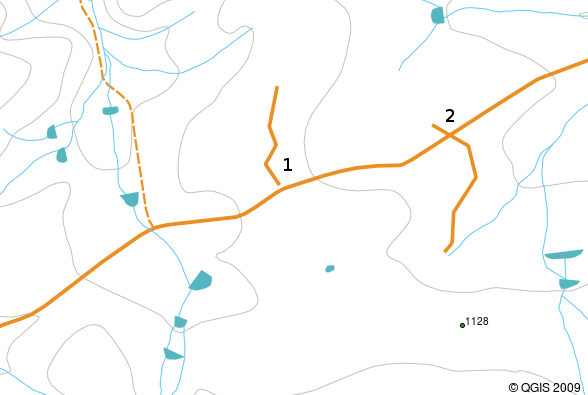
Undershoots (1) occur when digitised vector lines that should connect to each other don’t quite touch. Overshoots (2) happen if a line ends beyond the line it should connect to.
Because of these types of errors, it is very important to digitise data carefully and accurately. In the upcoming topic on topology, we will examine some of these types of errors in more detail.
Was haben wir gelernt?
Let’s wrap up what we covered in this worksheet:
- Vector data is used to represent real world features in a GIS.
- A vector feature can have a geometry type of point, line or a polygon.
- Each vector feature has attribute data that describes it.
- Feature geometry is described in terms of vertices.
- Point geometries are made up of a single vertex (X,Y and optionally Z).
- Polyline geometries are made up of two or more vertices forming a connected line.
- Polygon geometries are made up of at least four vertices forming an enclosed area. The first and last vertices are always in the same place.
- Choosing which geometry type to use depends on scale, convenience and what you want to do with the data in the GIS.
- Most GIS applications do not allow you to mix more than one geometry type in a single layer.
- Digitising is the process of creating digital vector data by drawing it in a GIS application.
- Vector data can have quality issues such as undershoots, overshoots and slivers which you need to be aware of.
- Vector data can be used for spatial analysis in a GIS application, for example to find the nearest hospital to a school.
We have summarised the GIS Vector Data concept in Figure figure_vector_summary.
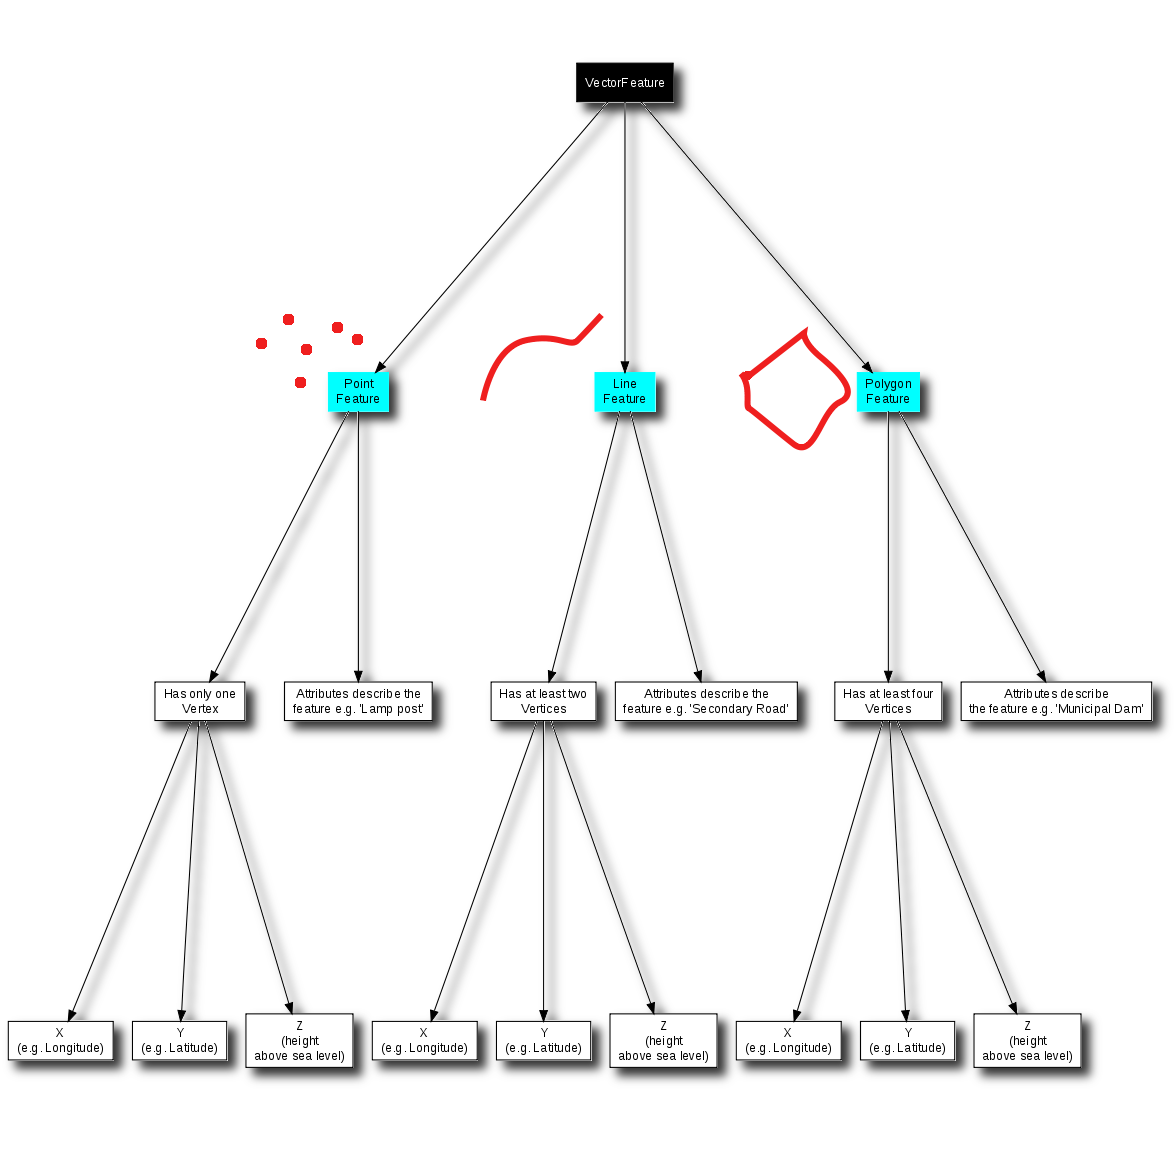
This diagram shows how GIS applications deal with vector data.
Versuchen Sie es selbst!
Hier sind einige Ideen für Sie, die Sie mit Ihren Lernenden versuchen sollten:
- Using a copy of a toposheet map for your local area (like the one shown in figure_sample_map), see if your learners can identify examples of the different types of vector data by highlighting them on the map.
- Think of how you would create vector features in a GIS to represent real world features on your school grounds. Create a table of different features in and around your school and then task your learners to decide whether they would be best represented in the GIS as a point, line or polygon. See table_vector_1 for an example.
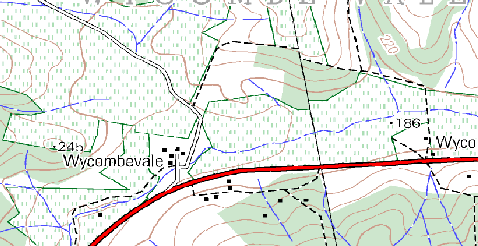
Can you identify two point features and one polygon feature on this map?
| Real world feature | Suitable Geometry Type |
|---|---|
| The school flagpole | |
| The soccer field | |
| The footpaths in and around the school | |
| Places where taps are located | |
| Etc. |
Table Vector 1: Create a table like this (leaving the geometry type column empty) and ask your learners to decide on suitable geometry types.
Something to think about
If you don’t have a computer available, you can use a toposheet and transparency sheets to show your learners about vector data.
Literaturhinweise
The QGIS User Guide also has more detailed information on working with vector data in QGIS.
Wie geht es weiter?
In the section that follows we will take a closer look at attribute data to see how it can be used to describe vector features.