Importante
A tradução é um esforço comunitário você pode contribuir. Esta página está atualmente traduzida em 38.89%.
7.2. Lesson: Changing Raster Symbology
Not all raster data are aerial photos. There are many other forms of raster data, and in many of those cases, it is essential to symbolize the them so that they becomes properly visible and useful.
El objetivo de esta lección: Cambiar la simbología de una capa ráster.
7.2.1. ★☆☆ Try Yourself:
Use the Browser Panel to load
srtm_41_19.tif, found underexercise_data/raster/SRTM/Zoom to the extent of this layer by right-clicking on it in the Layers panel and selecting Zoom to Layer.
This dataset is a Digital Elevation Model (DEM). It is a map of the elevation (altitude) of the terrain, allowing us to see where the mountains and valleys are, for example.
While each pixel of the dataset of the previous section contained color information, in a DEM, each pixel contains elevation values.
Once the DEM is loaded, you will notice that it is a grayscale representation:
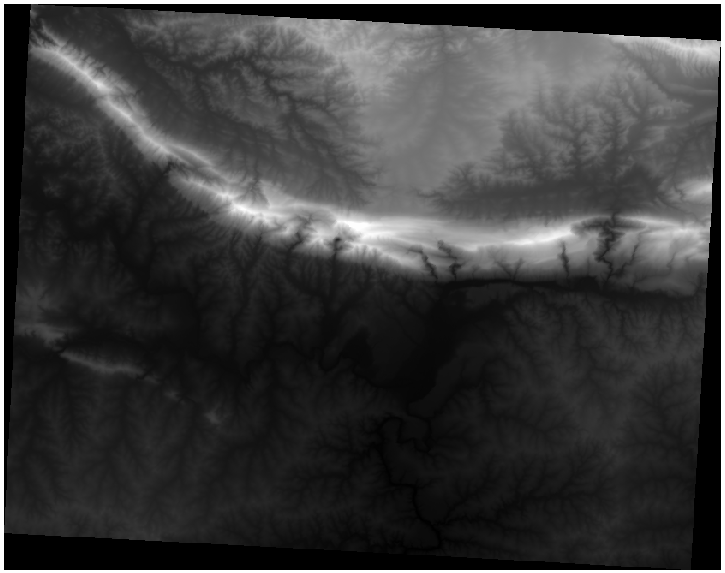
QGIS has automatically applied a stretch to the pixel values of the image for visualization purposes, and we will learn more about how this works as we continue.
7.2.2. ★☆☆ Follow Along: Changing Raster Layer Symbology
Você tem duas opções diferentes para alterar a simbologia raster:
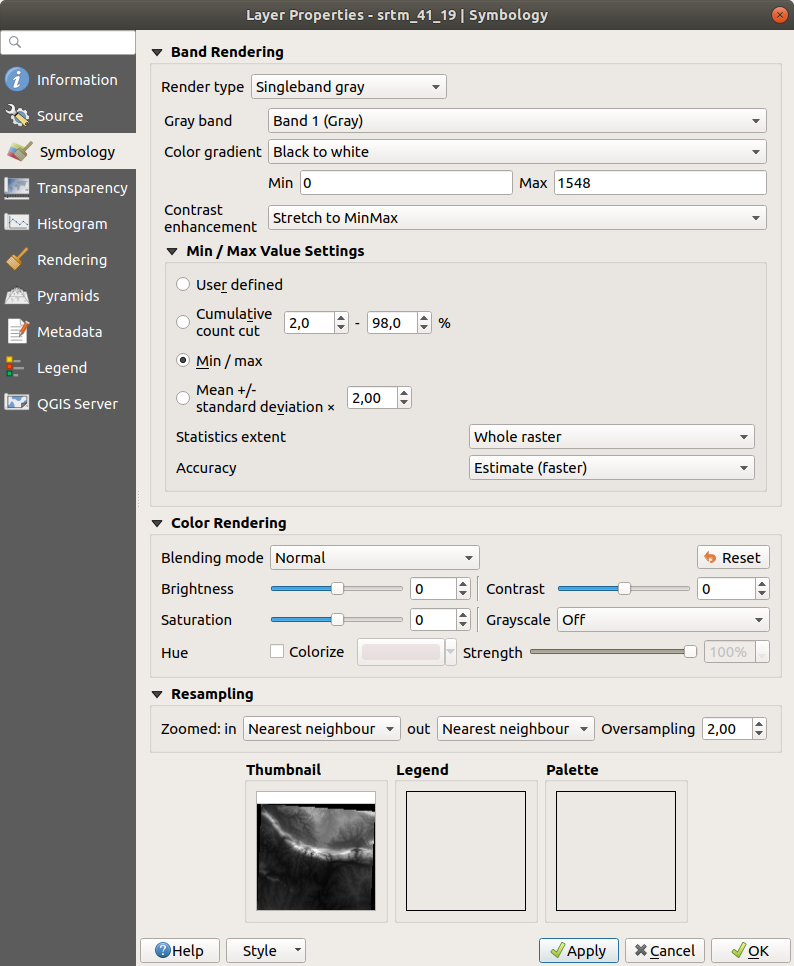
Within the Layer Properties dialog, by right-clicking on the layer in the Layer tree and selecting the Properties option. Then switch to the Symbology tab
By clicking on the
 Open the Layer Styling panel
button right above the Layers panel (shortcut
F7).
This will open the Layer Styling panel, where you can
switch to the Symbology tab.
Open the Layer Styling panel
button right above the Layers panel (shortcut
F7).
This will open the Layer Styling panel, where you can
switch to the Symbology tab.
Escolha o método com o qual você prefere trabalhar.
7.2.3. ★☆☆ Follow Along: Singleband gray
Quando você carrega um arquivo raster, se não for uma imagem de foto como as da seção anterior, o estilo padrão é definido como um gradiente de tons de cinza.
Let’s explore some of the features of this renderer.
The default Color gradient is set to Black to white,
meaning that low pixel values are black and while high values are
white.
Try to invert this setting to White to black and see the results.
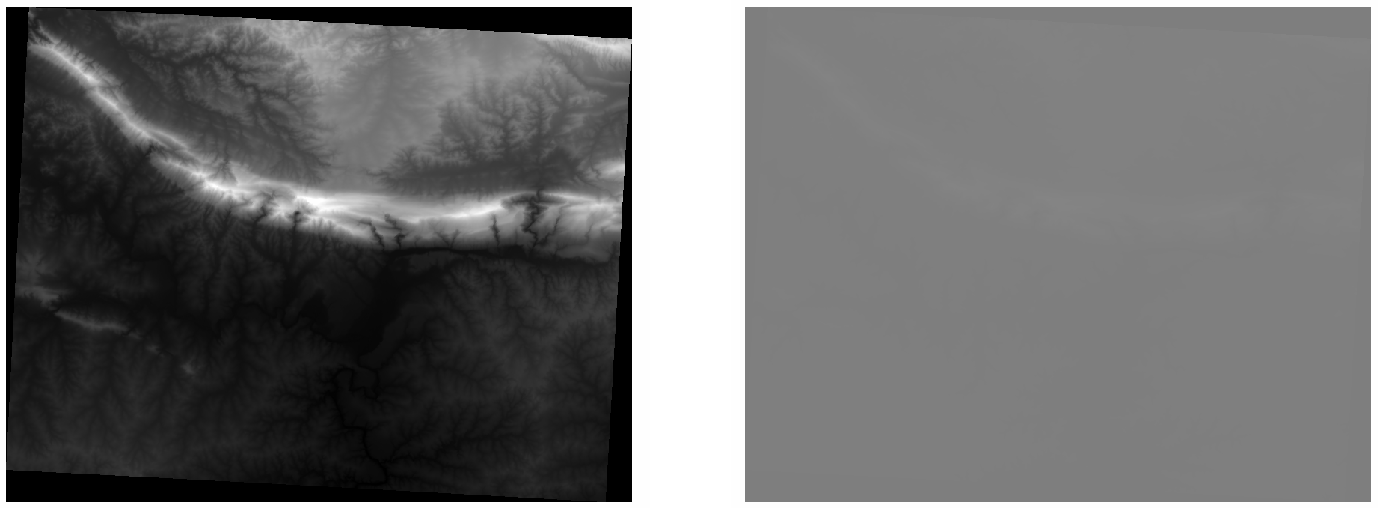
Very important is the Contrast enhancement parameter: by
default it is set to Stretch to MinMax meaning that the pixel
values are stretched to the minimum and maximum values.
Veja a diferença com o aprimoramento (esquerda) e sem (direita):
But what are the minimum and maximum values that should be used for the stretch? The ones that are currently under Min / Max Value Settings. There are many ways to calculate the minimum and maximum values and use them for the stretch:
User Defined: you enter the Min and Max values manually
Cumulative count cut: this is useful when you have some extreme low or high values. It cuts the
2%(or the value you choose) of these valuesMin / max: os valores mínimos e máximos Reais ou Estimados do raster
Média +/- desvio padrão: os valores serão calculados de acordo com o valor médio e o desvio padrão
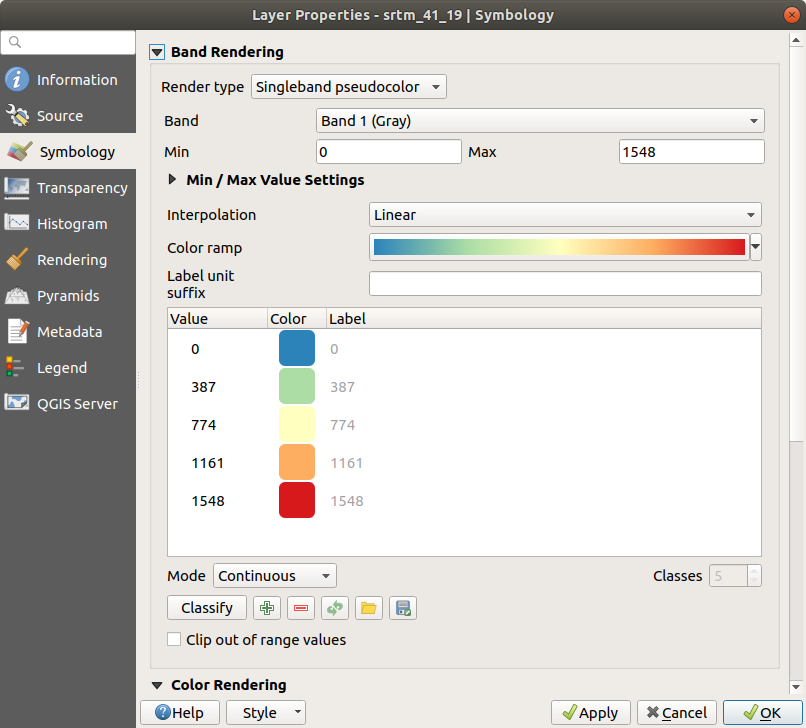
7.2.4. ★☆☆ Follow Along: Singleband pseudocolor
Os tons de cinza nem sempre são bons estilos para camadas rasterizadas. Vamos tentar tornar o MDE mais colorido.
Change the Render type to Singleband pseudocolor. If you don’t like the default colors loaded, select another Color ramp
Clique no botão Classificar para gerar uma nova classificação de cores
Se não for gerado automaticamente clique no botão OK para aplicar esta classificação ao MDE
Verás el ráster con este aspecto:
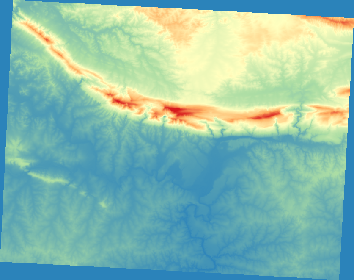
Esta é uma maneira interessante de olhar para o MDE. Você verá agora que os valores do raster são novamente exibidos corretamente, passando do azul para as áreas inferiores e o vermelho para as superiores.
7.2.5. Follow Along: Changing the transparency
Às vezes, mudar a transparência de toda a camada raster pode ajudar a ver outras camadas cobertas pelo próprio raster e a entender melhor a área de estudo.
To change the transparency of the whole raster switch to the Transparency tab and use the slider of the Global Opacity to lower the opacity:
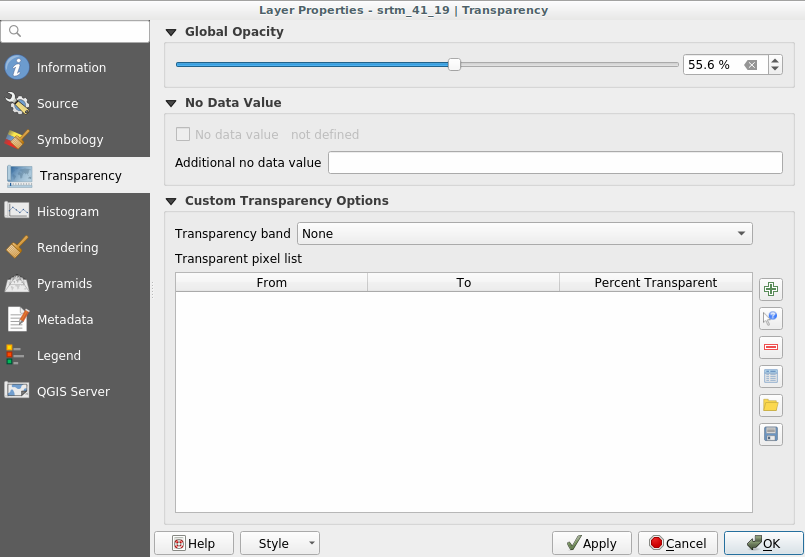
More interesting is changing the transparency for some pixel values. For example in the raster we used you can see a homogeneous color at the corners. To set these pixels as transparent, go to Custom Transparency Options in the Transparency tab.
By clicking on the
 Add values manually button,
you can add a range of values and set their transparency percentage
Add values manually button,
you can add a range of values and set their transparency percentageFor single values the
 Add values from display
button is more useful
Add values from display
button is more usefulClick on the
Add values from display button.
The dialog disappears, and you can interact with the map.Click on the homogeneous color in a corner of the DEM
Você verá que a tabela de transparência será preenchida com os valores selecionados:
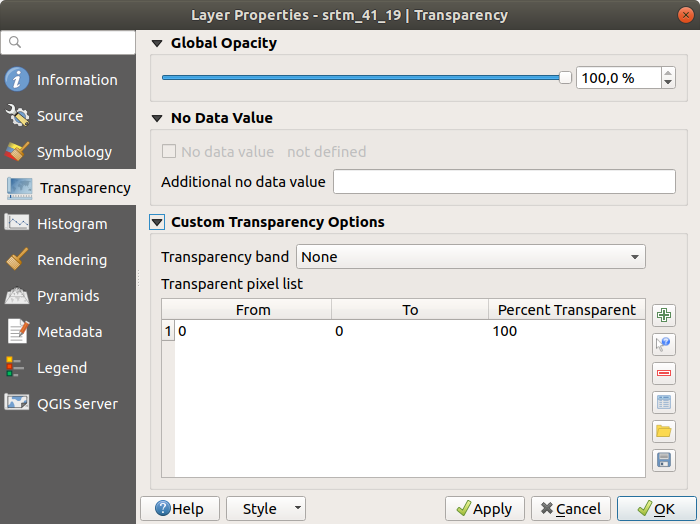
Click on OK to close the dialog and see the changes.
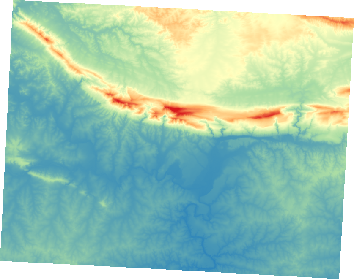
Viu? Os cantos agora são 100% transparentes.
7.2.6. In Conclusion
These are some the basic functions to get you started with raster symbology. QGIS also gives you many other options, such as symbolizing a layer using paletted/unique values, representing different bands with different colors in a multispectral image, or making an automatic hillshade effect (useful only with DEM raster files).
7.2.7. Referencia
The SRTM dataset was obtained from CGIAR CSI website.
7.2.8. What’s Next?
Ahora que podemos ver nuestros datos adecuadamente representados, investiguemos cómo podemos analizarlos todavía mejor.