Wichtig
Übersetzen ist eine Gemeinschaftsleistung Sie können mitmachen. Diese Seite ist aktuell zu 37.18% übersetzt.
9.2. Übungseinheit: Nützliche QGIS Erweiterungen
Nachdem Sie nun wissen, wie man Erweiterungen installiert, aktiviert und deaktiviert, wollen wir uns anhand einiger praktischer Beispiele nützliche Erweiterungen ansehen.
Ziel der Übungseinheit: Sich mit der Erweiterungsverwaltung weiter vertraut machen und einige nützliche Erweiterungen kennenlernen.
9.2.1. ★☆☆ Zum Mitmachen: Die QuickMapServices Erweiterung
Die Erweiterung QuickMapServices ist eine benutzerfreundliche Erweiterung, mit dem Sie Ihrem QGIS-Projekt schnell und einfach Hintergrundkarten bzw. Basemaps hinzufügen können. Sie bietet zahlreiche Optionen und Einstellungen. Lassen Sie uns beginnen, einige der Funktionen zu erkunden.
Starten Sie ein neues Projekt und fügen Sie den Layer
roadsaus dem GeoPackagetraining_datahinzu.Installieren Sie die QuickMapServices Erweiterung.
Klicken Sie auf . Das erste Menü listet verschiedene Kartenanbieter (
OSM,NASA) mit den verfügbaren Karten auf.Klicken Sie auf einen Eintrag, um die Hintergrundkarte bzw. Basemap in Ihr Projekt zu laden.

Sehr gut! Eine der Hauptstärken von QMS besteht jedoch darin, Zugriff auf zahlreiche weitere Datenanbieter zu ermöglichen. Fügen wir diese hinzu.
Klicken Sie auf .
Navigieren Sie zum Reiter More services tab.
Lesen Sie den Hinweis in diesem Reiter aufmerksam durch. Wenn Sie einverstanden sind, klicken Sie auf die Schaltfläche Get Contributed pack.
Klicken Sie auf Save.
Öffnen Sie das Menü erneut. Sie werden sehen, dass nun weitere Anbieter verfügbar sind.

Wählen Sie den Anbieter, der Ihren Anforderungen am besten entspricht, und laden Sie die Daten in das Projekt!
Es ist auch möglich, die nun verfügbaren Datenanbieter zu durchsuchen.
Öffnen Sie das Suchfeld der Erweiterung über . Diese Option ermöglicht es Ihnen, die verfügbaren Hintergrundkarten anhand des aktuellen Kartenausschnitts oder über ein Suchwort zu filtern.
Klicken Sie auf Filter by extent, woraufhin ein verfügbarer Dienst angezeigt werden sollte. Wenn kein Dienst gefunden wird, zoomen Sie heraus, verschieben Sie den Kartenausschnitt weltweit (oder an Ihren Standort) oder suchen Sie anhand eines Stichworts.
Klicken Sie neben einem zurückgegebenen Datensatz auf die Schaltfläche Add, um ihn zu laden.
Die Basiskarte wird geladen und Sie erhalten einen Hintergrund für Ihre Karte.

9.2.2. ★☆☆ Follow Along: The QuickOSM Plugin
With an incredible simple interface, the QuickOSM plugin allows you to download OpenStreetMap data.
★☆☆ Follow Along: Using the Quick Query
Start a new empty project and add the
roadslayer from thetraining_dataGeoPackage.Install the QuickOSM plugin. The plugin adds two new buttons in the QGIS Toolbar and is accessible in the menu.
Open the QuickOSM dialog. The plugin has many different tabs: we will use the Quick Query one.
You can download specific features by selecting a generic Key or be more specific and choose a specific Key and Value pair.
Tipp
if you are not familiar with the Key and Value system, click on the Help with key/value button. It will open a web page with a complete description of this concept of OpenStreetMap.
Look for
railwayin the Key menu and let the Value be empty: so we are downloading all therailwayfeatures without specifying any values.Select Layer Extent in the next drop-down menu and choose
roads.Click on the Run query button.
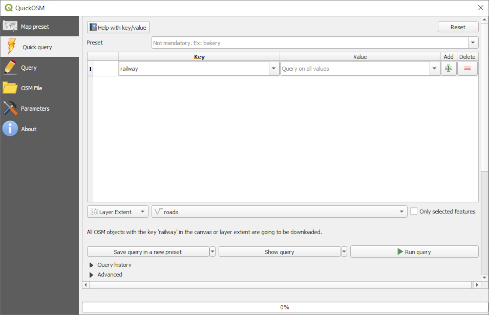
After some seconds the plugin will download all the features tagged in OpenStreetMap
as railway and load them directly into the map.
Nothing more! All the layers are loaded in the legend and are shown in the map canvas.

Warnung
QuickOSM creates temporary layer when downloading the data. If you
want to save them permanently, click on the  icon next to the
layer and choose the options you prefer. Alternatively you can open the
Advanced menu in QuickOSM and choose where to save the data in the
Directory menu.
★★★ Follow Along: The QuickOSM Query engine
The quickest way to download data from QuickOSM plugin is using the Quick query tab and set some small parameters. But if you need some more specific data?
If you are an OpenStreetMap query master you can use QuickOSM plugin also with your personal queries.
QuickOSM has an incredible data parser that, together with the amazing query engine of Overpass, lets you download data with your specific needs.
For example: we want to download the mountain peaks that belongs into a specific mountain area known as Dolomites.
You cannot achieve this task with the Quick query tab, you have to be more specific and write your own query. Let’s try to do this.
Start a new project.
Open the QuickOSM plugin and click on the Query tab.
Copy and paste the following code into the query canvas:
  <!--
This shows all mountains (peaks) in the Dolomites.
You may want to use the "zoom onto data" button. =>
-->
<osm-script output="json">
<!-- search the area of the Dolomites -->
<query type="area">
  <has-kv k="place" v="region"/>
  <has-kv k="region:type" v="mountain_area"/>
  <has-kv k="name:en" v="Dolomites"/>
</query>
<print mode="body" order="quadtile"/>
<!-- get all peaks in the area -->
<query type="node">
  <area-query/>
  <has-kv k="natural" v="peak"/>
</query>
<print mode="body" order="quadtile"/>
<!-- additionally, show the outline of the area -->
<query type="relation">
  <has-kv k="place" v="region"/>
  <has-kv k="region:type" v="mountain_area"/>
  <has-kv k="name:en" v="Dolomites"/>
</query>
<print mode="body" order="quadtile"/>
<recurse type="down"/>
<print mode="skeleton" order="quadtile"/>
</osm-script>
Bemerkung
This query is written in a
xmllike language. If you are more used to theOverpass QLyou can write the query in this language.And click on Run Query:
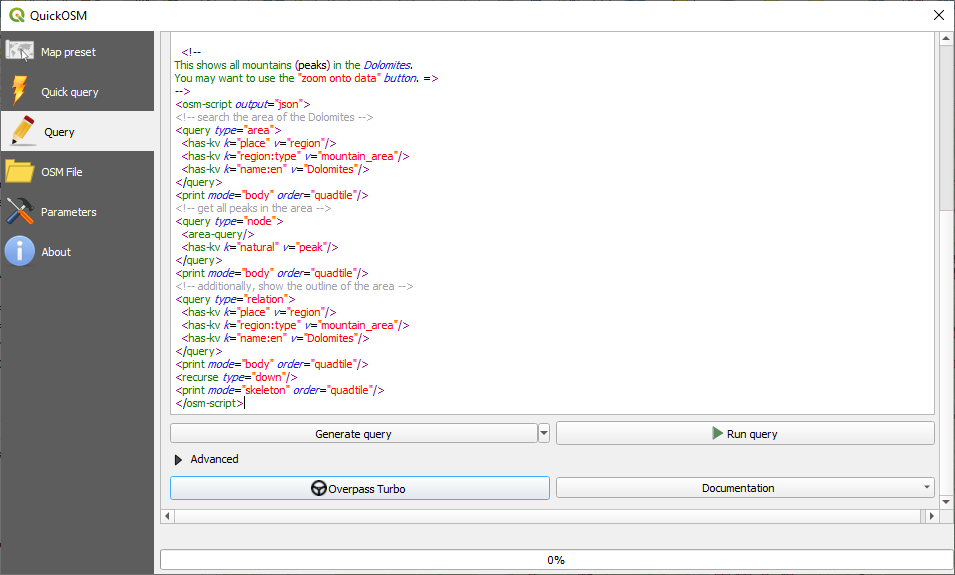
The mountain peaks layer will be downloaded and shown in QGIS:

You can write complex queries using the Overpass Query language. Take a look at some example and try to explore the query language.
9.2.3. ★☆☆ Follow Along: The DataPlotly Plugin
The DataPlotly plugin allows you to create D3 plots of vector attributes data thanks to the plotly library.
Start a new project
Load the
sample_pointslayer from theexercise_data/pluginsfolderInstall the plugin following the guidelines described in ★☆☆ Zum Mitmachen: Neue Erweiterungen installieren searching Data Plotly
Open the plugin by clicking on the new icon in the toolbar or in the menu
In the following example we are creating a simple Scatter Plot of two fields
of the sample_points layer.
In the DataPlotly Panel:
Choose
sample_pointsin the Layer filter, cl for the X Field and mg for the Y Field:
If you want you can change the colors, the marker type, the transparency and many other settings: try to change some parameters to create the plot below.
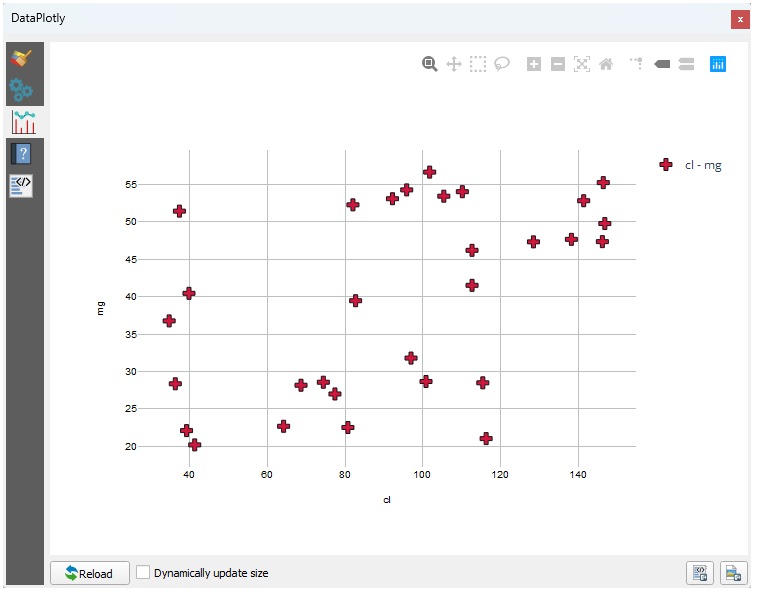
Once you have set all the parameters, click on the Create Plot button to create the plot.
The plot is interactive: this means you can use all the upper buttons to resize, move, or zoom in/out the plot canvas. Moreover, each element of the plot is interactive: by clicking or selecting one or more point on the plot, the corresponding point(s) will be selected in the plot canvas.
You can save the plot as a png static image or as an html file by clicking
on the  or on the
 button in the lower right corner
of the plot.
There is more. Sometimes it can be useful to have two (or more) plots showing different plot types with different variables on the same page. Let’s do this!
Go back to the main plot settings tab by clicking on the
 button
in the upper left corner of the plugin panel
Change the Plot Type to Box Plot
Choose group as Grouping Field and ph as Y Field
In the lower part of the panel, change the Type of Plot from SinglePlot to SubPlots and let the default option Plot in Rows selected.
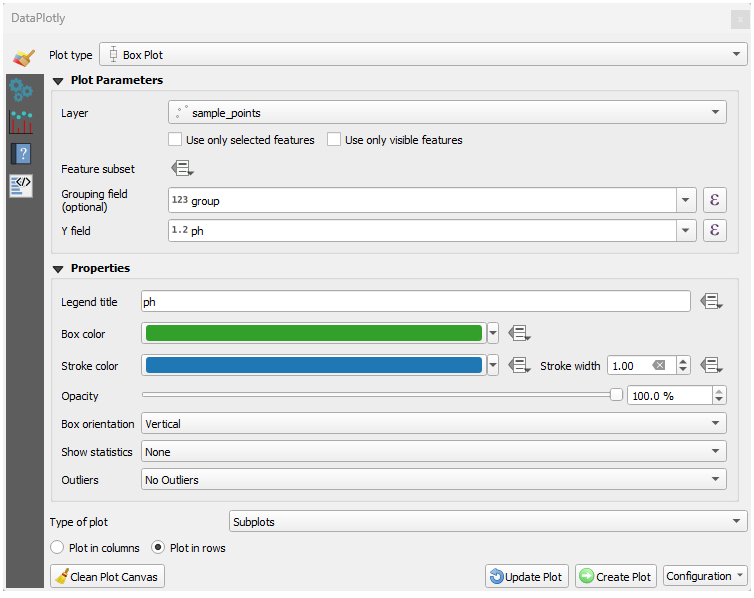
Once done click on the Create Plot button to draw the plot
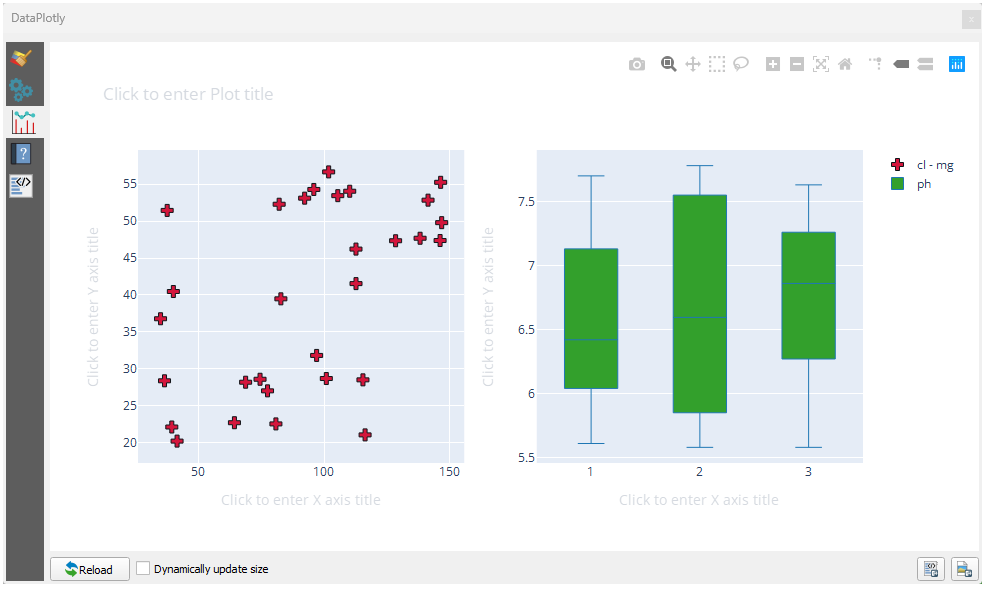
Now both scatter plot and box plot are shown in the same plot page. You still have the chance to click on each plot item and select the corresponding features in the map canvas.
Tipp
Each plot has its own manual page available in the  tab.
Try to explore all the plot types and see all the other settings available.
9.2.4. Zusammenfassung
There are many useful plugins available for QGIS. Using the built-in tools for installing and managing these plugins, you can find new plugins and make optimum use of them.
9.2.5. Was kommt als Nächstes?
Next we’ll look at how to use layers that are hosted on remote servers in real time.