` `
The toolbox
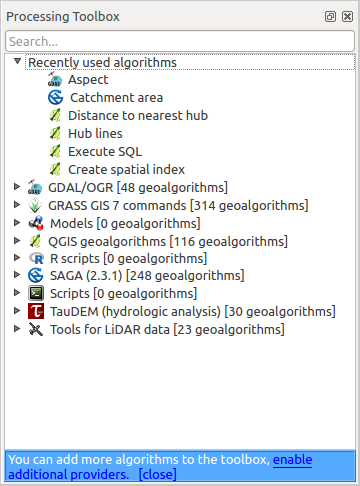
The Toolbox is the main element of the processing GUI, and the one that you are more likely to use in your daily work. It shows the list of all available algorithms grouped in different blocks, and it is the access point to run them, whether as a single process or as a batch process involving several executions of the same algorithm on different sets of inputs.
공간 처리 툴박스
The toolbox contains all the available algorithms, divided into so-called “Providers”.
Providers can be (de)activated in the settings dialog. A label in the bottom part of the toolbox will remind you of that whenever there are inactive providers. Use the link in the label to open the settings window and set up providers. We will discuss the settings dialog later in this manual.
By default, only providers that do not rely on third-party applications (that is, those that only require QGIS elements to be run) are active. Algorithms requiring external applications might need additional configuration. Configuring providers is explained in a later chapter in this manual.
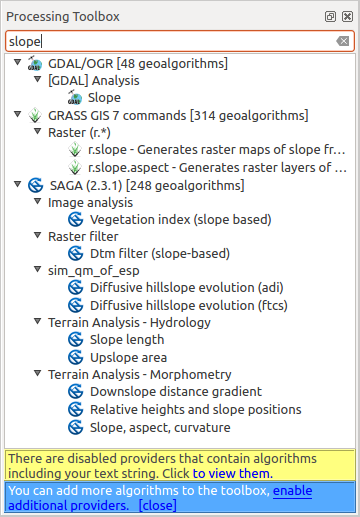
In the upper part of the toolbox, you will find a text box. To reduce the number of algorithms shown in the toolbox and make it easier to find the one you need, you can enter any word or phrase on the text box. Notice that, as you type, the number of algorithms in the toolbox is reduced to just those that contain the text you have entered in their names.
If there are algorithms that match your search but belong to a provider that is not active, an additional label will be shown in the lower part of the toolbox.
검색 결과를 표시하는 공간 처리 툴박스
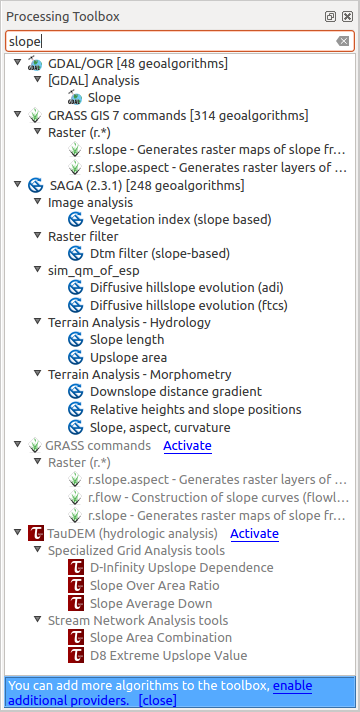
If you click on the link in that label, the list of algorithms will also include those from inactive providers, which will be shown in light gray. A link to active each inactive provider is also shown.
검색 결과를 표시하는 공간 처리 툴박스
To execute an algorithm, just double-click on its name in the toolbox.
알고리즘 대화창
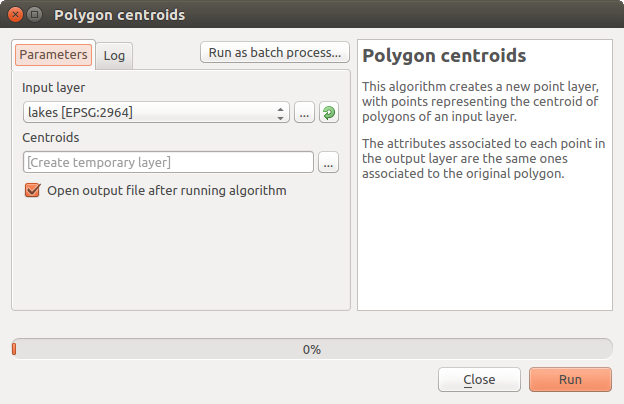
Once you double-click on the name of the algorithm that you want to execute, a dialog similar to that in the figure below is shown (in this case, the dialog corresponds to the ‘Polygon centroids’ algorithm).
파라미터 탭
이 탭에서 알고리즘을 실행하는 데 필요한 입력값들을 설정할 수 있습니다. 이 탭은 설정해야 할 입력값 및 환경 설정 파라미터 목록을 표시합니다. 물론 실행할 알고리즘의 요구 사항에 따라 목록 내용이 달라지며, 해당 요구 사항을 기반으로 자동적으로 생성됩니다.
알고리즘의 특성에 따라 파라미터의 개수 및 유형이 달라지긴 해도, 대화창의 구조는 모두 비슷합니다. 대화창에 있는 파라미터는 다음 유형들 가운데 하나일 것입니다:
래스터 레이어: QGIS에서 (현재 열려 있는) 사용할 수 있는 모든 래스터 레이어의 목록 가운데 선택할 수 있습니다. 이 선택기의 오른쪽에 있는
 버튼을 누르면 현재 QGIS가 불러오지 않은 레이어를 나타내는 파일명을 선택할 수도 있습니다.
벡터 레이어: QGIS 사용할 수 있는 모든 벡터 레이어의 목록 가운데 선택할 수 있습니다. 래스터 레이어의 경우와 마찬가지로 QGIS가 불러오지 않은 레이어도 선택할 수 있는데, 알고리즘이 레이어의 속성 테이블에서 선택된 테이블 필드를 요구하지 않는 경우에만 선택할 수 있습니다. 알고리즘이 이런 필드를 요구하는 경우, 이미 열려 있는 레이어만 선택할 수 있습니다. 사용할 수 있는 필드명 목록을 가져오려면 먼저 레이어를 불러와야 하기 때문입니다.
각 벡터 레이어 선택기 옆에는 다음 그림에 있는 반복기(iterator) 버튼도 있습니다.
벡터 반복기 버튼
벡터 레이어를 여러 개 선택해야 하는 알고리즘의 경우, 반복기 버튼들 가운데 하나만 켜고 끌 수 있습니다. 입력 벡터 레이어에 대응하는 버튼을 켜면, 알고리즘을 해당 레이어 전체에 대해 한 번 실행하는 대신 레이어의 모든 객체에 대해 반복 실행해서 알고리즘 실행 횟수만큼 산출물을 생성합니다. 레이어에 있는 모든 피처를 개별적으로 처리해야 하는 경우 해당 프로세스를 이 버튼으로 자동화할 수 있습니다.
테이블: QGIS에서 사용할 수 있는 모든 테이블의 목록 가운데 선택할 수 있습니다. QGIS는 비공간 테이블도 벡터 레이어처럼 불러오며, 사실 벡터 레이어처럼 취급합니다. 현재, 테이블이 필요한 알고리즘 실행 시 표시되는 사용할 수 있는 테이블의 목록은 dBase(.dbf) 또는 쉼표 구분 값(.csv) 포맷의 파일에 있는 테이블로 제한되어 있습니다.
옵션: 사용 가능한 옵션들의 목록 가운데 선택할 수 있습니다.
A numerical value, to be introduced in a spin box. You will find a button by its side. Clicking on it, you will open the expression builder that allows you to enter a mathematical expression, so you can use it as a handy calculator. Some useful variables related to data loaded into QGIS can be added to your expression, so you can select a value derived from any of these variables, such as the cell size of a layer or the northernmost coordinate of another one.
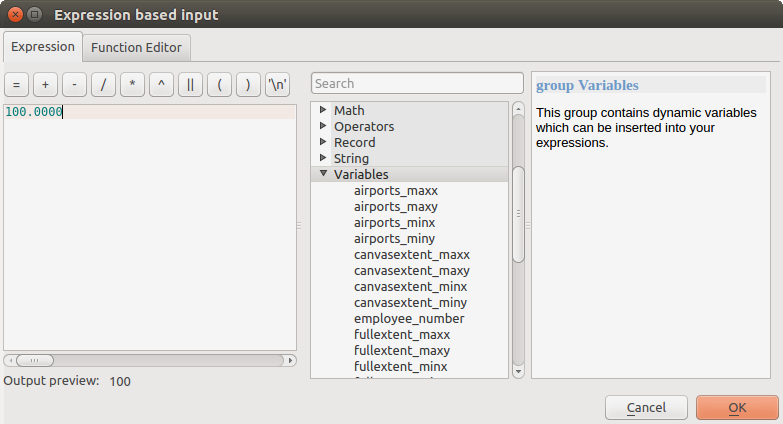
표현식 기반 입력
범위(range): 텍스트 란 2개를 통해 최소 및 최대 값을 설정할 수 있습니다.
텍스트 문자열: 텍스트 상자에 문자열을 입력할 수 있습니다.
필드: 벡터 레이어의 속성 테이블에서 또는 다른 파라미터를 통해 선택한 단일 테이블에서 필드를 선택할 수 있습니다.
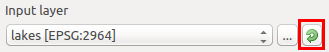
A coordinate reference system. You can type the EPSG code directly in the text box, or select it from the CRS selection dialog that appears when you click on the button on the right-hand side.
An extent, to be entered by four numbers representing its xmin, xmax, ymin, ymax limits. Clicking on the button on the right-hand side of the value selector, a pop-up menu will appear, giving you three options:
- to select the value from a layer or the current canvas extent,
- to define it by dragging directly onto the map canvas, or
- to use the minimum coverage from all input layers.
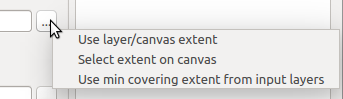
범위 선택기
첫 번째 옵션을 선택하면, 다음 그림과 같은 창이 열립니다.
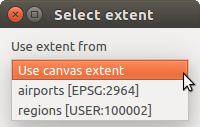
범위 목록
두 번째 옵션을 선택하면, 파라미터 대화창이 사라져서 캔버스 상에서 직사각형을 클릭&드래그할 수 있게 됩니다. 직사각형을 정의하고 나면, 대화창이 범위 텍스트 란에 값을 담은 채 다시 나타납니다.
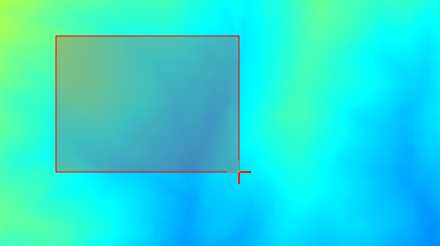
범위 클릭&드래그
A list of elements (whether raster layers, vector layers or tables), to select from the list of such layers available in QGIS. To make the selection, click on the small button on the left side of the corresponding row to see a dialog like the following one.
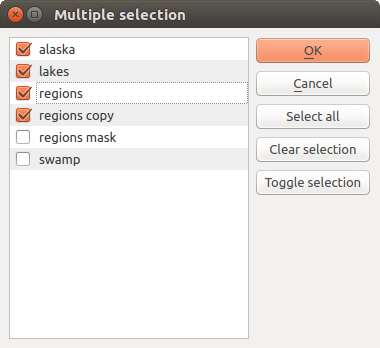
다중 선택
간소 테이블: 사용자가 테이블을 편집할 수 있습니다. 다른 목적도 있지만, 주로 색인(lookup) 테이블 또는 합성곱 커널(convolution kernel) 같은 파라미터를 정의하는 데 사용됩니다.
테이블을 살펴보고 우측에 있는 버튼을 클릭해서 그 값을 편집하십시오.
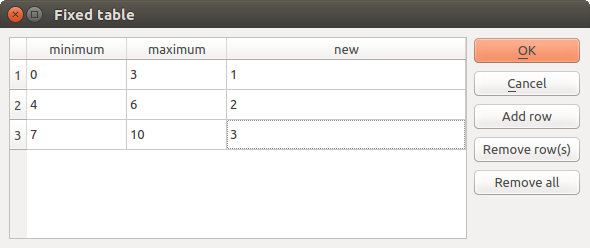
고정 테이블
알고리즘에 따라, 대화창 우측에 있는 버튼들을 사용해서 여러 행들을 수정할 수도 있고 못 할 수도 있습니다.
Log 라는 또다른 탭이 Parameters 탭 옆에 있습니다. 이 탭은 알고리즘 실행 도중 알고리즘이 제공하는 정보를 표시합니다. 알고리즘 실행 시 사용자가 그 과정을 추적하고 더 자세한 정보를 알 수 있게 해줍니다. 하지만 모든 알고리즘이 이 탭에 정보를 표시하지는 않습니다. 사실 알고리즘이 최종 파일 이외에는 어떤 정보도 출력하지 않은 채 조용히 실행되는 경우가 많습니다.
알고리즘 대화창 우측에 해당 알고리즘에 관한 짧은 설명을 표시해서 사용자가 알고리즘의 목적 및 기본 개념을 이해할 수 있도록 해주고 있습니다. 이런 설명이 존재하지 않는 경우, 설명 패널이 나타나지 않을 것입니다.
Some algorithms might have a more detailed help file, which might include description of every parameter it uses, or examples. In that case, you will find a Help tab in the parameters dialog.
투영체에 대한 소고(小考)
Algorithms that are run from the processing framework — this is also true for most of the external applications whose algorithms are exposed through it — do not perform any reprojection on input layers and assume that all of them are already in a common coordinate system and ready to be analyzed. Whenever you use more than one layer as input to an algorithm, whether vector or raster, it is up to you to make sure that they are all in the same coordinate system.
Note that, due to QGIS’s on-the-fly reprojecting capabilities, although two layers might seem to overlap and match, that might not be true if their original coordinates are used without reprojecting them onto a common coordinate system. That reprojection should be done manually, and then the resulting files should be used as input to the algorithm. Also, note that the reprojection process can be performed with the algorithms that are available in the processing framework itself.
By default, the parameters dialog will show a description of the CRS of each layer along with its name, making it easy to select layers that share the same CRS to be used as input layers. If you do not want to see this additional information, you can disable this functionality in the Processing settings dialog, unchecking the Show CRS option.
If you try to execute an algorithm using as input two or more layers with unmatching CRSs, a warning dialog will be shown.
그래도 알고리즘을 실행시킬 수는 있지만, 대부분의 경우 입력 레이어들이 서로 중첩하지 않기 때문에 텅 빈 레이어 같은 잘못된 산출물을 생성할 것이라는 점을 유념하십시오.
알고리즘이 생성한 데이터 객체
알고리즘이 생성한 데이터 객체는 다음 유형들 가운데 하나가 될 것입니다:
래스터 레이어
벡터 레이어
테이블
HTML 파일 (텍스트 및 그래픽 산출물 용)
These are all saved to disk, and the parameters table will contain a text box corresponding to each one of these outputs, where you can type the output channel to use for saving it. An output channel contains the information needed to save the resulting object somewhere. In the most usual case, you will save it to a file, but in the case of vector layers, and when they are generated by native algorithms (algorithms not using external applications) you can also save to a PostGIS or Spatialite database, or a memory layer.
산출물 채널을 선택하려면, 텍스트 란 오른쪽에 있는 버튼을 누르기만 하면 됩니다. 사용 가능한 옵션을 표시한 작은 컨텍스트 메뉴가 나타날 것입니다.
거의 대부분의 경우, ‘파일로 저장하기’를 선택하게 됩니다. 해당 옵션을 선택했다면, 원하는 파일 경로를 선택할 수 있는 파일 저장 대화창이 열릴 것입니다. 대화창의 파일 포맷 선택기에 산출물 유형 및 실행 알고리즘에 따라 지원되는 파일 확장자가 표시됩니다.
The format of the output is defined by the filename extension. The supported formats depend on what is supported by the algorithm itself. To select a format, just select the corresponding file extension (or add it, if you are directly typing the file path instead). If the extension of the file path you entered does not match any of the supported formats, a default extension will be appended to the file path, and the file format corresponding to that extension will be used to save the layer or table. Default extensions are .dbf for tables, .tif for raster layers and .shp for vector layers. These can be modified in the setting dialog, selecting any other of the formats supported by QGIS.
If you do not enter any filename in the output text box (or select the corresponding option in the context menu), the result will be saved as a temporary file in the corresponding default file format, and it will be deleted once you exit QGIS (take care with that, in case you save your project and it contains temporary layers).
You can set a default folder for output data objects. Go to the settings dialog (you can open it from the Processing menu), and in the General group, you will find a parameter named Output folder. This output folder is used as the default path in case you type just a filename with no path (i.e., myfile.shp) when executing an algorithm.
벡터 레이어를 반복 모드로 사용하는 알고리즘 실행 시, 입력한 파일 경로를 모든 생성 파일을 저장하는 기본 경로로 사용합니다. 즉 파일 경로의 파일명을 기본 명칭으로 삼아 반복 작업 차례대로 번호를 붙일 것이라는 뜻입니다. 이런 모든 생성 파일의 포맷도 파일 경로의 파일 확장자(포맷)를 따릅니다.
Apart from raster layers and tables, algorithms also generate graphics and text as HTML files. These results are shown at the end of the algorithm execution in a new dialog. This dialog will keep the results produced by any algorithm during the current session, and can be shown at any time by selecting Processing ‣ Results viewer from the QGIS main menu.
일부 외부 응용 프로그램이 (특정 확장자 제약 없이) 파일을 산출할 수도 있지만, 이런 파일들은 앞에서 설명한 어느 범주에도 속하지 않습니다. QGIS는 이런 산출물 파일을 처리하지 않는데 (현재 QGIS 프로젝트에 불러오거나 포함시키지 않는데) 왜냐하면 대부분의 경우 이런 산출물 파일의 포맷이 QGIS가 지원하는 포맷 또는 항목이 아니기 때문입니다. 예를 들면, LiDAR 데이터 용 LAS 파일이 그렇습니다. 해당 파일을 생성할 수는 있어도, 현재 실행 중인 QGIS 세션에 아무것도 새로 추가되지 않습니다.
다른 모든 산출물 유형의 경우, 알고리즘에게 파일을 생성한 다음 해당 산출물을 불러올지 여부를 알려줄 수 있는 체크박스가 존재합니다. 기본적으로, 모든 파일을 불러오도록 설정돼 있습니다.
산출물 선택은 지원하지 않습니다. 즉 모든 산출물을 생성한다는 뜻입니다. 하지만, 어떤 산출물을 저장하는 데 관심이 없을 경우 해당하는 체크박스를 체크 해제할 수 있는데, 본질적으로 산출물을 선택한 것처럼 작동합니다. (즉, 어쨌든 레이어를 생성하긴 하지만 텍스트 란을 비워놓을 경우 임시 파일로 저장해서 QGIS 종료 시 삭제할 것이라는 뜻입니다.)
Configuring the processing framework
As has been mentioned, the configuration menu gives access to a new dialog where you can configure how algorithms work. Configuration parameters are structured in separate blocks that you can select on the left-hand side of the dialog.
Along with the aforementioned Output folder entry, the General block contains parameters for setting the default rendering style for output layers (that is, layers generated by using algorithms from any of the framework GUI components). Just create the style you want using QGIS, save it to a file, and then enter the path to that file in the settings so the algorithms can use it. Whenever a layer is loaded by Processing and added to the QGIS canvas, it will be rendered with that style.
Rendering styles can be configured individually for each algorithm and each one of its outputs. Just right-click on the name of the algorithm in the toolbox and select Edit rendering styles for outputs. You will see a dialog like the one shown next.
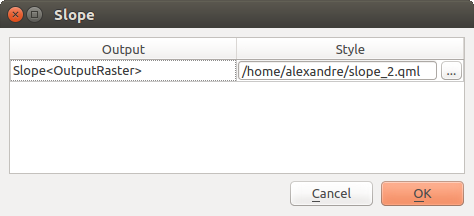
Rendering Styles
Select the style file (.qml) that you want for each output and press [OK].
Other configuration parameters in the General group are listed below:
- Use filename as layer name. The name of each resulting layer created by an algorithm is defined by the algorithm itself. In some cases, a fixed name might be used, meaning that the same output name will be used, no matter which input layer is used. In other cases, the name might depend on the name of the input layer or some of the parameters used to run the algorithm. If this checkbox is checked, the name will be taken from the output filename instead. Notice that, if the output is saved to a temporary file, the filename of this temporary file is usually a long and meaningless one intended to avoid collision with other already existing filenames.
- Keep dialog open after running algorithm. Once an algorithm has finished execution and its output layers are loaded into the QGIS project, the algorithm dialog is closed. If you want to keep it open (to run the algorithm again with different parameters, or to better check the output that is written to the log tab), check this option
- Use only selected features. If this option is selected, whenever a vector layer is used as input for an algorithm, only its selected features will be used. If the layer has no selected features, all features will be used.
- Pre-execution script file and Post-execution script file. These parameters refer to scripts written using the processing scripting functionality, and are explained in the section covering scripting and the console.
Apart from the General block in the settings dialog, you will also find a block for algorithm providers. Each entry in this block contains an Activate item that you can use to make algorithms appear or not in the toolbox. Also, some algorithm providers have their own configuration items, which we will explain later when covering particular algorithm providers.