Important
Translation is a community effort you can join. This page is currently translated at 27.27%.
17.9. Jurnalul de Procesare
Notă
Această lecție descrie procesarea jurnalului.
Toate analizele efectuate de cadrul de procesare se înregistrează în sistemul de jurnalizare al aplicației QGIS. Acest lucru vă permite să aflați mai multe despre istoricul utilizării uneltelor de procesare, pentru a putea depăși problemele atunci când acestea apar și, de asemenea, vă facilitează repetarea operațiunilor anterioare, întrucât sistemul de jurnalizare dispune de o anumită interactivitate.
To open the log, click on the balloon at the bottom right, on the QGIS status bar. Some algorithms might leave here information about their execution. For instance, those algorithms that call an external application usually log the console output of that application to this entry. If you have a look at it, you will see that the output of the SAGA algorithm that we just run (and that fails to execute because input data was not correct) is stored here.
Aceste informații v-ar putea fi utile, pentru a înțelege ce se întâmplă. Utilizatorii avansați vor putea să analizeze o ieșire, pentru a afla de ce a eșuat algoritmul. Dacă nu sunteți un utilizator avansat, informațiile respective vor fi utile celor care vă vor ajuta la diagnosticarea unei probleme, pentru a determina dacă a fost cauzată de instalarea unei aplicații externe sau de datele pe care le-ați introdus.
Chiar dacă un algoritm poate fi executat, în unele cazuri aceștia ar putea emite avertismente dacă rezultatul s-ar putea să nu fie corect. Un exemplu ar fi execuția unui algoritm de interpolare pe baza unui număr foarte mic de puncte, care, deși se poate desfășura, poate genera un rezultat incorect, atât timp cât ar fi trebuit să fie folosite mai multe puncte. Este foarte bune să verificați în mod regulat acest tip de avertismente, dacă nu vă sunt clare anumite aspecte ale unui algoritm.
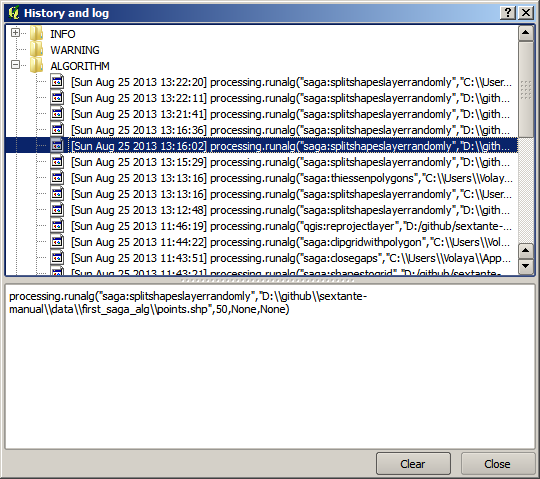
From the menu, you’ll find algorithms that are executed, regardless of they are executed from the GUI or from the console (which will be explained later in this manual). The execution is stored in this dialog as a console call. That means that everytime you run an algorithm, a console command is added to the log, and you have the full history of your working session. Here is how that history looks like:
Acest lucru poate fi foarte util atunci când începe lucrul cu consola, pentru a afla mai multe despre sintaxa algoritmilor. Îl vom folosi când vom discuta despre modul în care se pot rula comenzile de analiză din consolă.
17.9.1. ★☆☆ Follow Along
The history is also interactive, and you can run any previous algorithm just by double-clicking on its entry. This is an easy way of replicating the work we already did before.
For instance, try the following:
Open the data corresponding to the first chapter of this manual and run the algorithm explained there.
Now go to the log dialog and locate the last algorithm in the list, which corresponds to the algorithm you have just run.
Double-click on it and a new result should be produced, just like when you run it using the normal dialog and calling it from the toolbox.
17.9.2. ★★★ Advanced
You can also modify the algorithm.
Copy the algorithm call
Open the
Paste your copy to run the analysis; change the text at will.
To display the resulting file, type:
iface.addVectorLayer('/path/filename.shp', 'Layer name in legend', 'ogr')
Otherwise, you can use:
processing.runAndloadResults