Importante
Translation is a community effort you can join. This page is currently translated at 18.18%.
17.9. O log do processamento
Nota
Esta lição descreve o log de processamento.
All the analysis performed with the processing framework is logged in QGIS logging system. This allows you to know more about what has been done with the processing tools, to solve problems when they happen, and also to re–run previous operations, since the logging system also implements some interactivity.
To open the log, click on the balloon at the bottom right, on the QGIS status bar. Some algorithms might leave here information about their execution. For instance, those algorithms that call an external application usually log the console output of that application to this entry. If you have a look at it, you will see that the output of the SAGA algorithm that we just run (and that fails to execute because input data was not correct) is stored here.
Isso é útil para entender o que está acontecendo. Os usuários avançados serão capazes de analisar a saída para descobrir por que o algoritmo falhou. Se você não for um usuário avançado, isso vai ser útil para outras pessoas para ajudá-lo a diagnosticar o problema que você tem, que pode ser um problema na instalação do software externo ou um problema com os dados que você forneceu.
Even if the algorithm could be executed, some algorithms might leave warnings in case the result might not be right. For instance, when executing an interpolation algorithm with a very small amount of points, the algorithm can run and will produce a result, but it is likely that it will not be correct, since more points should be used. It’s a good idea to regularly check for this type of warnings if you are not sure about some aspect of a given algorithm.
From the menu, you’ll find algorithms that are executed, regardless of they are executed from the GUI or from the console (which will be explained later in this manual). The execution is stored in this dialog as a console call. That means that everytime you run an algorithm, a console command is added to the log, and you have the full history of your working session. Here is how that history looks like:
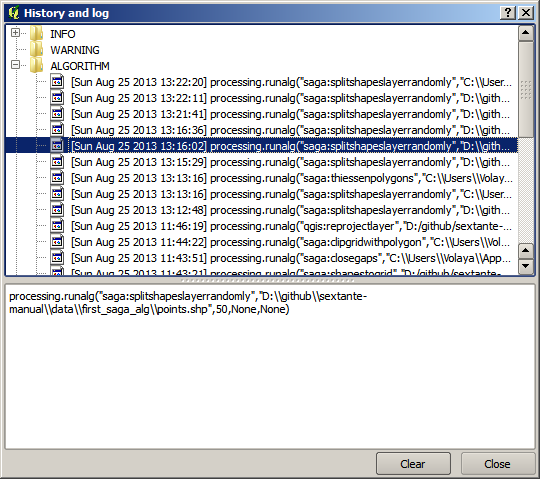
Isto pode ser muito útil quando começar a trabalhar com a console, para aprender sobre a sintaxe dos algoritmos. Vamos usá-lo quando discutirmos como executar comandos de análise a partir da console.
17.9.1. ★☆☆ Follow Along
The history is also interactive, and you can run any previous algorithm just by double-clicking on its entry. This is an easy way of replicating the work we already did before.
For instance, try the following:
Open the data corresponding to the first chapter of this manual and run the algorithm explained there.
Now go to the log dialog and locate the last algorithm in the list, which corresponds to the algorithm you have just run.
Double-click on it and a new result should be produced, just like when you run it using the normal dialog and calling it from the toolbox.
17.9.2. ★★★ Advanced
You can also modify the algorithm.
Copy the algorithm call
Open the
Paste your copy to run the analysis; change the text at will.
To display the resulting file, type:
iface.addVectorLayer('/path/filename.shp', 'Layer name in legend', 'ogr')
Otherwise, you can use:
processing.runAndloadResults