Importante
La traducción es un esfuerzo comunitario al que puedes unirte. Esta página está actualmente traducida en 31.82%.
17.9. El registro de procesamiento
Nota
Esta lección describe el registro de procesamiento.
Todo el análisis realizado con el marco de procesamiento se registra en el sistema de registro de QGIS. Esto le permite saber más sobre lo que se ha hecho con las herramientas de procesamiento, para resolver los problemas cuando se producen, y también para re-ejecutar las operaciones anteriores, ya que el sistema de registro también implementa cierta interactividad.
To open the log, click on the balloon at the bottom right, on the QGIS status bar. Some algorithms might leave here information about their execution. For instance, those algorithms that call an external application usually log the console output of that application to this entry. If you have a look at it, you will see that the output of the SAGA algorithm that we just run (and that fails to execute because input data was not correct) is stored here.
Esto es útil para entender lo que está pasando. Los usuarios avanzados podrán analizar esa salida para averiguar por qué el algoritmo falló. Si usted no es un usuario avanzado, esto va a ser útil para otros y ayudar a diagnosticar el problema que tiene, lo que podría ser un problema en la instalación del software externo o un problema con los datos que nos ha facilitado.
Incluso si el algoritmo pueden ser ejecutados, algunos de ellos pueden dejar advertencias en caso de que los resultados no sean correctos. Por ejemplo, cuando ejecuta un algoritmo de interpolación con una pequeña cantidad de puntos, el algoritmo puede ejecutar y producir un resultado, pero es probable que no sea correcto, ya que se deben utilizar más puntos. Es una buena idea revisar regularmente este tipo de advertencias si no esta seguro acerca de algunos aspectos de un algoritmo dado.
From the menu, you’ll find algorithms that are executed, regardless of they are executed from the GUI or from the console (which will be explained later in this manual). The execution is stored in this dialog as a console call. That means that everytime you run an algorithm, a console command is added to the log, and you have the full history of your working session. Here is how that history looks like:
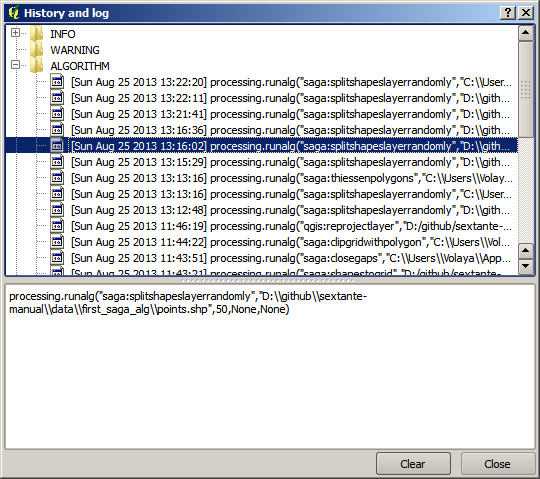
Esto puede ser muy útil cuando inicia el trabajo con la consola, para aprender acerca de la sintaxis de los algoritmos. Vamos a utilizarlos cuando se discuta cómo ejecutar comandos de análisis desde la consola.
17.9.1. ★☆☆ Follow Along
The history is also interactive, and you can run any previous algorithm just by double-clicking on its entry. This is an easy way of replicating the work we already did before.
For instance, try the following:
Open the data corresponding to the first chapter of this manual and run the algorithm explained there.
Now go to the log dialog and locate the last algorithm in the list, which corresponds to the algorithm you have just run.
Double-click on it and a new result should be produced, just like when you run it using the normal dialog and calling it from the toolbox.
17.9.2. ★★★ Advanced
You can also modify the algorithm.
Copy the algorithm call
Open the
Paste your copy to run the analysis; change the text at will.
To display the resulting file, type:
iface.addVectorLayer('/path/filename.shp', 'Layer name in legend', 'ogr')
Otherwise, you can use:
processing.runAndloadResults